. 2023 Feb 6;58(3):211-223.e5.
doi: 10.1016/j.devcel.2023.01.004. Epub 2023 Jan 27.

Specialized cells that sense tissue mechanics to regulate Drosophila morphogenesis

Affiliations

Specialized cells that sense tissue mechanics to regulate Drosophila morphogenesis

Hui-Yu Ku et al. Dev Cell. .

Abstract

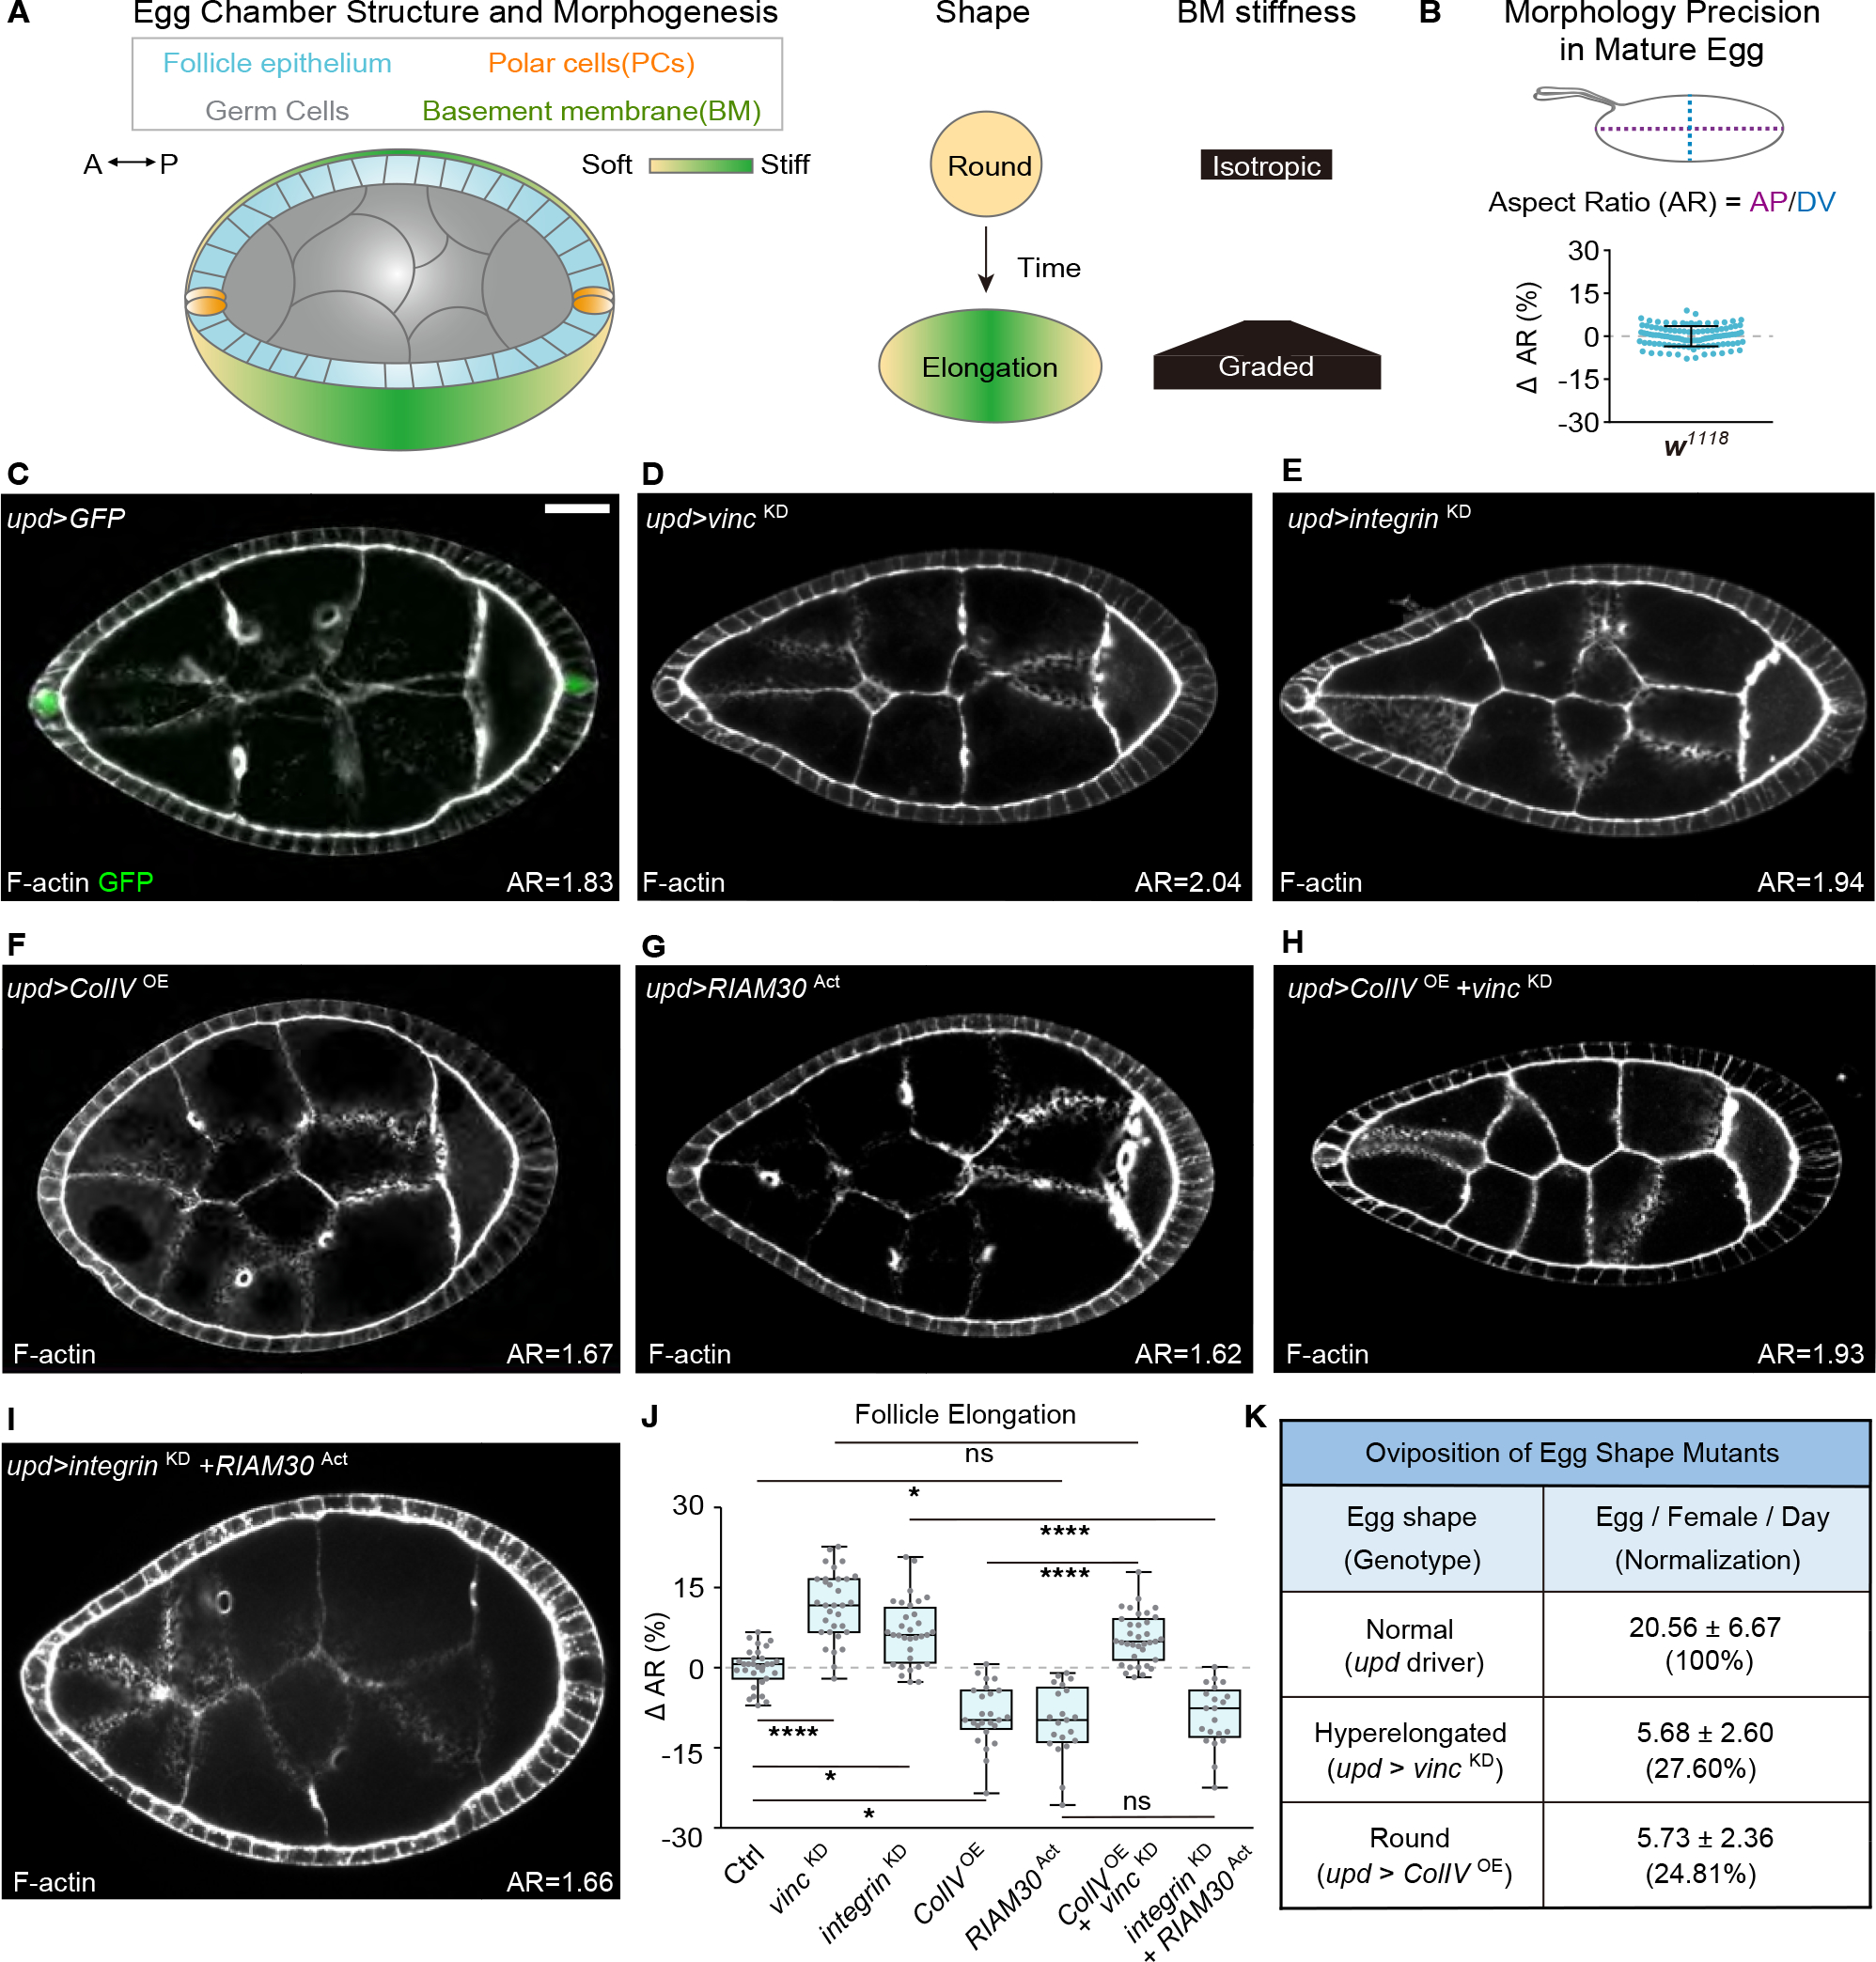
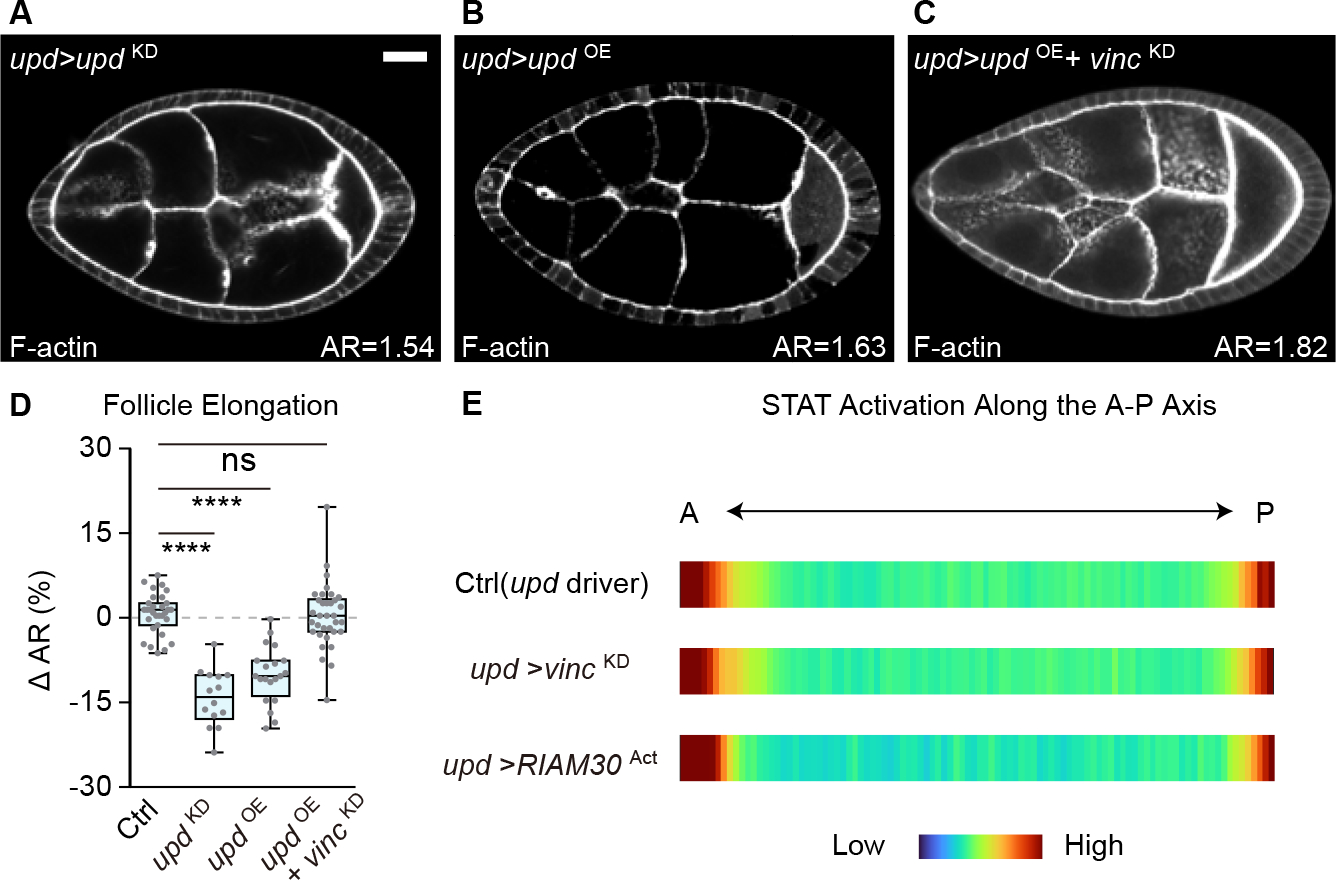
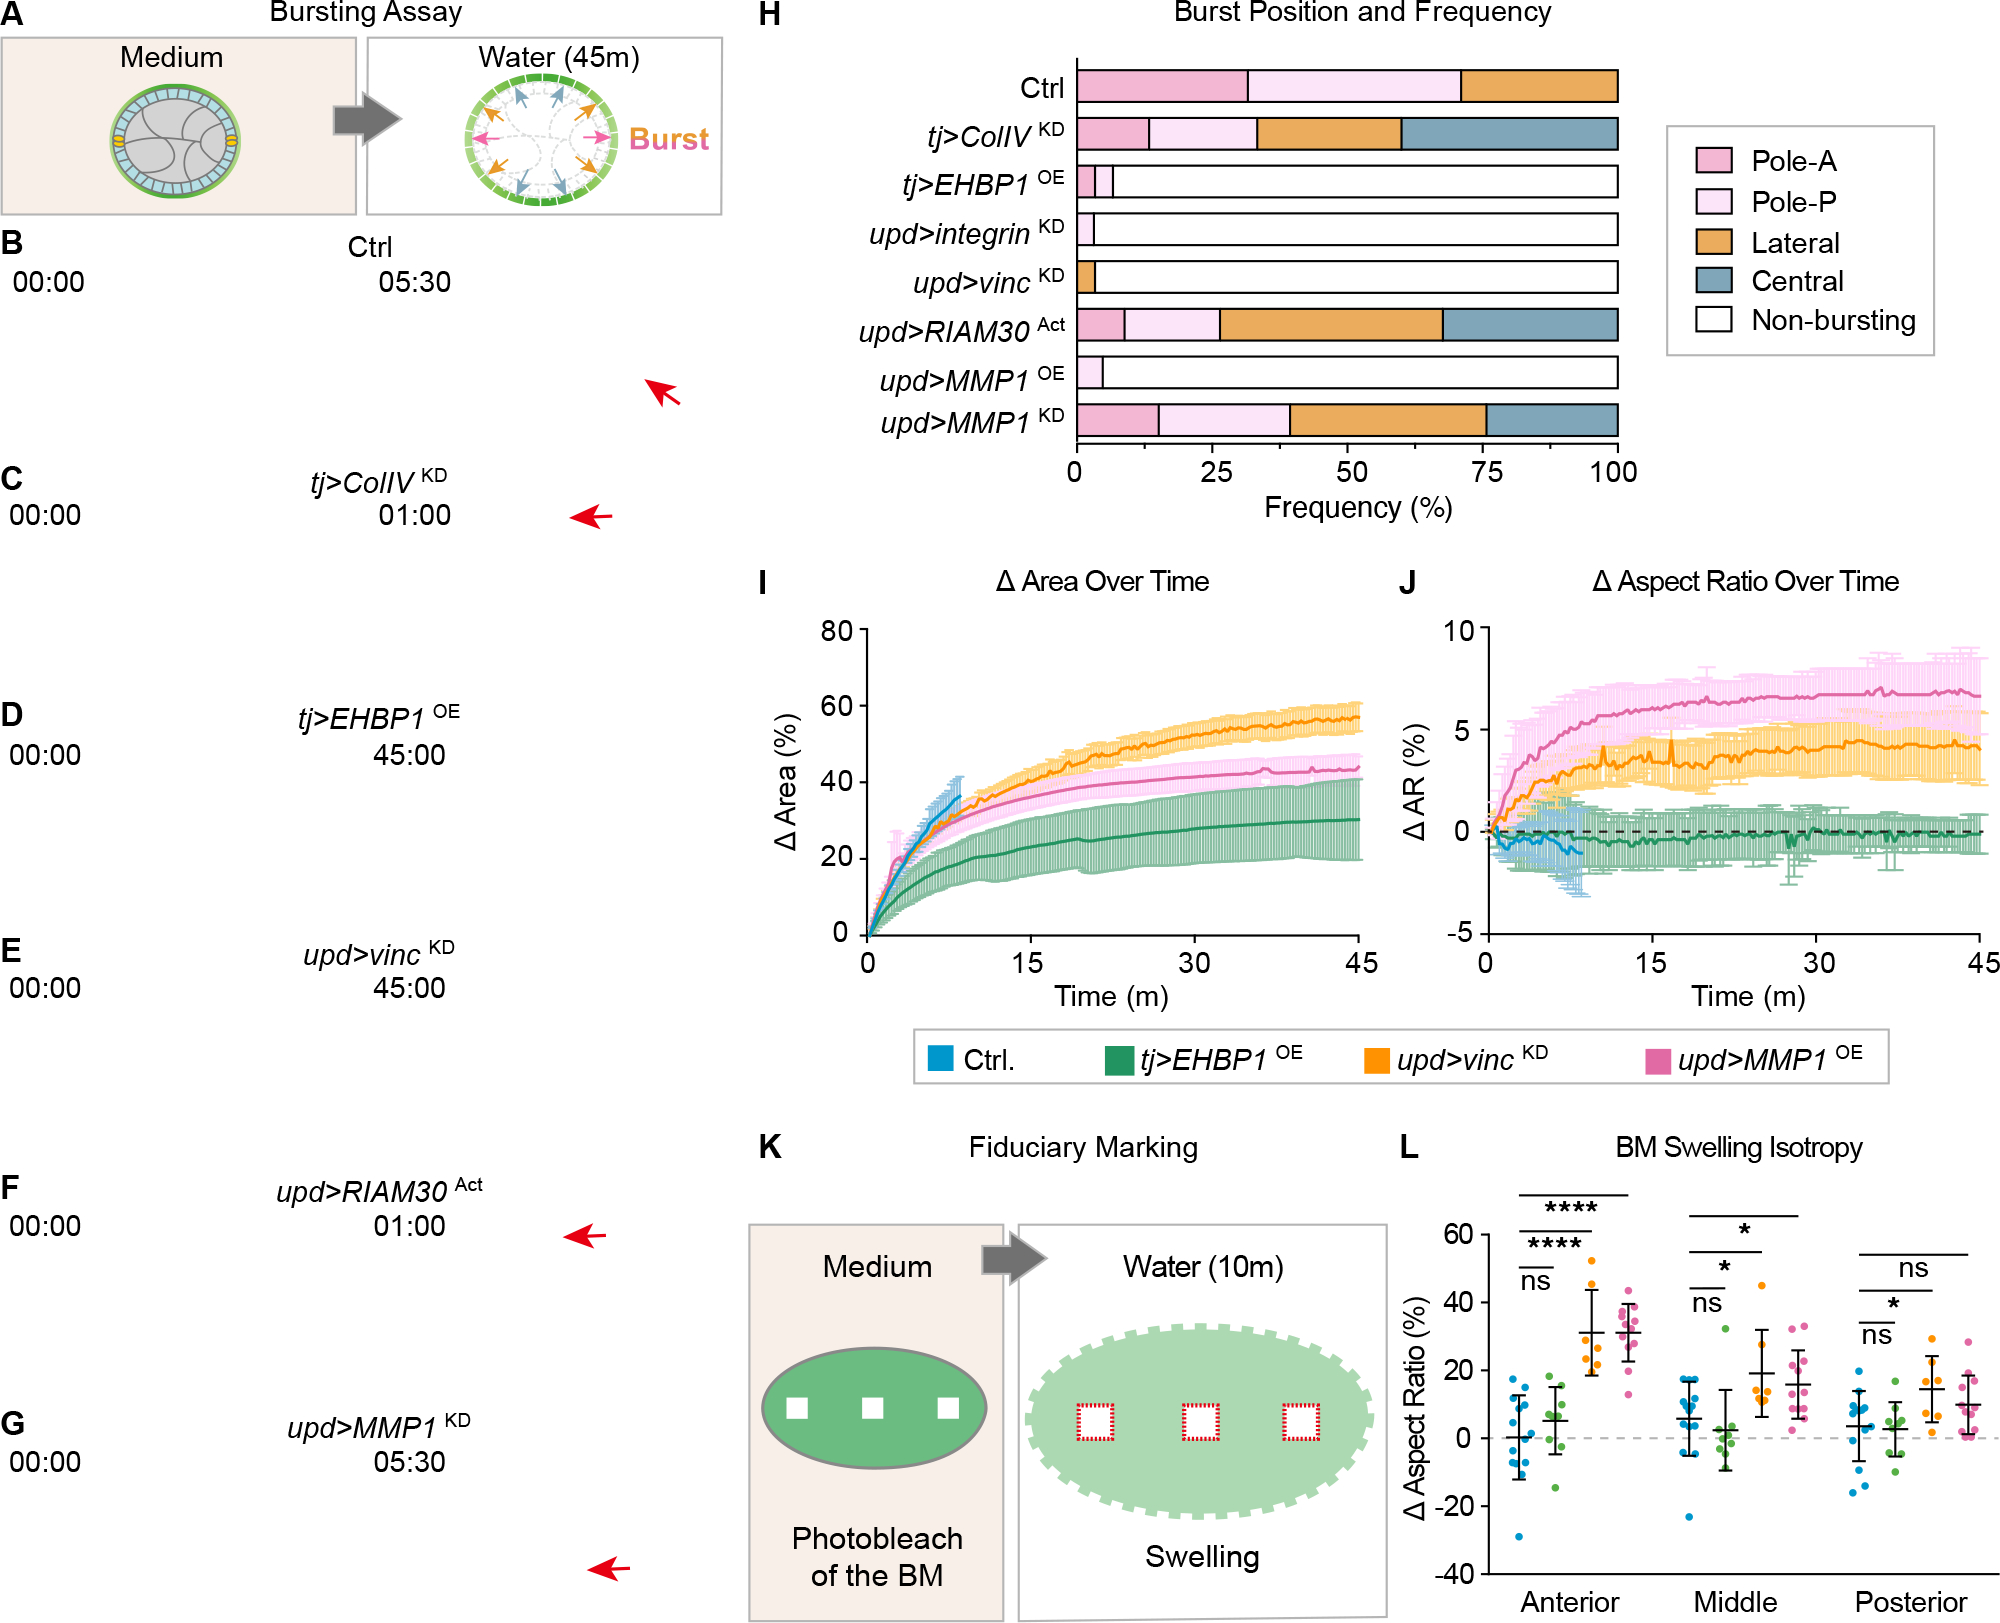
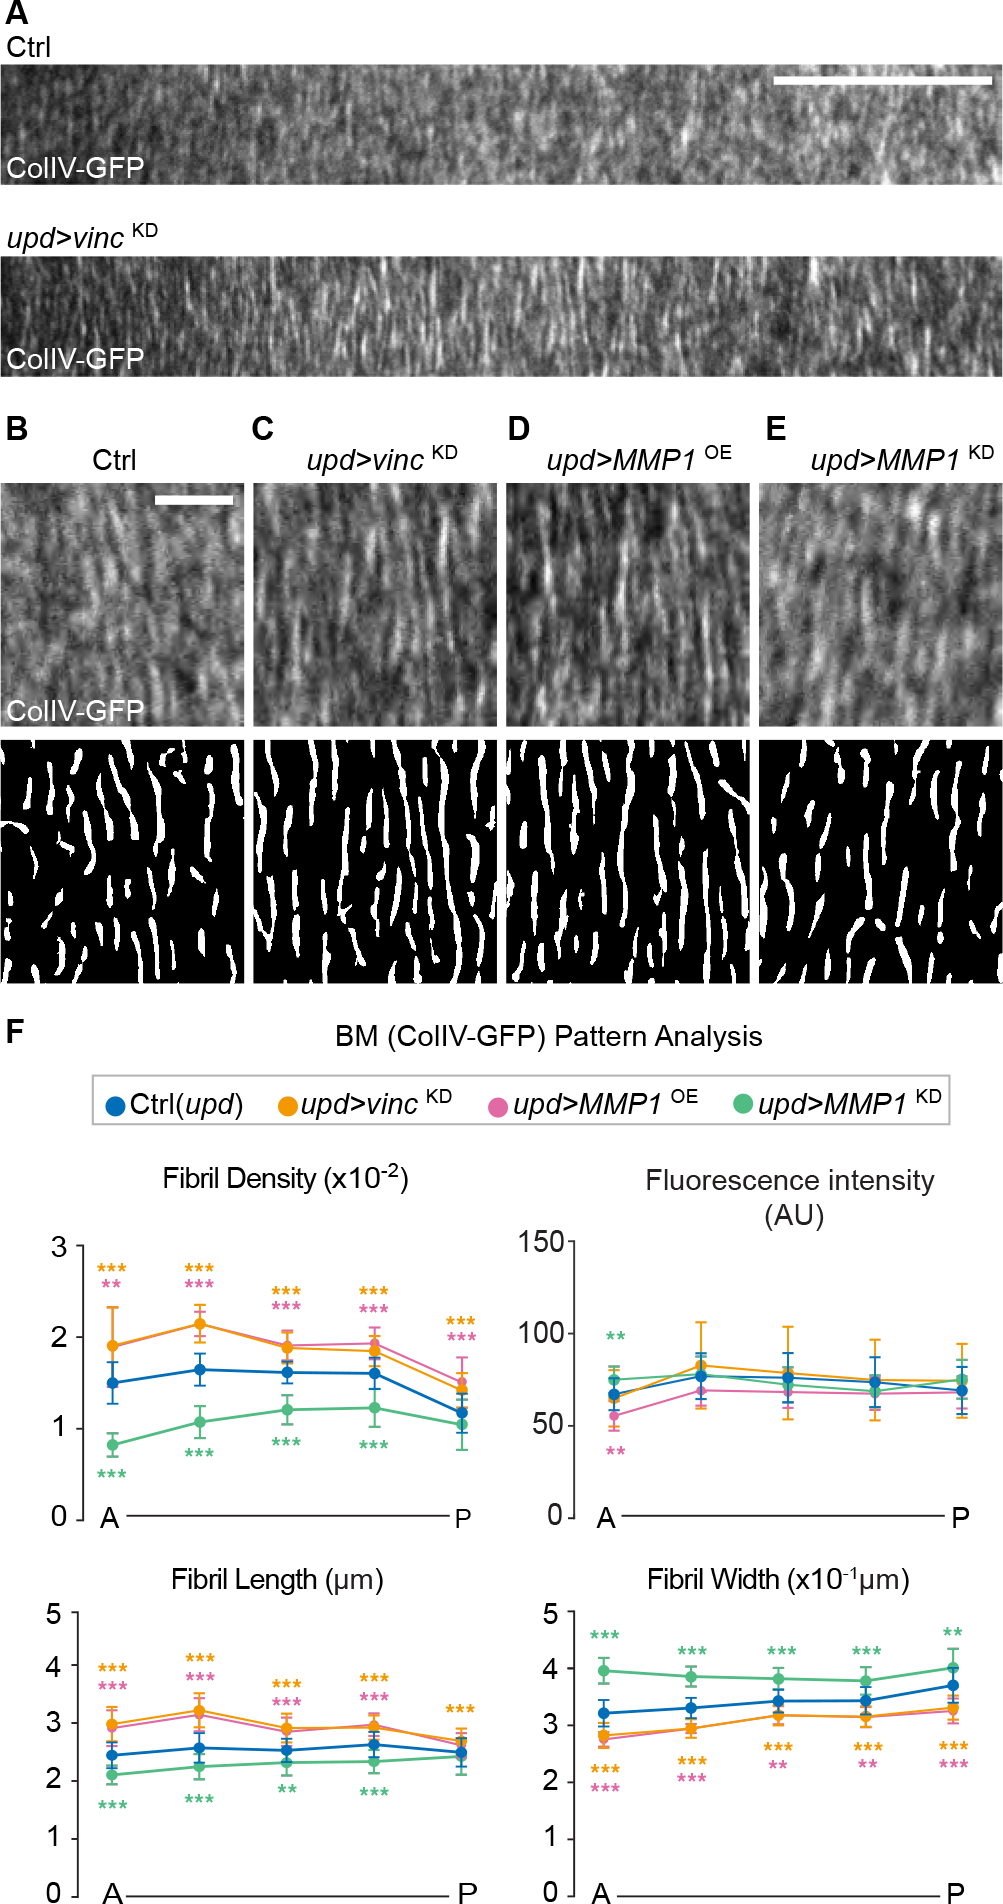
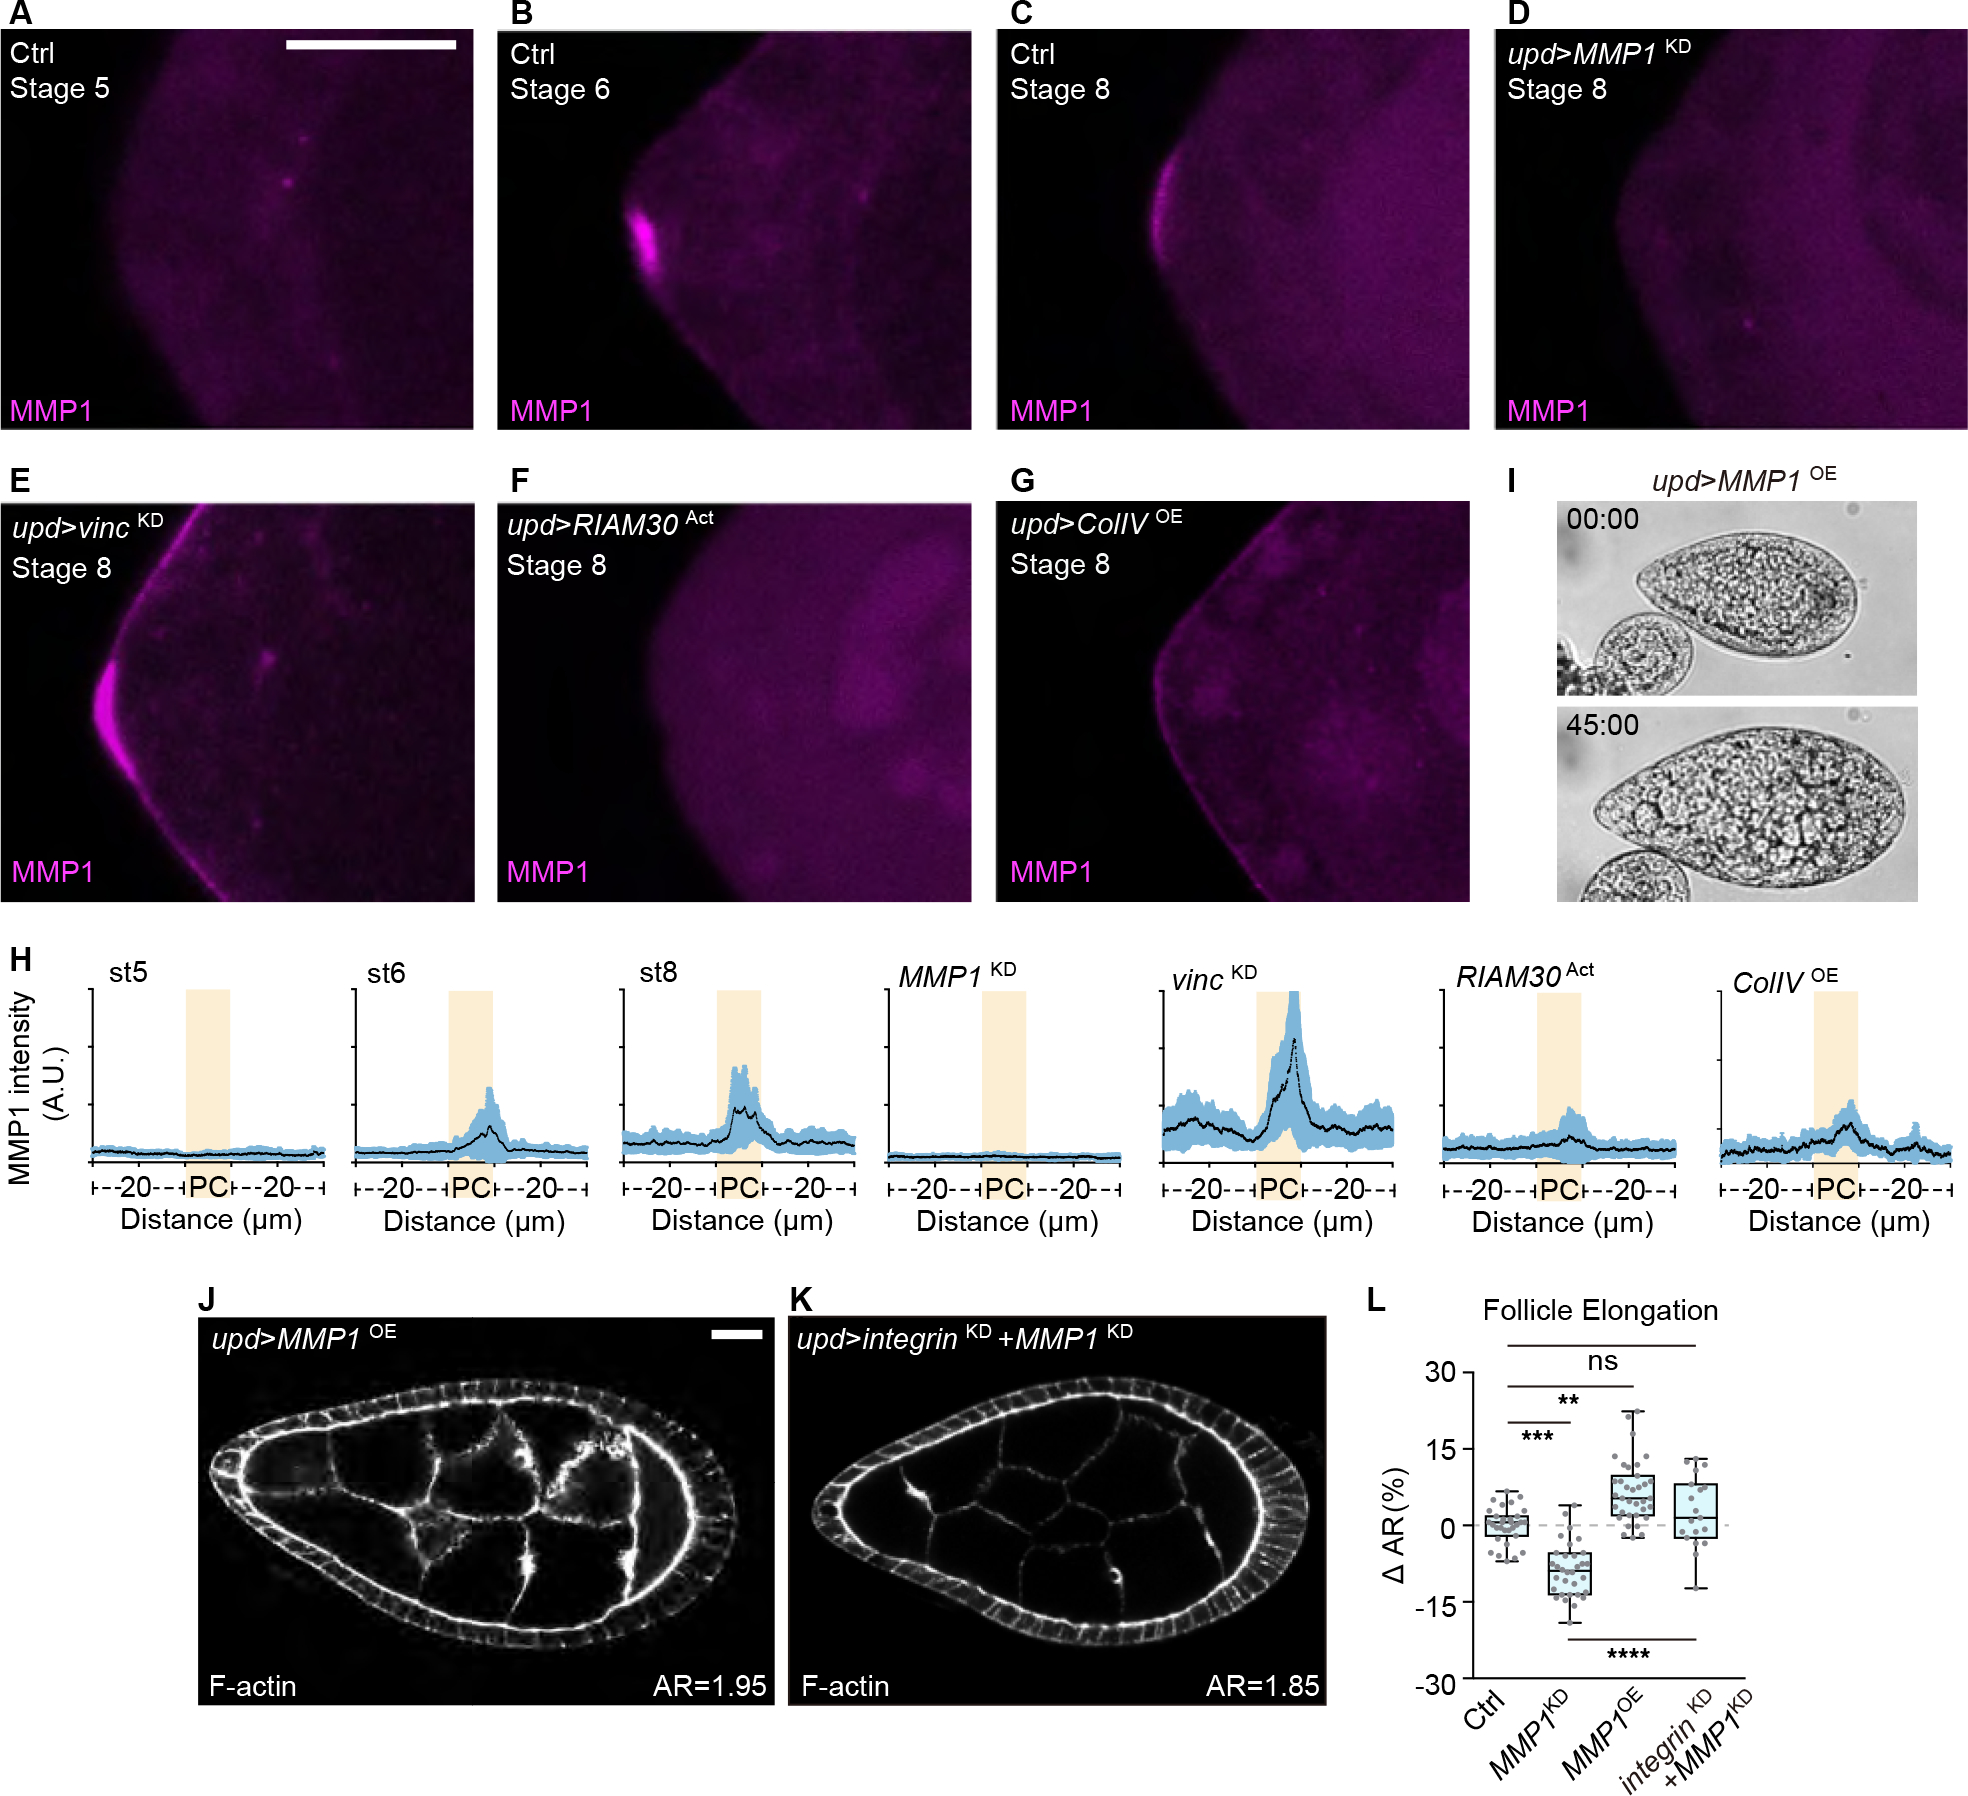
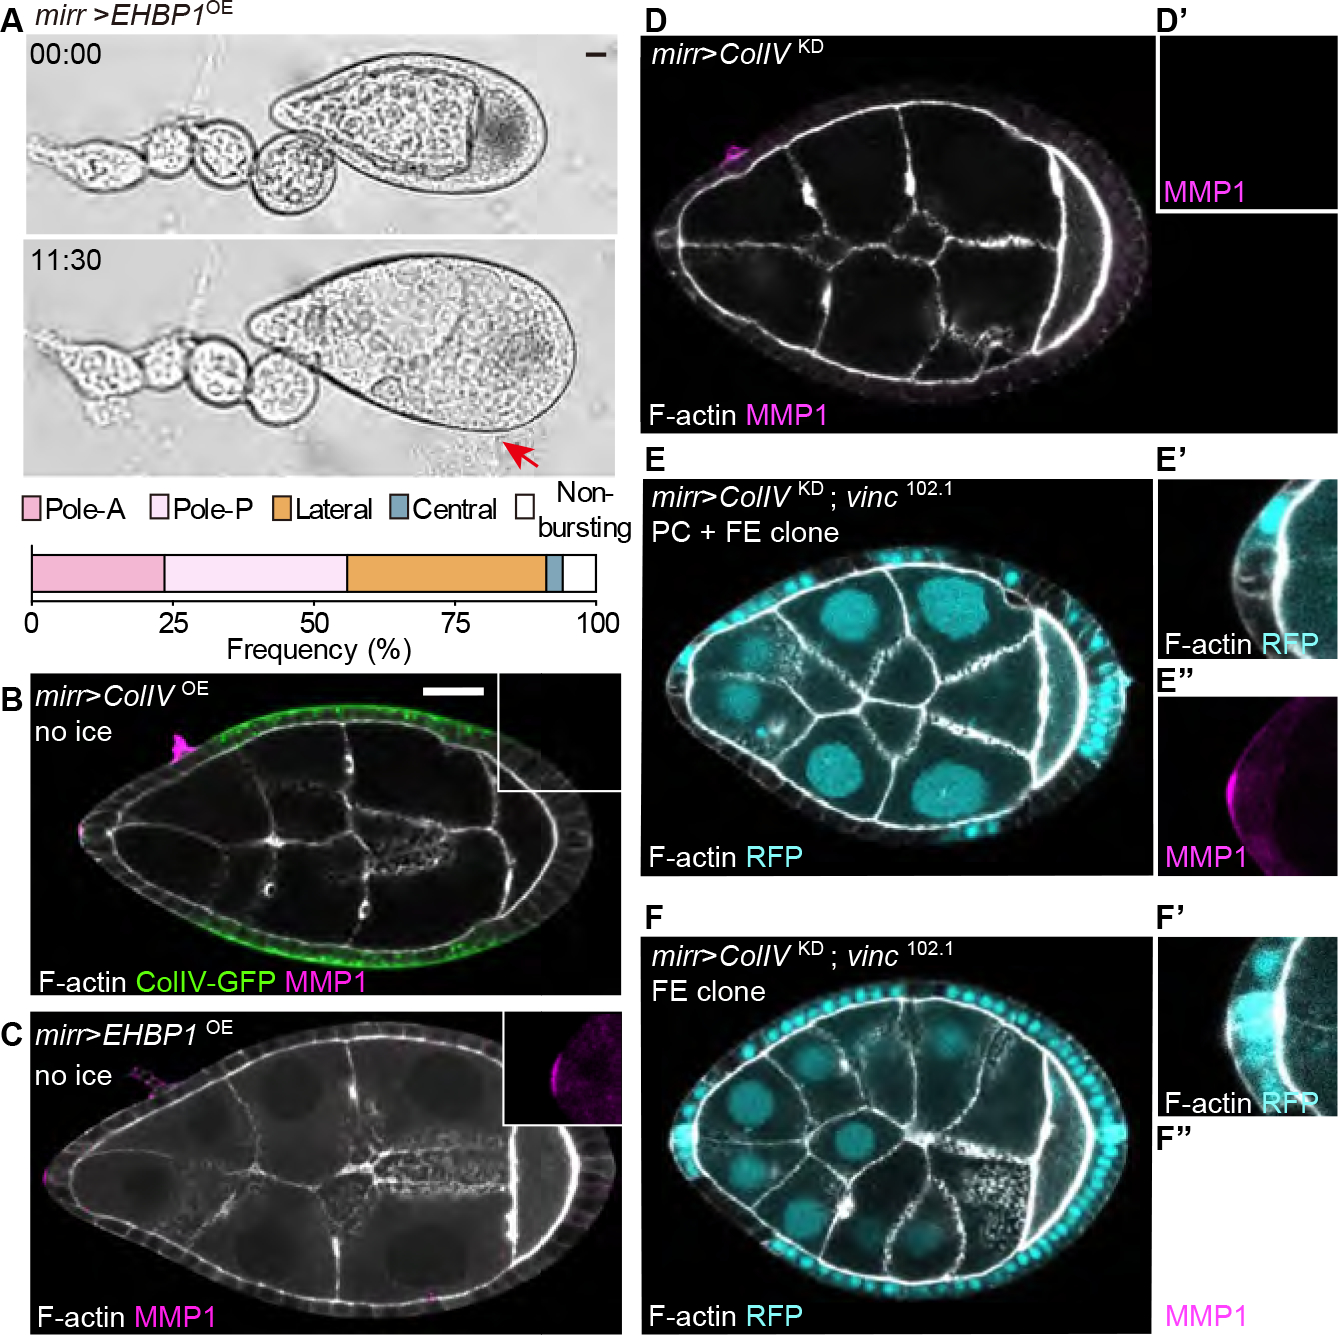
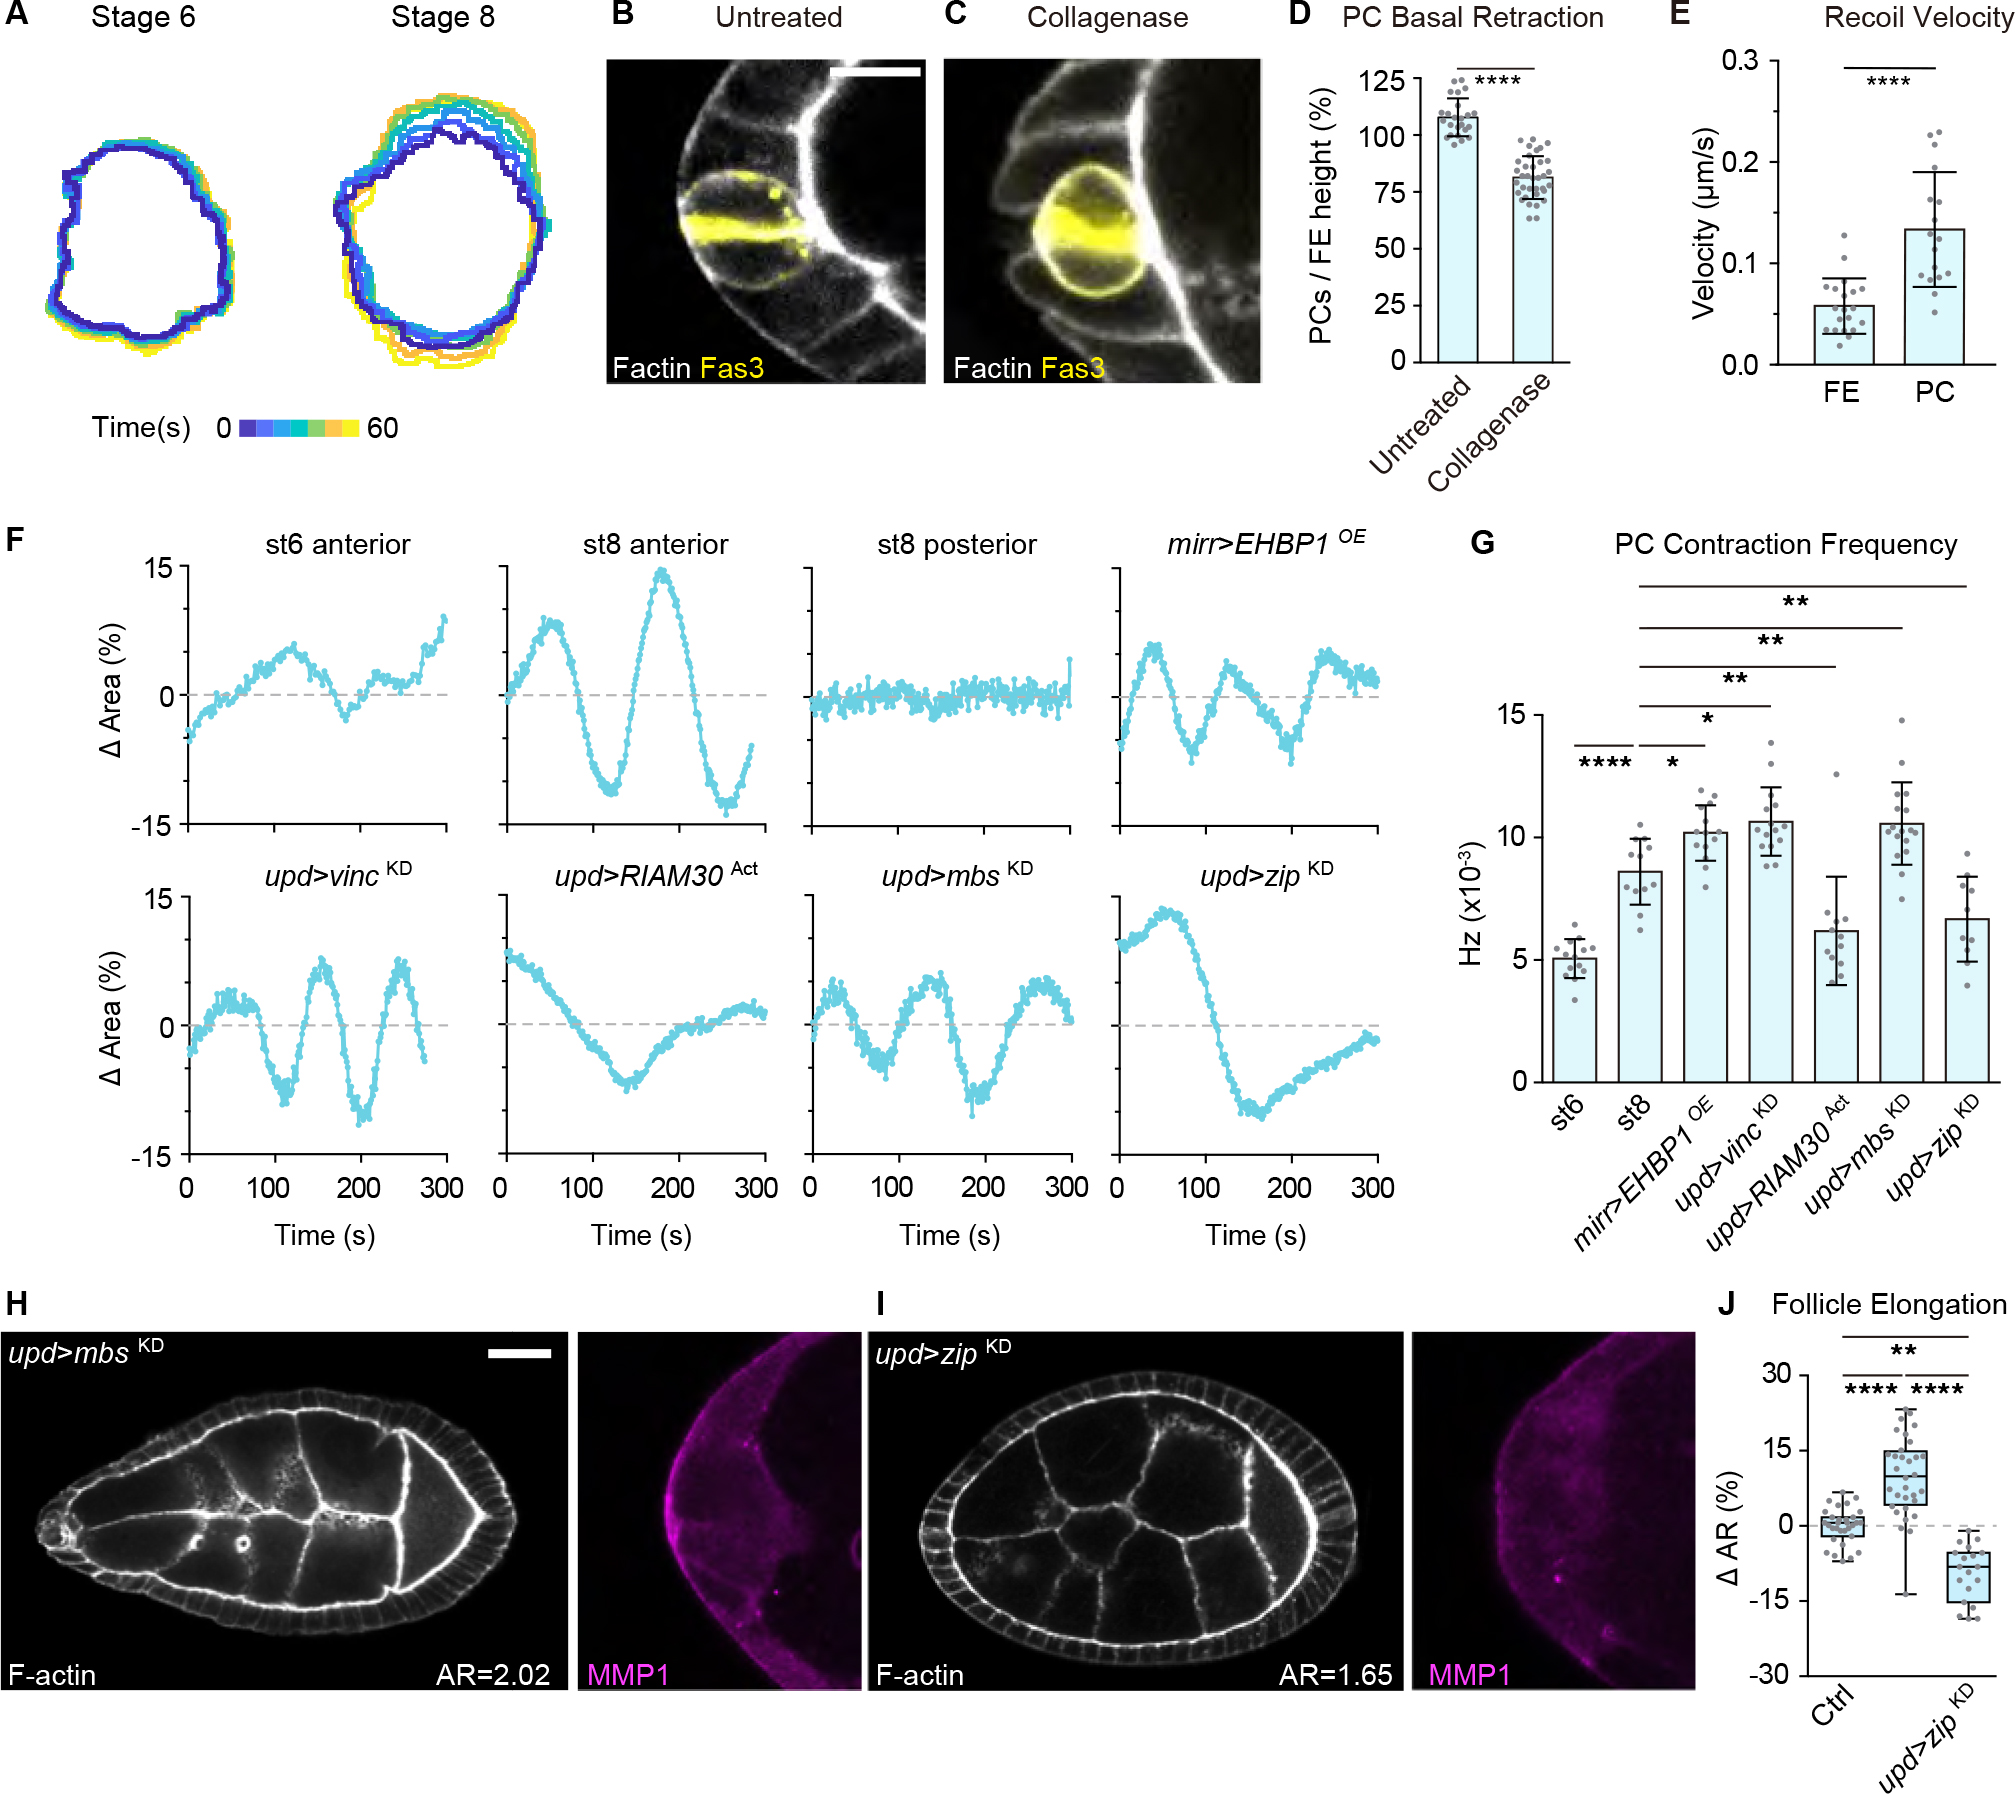
Shaping of developing organs requires dynamic regulation of force and resistance to achieve precise outcomes, but how organs monitor tissue mechanical properties is poorly understood. We show that in developing Drosophila follicles (egg chambers), a single pair of cells performs such monitoring to drive organ shaping. These anterior polar cells secrete a matrix metalloproteinase (MMP) that specifies the appropriate degree of tissue elongation, rather than hyper- or hypo-elongated organs. MMP production is negatively regulated by basement membrane (BM) mechanical properties, which are sensed through focal adhesion signaling and autonomous contractile activity; MMP then reciprocally regulates BM remodeling, particularly at the anterior region. Changing BM properties at remote locations alone is sufficient to induce a remodeling response in polar cells. We propose that this small group of cells senses both local and distant stiffness cues to produce factors that pattern the organ's BM mechanics, ensuring proper tissue shape and reproductive success.

Keywords: Drosophila; MMP; basement membrane; egg chamber; follicle; morphogenesis; tissue mechanics.


Conflict of interest statement

Declaration of interests The authors declare no competing interests.

Figures

Figure 1.
Figure 1.. Polar cells direct tissue elongation through BM-responsive focal adhesion signaling.
(A) Overview of follicle elongation, showing cell types involved, along with mechanical patterning of the ECM that drives morphogenesis. (B) Variation of aspect ratio (AR: AP/DV length) in wild-type eggs (w1118, n=108). Bar graph is mean ± standard deviation (0 ± 3.55%) subtracted to mean. (C) Location of PCs, as displayed by upd-GAL4-driven GFP (n=19). F-actin marks follicle morphology. Mean AR is indicated in bottom right from this panel onward. Scale bars hereafter are 20 μm unless otherwise indicated. (D-G) PC-specific knockdown (KD) of focal adhesion components Vinc (D, n=32) or Integrin (E, n=32) induces follicle hyperelongation, while overexpression (OE) of ColIV (F, n=25) or RIAM30Act (G, n=21) causes hypoelongation. (H) Overexpression of ColIV with simultaneous depletion of Vinc (n=35) shows that Vinc acts downstream of ColIV in follicle shaping. (I) Overexpression of RIAM30Act in PCs reverses the hyperelongation phenotype of Integrin depletion (n=32). (J) Quantitation of follicle elongation in Ctrl (C, upd driver, n=31) and D-I. Statistics are shown in box and whiskers (Min to Max) plot, with comparisons performed using ANOVA with Dunnett’s multiple comparisons. *P < 0.05, **P < 0.01, ***P < 0.001, ****P < 0.0001, and n.s., not significant (P > 0.05). (K) Oviposition rates for eggs with elongation phenotypes generated by PC manipulation. n for upd, upd>vinc KD, and upd>ColIV OE = 2056, 227, and 344 respectively.
Figure 2.
Figure 2.. Focal adhesion signaling in the PCs functions independent of Upd.
(A-B) Round follicles are induced by either depleting (A, n=14) or overexpressing (B, n=19) Upd from PCs. (C) PC-specific Upd overexpression combined with Vinc depletion generates follicles with elongation phenotypes intermediate between either single manipulation (n=33). (D) Quantitation of follicle elongation in A-C. Statistics used ANOVA with Dunnett’s multiple comparisons. (E) Quantitation of STAT activation along the A-P axis (shown as averaged heat map, see also Figure S2H–K) reveals no difference between control follicles and those with PC-specific manipulation of focal adhesion components.
Figure 3.
Figure 3.. Focal adhesion signaling in PCs tunes follicle mechanical properties.
(A) Illustration of hypotonic bursting assay to assess BM mechanical properties. Red (poles) and orange (lateral) arrows indicate the regions that preferentially burst due to softer BM in normal follicle. Blue arrows indicate the central part of the follicle that does not burst normally. (B-G) Bursting assays on control follicles (B), follicles with epithelium-wide BM manipulation (C, softer BM, tj>ColIVKD; D, stiffer BM, tj>EHBP1OE), and follicles with PC-specific manipulation (E, upd>vincKD; F, upd>RIAM30Act; G, upd>MMP1KD). Time in hypotonic solution is indicated in each frame as minutes:seconds. Images in right panels show time of follicle bursting (red arrows) or at the end of experiment for non-bursting follicles (45:00). See Video S1. (H) Quantitation of burst positions and frequency from B-G. n values are 38, 15, 30, 32, 30, 34,21, and 33 respectively. I-J) Quantitation of follicle expansion kinetics during osmotic swelling of control and hyperelongated genotypes. Data shown are mean ± standard deviation. Genotype-color codings are consistent in I,J, and L. (K) Diagram showing fiduciary photobleaching of ColIV-GFP squares in anterior, central and posterior positions of follicles, followed by transfer to ddH20 to induce osmotic swelling. (L) Quantitation of change of photobleached squares following swelling. Squares in control (n=14) follicles or hyperelongated EHBP1-overexpressing follicles (n=9) show no change in aspect ratio regardless of position along AP axis, whereas squares in the anterior of follicles with PC FA depletion (n=7) or MMP1 overexpression (n=12) show greater extension along the AP axis, making rectangles. Smaller but significant extension is seen with these genotypes in squares bleached in the central follicle, as well as in the posterior for PC FA depletion. Statistics used multiple-t-tests.
Figure 4.
Figure 4.. Control of BM patterning by PC focal adhesion signaling.
(A) ColIV-GFP patterns from the anterior regions of control (n=26) and hyperelongated follicles (upd > vincKD, n=37). (B-E) ColIV-GFP (upper) and fibril map (fibrils in white, see Methods) in control (B) and PC-specific manipulations (C, upd>vincKD; D, upd>MMP1OE, n=9; E, upd>MMP1KD, n=16). Scale bar= 5 μm. (F) Quantitation of ColIV-GFP fibril density, length and width along the A-P axis from B-E. Statistics used multiple-t-tests.
Figure 5.
Figure 5.. Focal adhesion-regulated MMP1 from PCs promotes tissue elongation.
(A-G) Images of anterior pole of developing follicles in ice preps. In control, MMP1 can be detected from stage 6 (A, stage 5, n=7; B, stage 6, n=15; C, stage 8, n=20). Staining of MMP1 is absent upon MMP1 depletion in the PCs (D, n=6). PC focal adhesion depletion leads to increased levels (E, n=13), while MMP1 in the PCs is reduced upon focal adhesion activation (F, n=9) or ColIV overexpression (G, n=16). Scale bars = 10 μm. (H) Quantitation of MMP1 signal intensity along the follicle anterior pole, centered around the PCs (highlighted in yellow) for a total of 50 μm. (I-J) Overexpressing MMP1 in PCs results in follicles that resist bursting upon osmotic shock (I, quantitation in Figure 3H–J, n=21) and is sufficient to drive hyperelongation (J). (K) Co-depletion of MMP1 attenuates follicle hyperelongation induced by Integrin depletion from PCs. (L) Quantitation of follicle elongation from Ctrl (upd driver, n=31), D (n=32), I (n=35), and J (n=19). Statistics used ANOVA with Dunnett’s multiple comparisons.
Figure 6.
Figure 6.. PCs sense and react to non-local BM changes through focal adhesion signaling.
(A) Bursting assay of BM fibril increase in the central follicle epithelium (mirr>EHBP1OE, n=34). Red arrow indicates burst position. (B-C) Overexpressing ColIV (B, green, n=20) or EHBP1 (C, n=25) in the central follicle causes anterior PCs to upregulate MMP1 (magnified in insets). Non-ice preps. (D) Depleting ColIV in the central follicle causes anterior PCs to downregulate MMP1 (n=6). Ice prep. (E-F) MMP1 expression when central follicle ColIV depletion is combined with blocking focal adhesion signaling (vinc mutant clones, not expressing RFP) in either PCs and epithelium (E, n=11), or in epithelium alone (F, n= 15). Ice preps.
Figure 7.
Figure 7.. PCs tug on the BM for mechanical sensing.
(A) Dynamic contractility of anterior PCs in live follicles. Outlines of Fas3-GFP signals are overlayed and color-coded according to time (stage 6, n=14; stage 8, n=12, Video S4). (B-C) PCs (labeled by Fas3 staining, yellow) in untreated (B, n=24) or collagenase-treated (C, n=35) follicles. Scale bars: 10 μm. (D) Quantitation of PC basal retraction, normalized to the immediate neighboring follicle epithelium. Statistics used unpaired Mann-Whitney test. (E) Recoil velocity of lateral plasma membranes following cortical severing with a 2-photon laser. Recoil is higher in PCs (n=17) then follicle epithelial cells (n=20). Statistics used unpaired Mann-Whitney test. (F) Single PC contractility dynamics over time. PCs in control (anterior: stage 6, n=14; stage 8 n=12; posterior: stage 8 n=12) and manipulated (central stiffening: mirr>EHBP1OE, n=14; PC mutants: upd>vincKD, n=15; upd>RIAM30Act, n=12; upd>mbsKD, n=17; upd>zipKD, n=10, see Video S5) stage 8 follicles. (G) Quantitation of PC contraction frequency in control and manipulated follicles. Statistics used KS (Kolmogorov-Smirnov) test. (H-I) Increasing PC contractility (H, upd>mbsKD, n=31) leads to follicle hyperelongation and MMP1 upregulation, while decreasing PC contractilty (I, upd>zipKD, n=23) has the opposite effect. (J) Quantitation of aspect ratios in H, I. Statistics used ANOVA with Dunnett’s multiple comparisons.

Similar articles

Cited by

References

    1. Dubuis JO, Samanta R, and Gregor T (2013). Accurate measurements of dynamics and reproducibility in small genetic networks. Molecular Systems Biology 9, 639. 10.1038/msb.2012.72. - DOI - PMC - PubMed
    1. Exelby K, Herrera-Delgado E, Perez LG, Perez-Carrasco R, Sagner A, Metzis V, Sollich P, and Briscoe J (2021). Precision of tissue patterning is controlled by dynamical properties of gene regulatory networks. Development 148. 10.1242/dev.197566. - DOI - PMC - PubMed
    1. Petkova MD, Tkačik G, Bialek W, Wieschaus EF, and Gregor T (2019). Optimal Decoding of Cellular Identities in a Genetic Network. Cell 176, 844–855.e815. 10.1016/j.cell.2019.01.007. - DOI - PMC - PubMed
    1. Humphrey JD, and Schwartz MA (2021). Vascular Mechanobiology: Homeostasis, Adaptation, and Disease. Annu Rev Biomed Eng 23, 1–27 10.1146/annurev-bioeng-092419-. - DOI - PMC - PubMed
    1. Sekiguchi R, and Yamada KM (2018). Basement Membranes in Development and Disease. Curr Top Dev Biol 130, 143–191. 10.1016/bs.ctdb.2018.02.005. - DOI - PMC - PubMed

Publication types

Substances