

Risk modeling of single-cell transcriptomes reveals the heterogeneity of immune infiltration in hepatocellular carcinoma
- PMID: 36708920
- PMCID: PMC10011506
- DOI: 10.1016/j.jbc.2023.102948
Risk modeling of single-cell transcriptomes reveals the heterogeneity of immune infiltration in hepatocellular carcinoma
Abstract
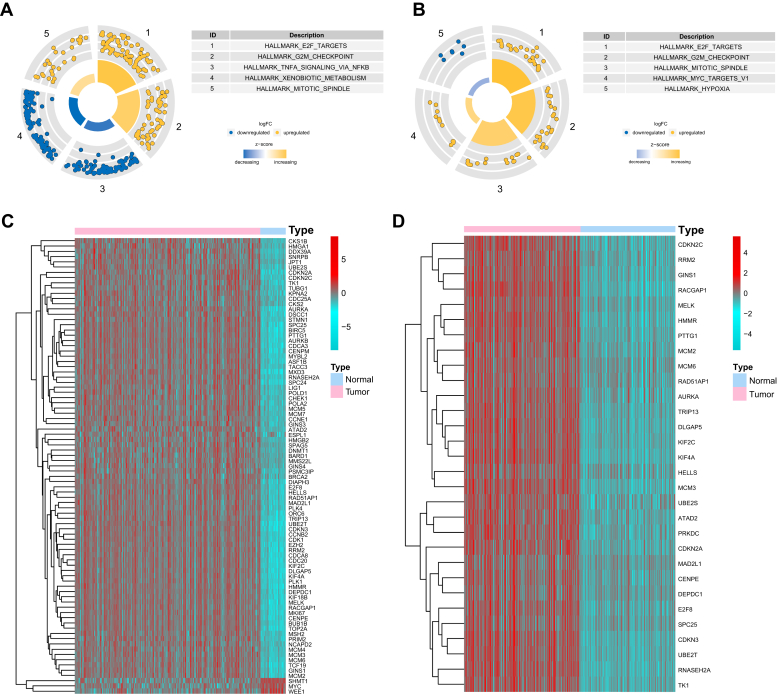
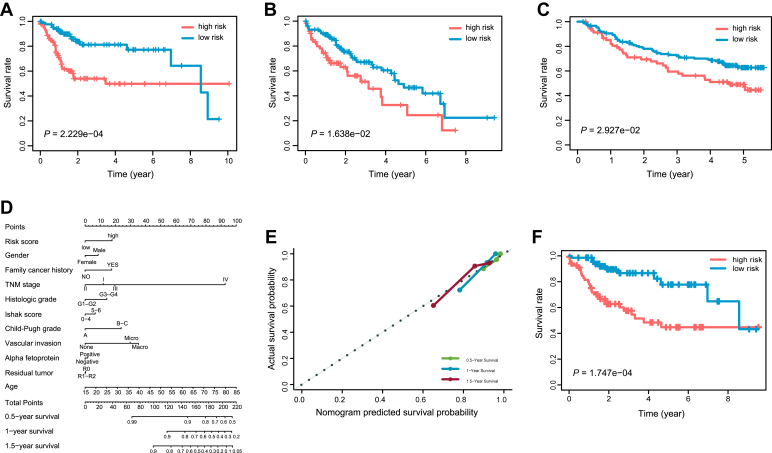
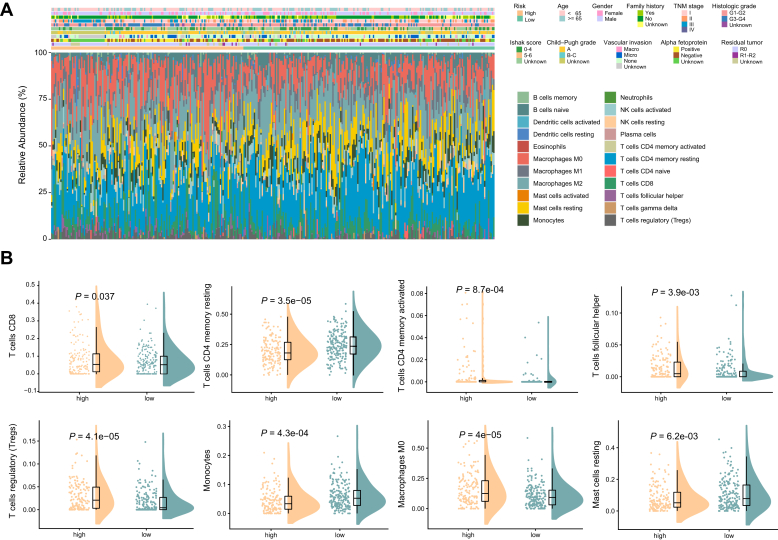
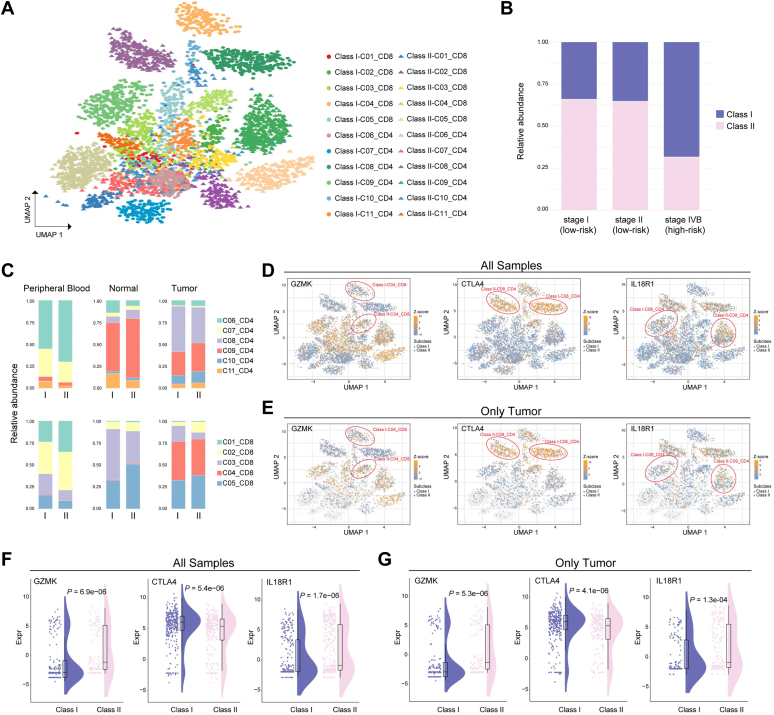
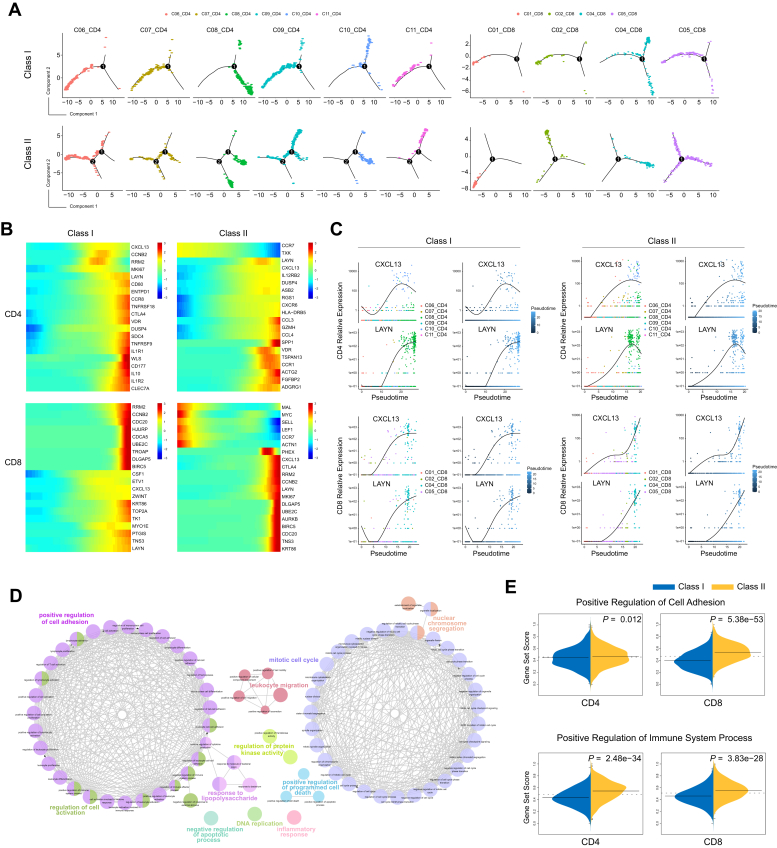
Hepatocellular carcinoma (HCC) is one of the most common primary hepatic malignancies. E2F transcription factors play an important role in the tumorigenesis and progression of HCC, mainly through the RB/E2F pathway. Prognostic models for HCC based on gene signatures have been developed rapidly in recent years; however, their discriminating ability at the single-cell level remains elusive, which could reflect the underlying mechanisms driving the sample bifurcation. In this study, we constructed and validated a predictive model based on E2F expression, successfully stratifying patients with HCC into two groups with different survival risks. Then we used a single-cell dataset to test the discriminating ability of the predictive model on infiltrating T cells, demonstrating remarkable cellular heterogeneity as well as altered cell fates. We identified distinct cell subpopulations with diverse molecular characteristics. We also found that the distribution of cell subpopulations varied considerably across onset stages among patients, providing a fundamental basis for patient-oriented precision evaluation. Moreover, single-sample gene set enrichment analysis revealed that subsets of CD8+ T cells with significantly different cell adhesion levels could be associated with different patterns of tumor cell dissemination. Therefore, our findings linked the conventional prognostic gene signature to the immune microenvironment and cellular heterogeneity at the single-cell level, thus providing deeper insights into the understanding of HCC tumorigenesis.
Keywords: cellular heterogeneity; hepatocellular carcinoma; immune microenvironment; overall survival; prognosis.
Copyright © 2023 The Authors. Published by Elsevier Inc. All rights reserved.
Conflict of interest statement
Conflict of interest The authors declare that they have no conflicts of interest with the contents of this article.
Figures
Similar articles
-
Heterogeneous immunogenomic features and distinct escape mechanisms in multifocal hepatocellular carcinoma.J Hepatol. 2020 May;72(5):896-908. doi: 10.1016/j.jhep.2019.12.014. Epub 2019 Dec 27. J Hepatol. 2020. PMID: 31887370
-
Comprehensive analysis of N6-methyladenosine -related long non-coding RNAs and immune cell infiltration in hepatocellular carcinoma.Bioengineered. 2021 Dec;12(1):1708-1724. doi: 10.1080/21655979.2021.1923381. Bioengineered. 2021. PMID: 33955330 Free PMC article.
-
Comprehensive Pan-Cancer Genomic Analysis Reveals PHF19 as a Carcinogenic Indicator Related to Immune Infiltration and Prognosis of Hepatocellular Carcinoma.Front Immunol. 2022 Jan 5;12:781087. doi: 10.3389/fimmu.2021.781087. eCollection 2021. Front Immunol. 2022. PMID: 35069553 Free PMC article. Clinical Trial.
-
Liver-infiltrating CD8(+) lymphocytes as prognostic factor for tumour recurrence in hepatitis C virus-related hepatocellular carcinoma.Liver Int. 2016 Mar;36(3):434-44. doi: 10.1111/liv.12927. Epub 2015 Sep 29. Liver Int. 2016. PMID: 26215124
-
The Endless Sources of Hepatocellular Carcinoma Heterogeneity.Cancers (Basel). 2021 May 26;13(11):2621. doi: 10.3390/cancers13112621. Cancers (Basel). 2021. PMID: 34073538 Free PMC article. Review.
Cited by
-
Prognostic iron-metabolism signature robustly stratifies single-cell characteristics of hepatocellular carcinoma.Comput Struct Biotechnol J. 2024 Feb 1;23:929-941. doi: 10.1016/j.csbj.2024.01.022. eCollection 2024 Dec. Comput Struct Biotechnol J. 2024. PMID: 38375529 Free PMC article.
-
Three E2F target-related genes signature for predicting prognosis, immune features, and drug sensitivity in hepatocellular carcinoma.Front Mol Biosci. 2023 Oct 3;10:1266515. doi: 10.3389/fmolb.2023.1266515. eCollection 2023. Front Mol Biosci. 2023. PMID: 37854038 Free PMC article.
References
-
- European Association for the Study of the Liver. Electronic address: easloffice@easloffice.eu. European Association for the Study of the Liver EASL clinical practice guidelines: management of hepatocellular carcinoma. J. Hepatol. 2018;69:182–236. - PubMed
-
- Ganne-Carrie N., Nahon P. Hepatocellular carcinoma in the setting of alcohol-related liver disease. J. Hepatol. 2019;70:284–293. - PubMed
-
- Finn R.S., Ryoo B.Y., Merle P., Kudo M., Bouattour M., Lim H.Y., et al. Pembrolizumab as second-line therapy in patients with advanced hepatocellular carcinoma in KEYNOTE-240: a randomized, double-blind, phase III trial. J. Clin. Oncol. 2020;38:193–202. - PubMed
-
- Sangro B., Gomez-Martin C., de la Mata M., Inarrairaegui M., Garralda E., Barrera P., et al. A clinical trial of CTLA-4 blockade with tremelimumab in patients with hepatocellular carcinoma and chronic hepatitis C. J. Hepatol. 2013;59:81–88. - PubMed
-
- Zheng C., Zheng L., Yoo J.K., Guo H., Zhang Y., Guo X., et al. Landscape of infiltrating T cells in liver cancer revealed by single-cell sequencing. Cell. 2017;169:1342–1356.e16. - PubMed
Publication types
MeSH terms
LinkOut - more resources
Full Text Sources
Medical
Research Materials
