

Prosteria - National Trends and Outcomes of More Frequent Than Guideline Recommended Prostate Specific Antigen Screening
- PMID: 36708931
- PMCID: PMC11315235
- DOI: 10.1016/j.urology.2023.01.011
Prosteria - National Trends and Outcomes of More Frequent Than Guideline Recommended Prostate Specific Antigen Screening
Abstract
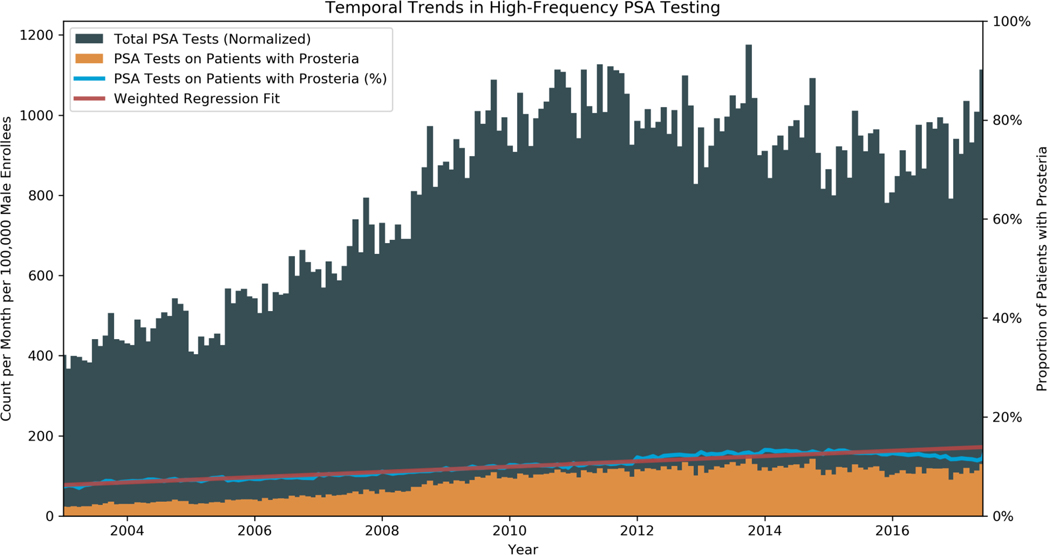
Objective: To characterize national trends in and associated outcomes of more often than annual prostate-specific antigen (PSA) screening, which we term "prosteria."
Methods: Men in the Optum Clinformatics Data Mart with ≥2 years from first PSA test to censoring at the end of insurance or available data (January 2003 to June 2019) or following exclusionary diagnoses or procedures, such as PCa treatment, were included. PSAs within 90 days were treated as one PSA. Prosteria was defined as having ≥3 PSA testing intervals of ≤270 days.
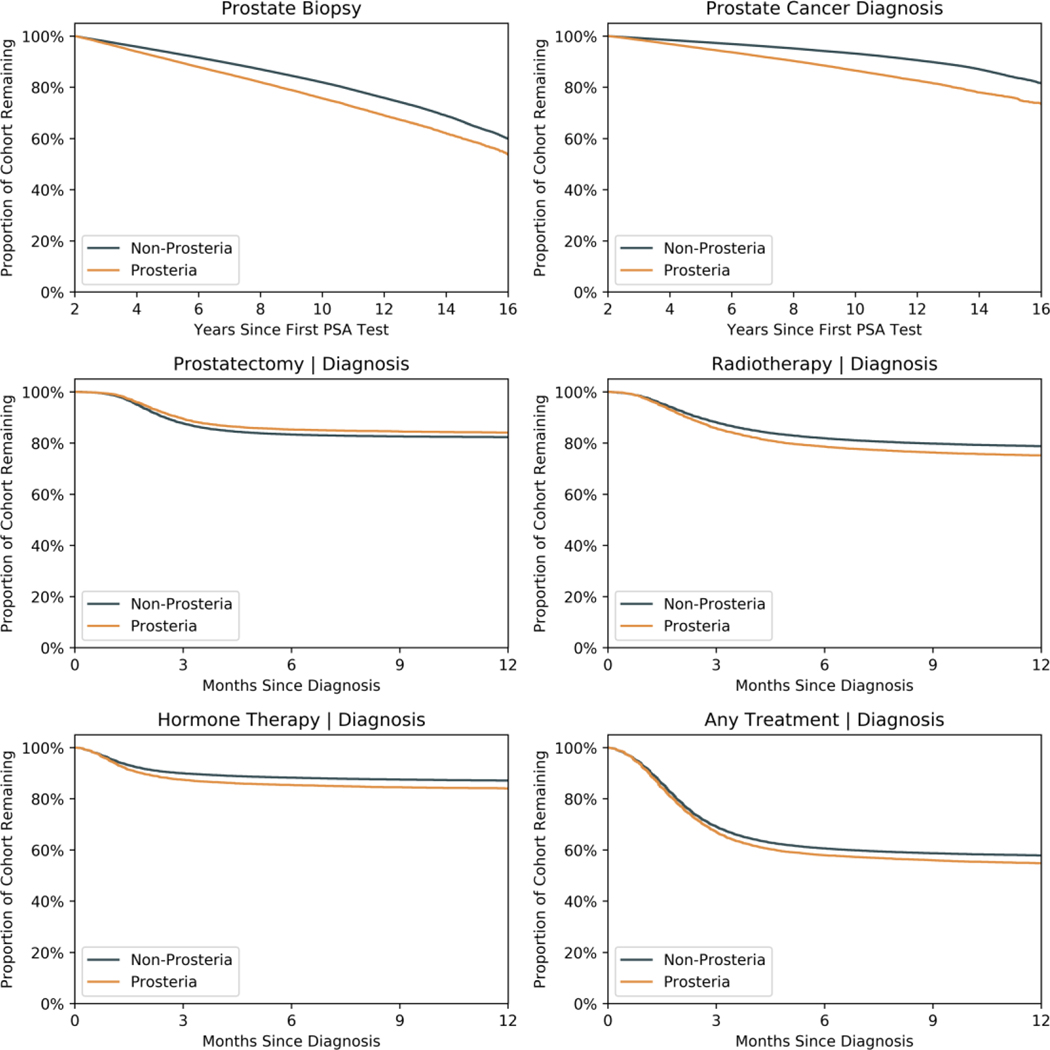
Results: A total of 9,734,077 PSAs on 2,958,923 men were included. The average inter-PSA testing interval was 1.5 years, and 4.5% of men had prosteria, which increased by 0.53% per year. Educated, wealthy, non-White patients were more likely to have prosteria. Men within the recommended screening age (ie 55-69) had lower rates of prosteria. Prosteria patients had higher average PSA values (2.5 vs 1.4 ng/mL), but lower values at PCa diagnosis. Prosteria was associated with biopsy and PCa diagnosis; however, there were comparable rates of treatment within 2 years of diagnosis.
Conclusion: In this large cohort study, prosteria was common, increased over time, and was associated with demographic characteristics. Importantly, there were no clinically meaningful differences in PSA values at diagnosis or rates of early treatment, suggesting prosteria leads to both overdiagnosis and overtreatment. These results support current AUA and USPTF guidelines and can be used to counsel men seeking more frequent PSA screening.
Copyright © 2023 Elsevier Inc. All rights reserved.
Figures
Similar articles
-
Prostate cancer screening practices in a large, integrated health system: 2007-2014.BJU Int. 2017 Aug;120(2):257-264. doi: 10.1111/bju.13793. Epub 2017 Feb 26. BJU Int. 2017. PMID: 28139034 Free PMC article.
-
Structured Population-based Prostate-specific Antigen Screening for Prostate Cancer: The European Association of Urology Position in 2019.Eur Urol. 2019 Aug;76(2):142-150. doi: 10.1016/j.eururo.2019.04.033. Epub 2019 May 12. Eur Urol. 2019. PMID: 31092338
-
Use of low free to total PSA ratio in prostate cancer screening: detection rates, clinical and pathological findings in Brazilian men with serum PSA levels <4.0 ng/mL.BJU Int. 2012 Dec;110(11 Pt B):E653-7. doi: 10.1111/j.1464-410X.2012.11398.x. Epub 2012 Aug 14. BJU Int. 2012. PMID: 22892057
-
Prostate cancer screening with prostate-specific antigen (PSA) test: a systematic review and meta-analysis.BMJ. 2018 Sep 5;362:k3519. doi: 10.1136/bmj.k3519. BMJ. 2018. PMID: 30185521 Free PMC article.
-
[PROSTATE CANCER EARLY DETECTION USING PSA - CURRENT TRENDS AND RECENT UPDATES].Harefuah. 2017 Mar;156(3):185-188. Harefuah. 2017. PMID: 28551942 Review. Hebrew.
Cited by
-
Factors associated with patients' demand for low-value care: a scoping review.BMC Health Serv Res. 2024 Dec 28;24(1):1656. doi: 10.1186/s12913-024-12093-7. BMC Health Serv Res. 2024. PMID: 39731121 Free PMC article.
References
-
- Charatan FB FDA approves test for prostatic cancer. BMJ 309, 628–629 (1994).
-
- Welch HG & Albertsen PC Reconsidering Prostate Cancer Mortality — The Future of PSA Screening. N Engl J Med 382, 1557–1563 (2020). - PubMed
-
- Catalona WJ et al. Measurement of prostate-specific antigen in serum as a screening test for prostate cancer. N Engl J Med 324, 1156–1161 (1991). - PubMed
-
- Shoag JE, Mittal S. & Hu JC Reevaluating PSA Testing Rates in the PLCO Trial. N Engl J Med 374, 1795–1796 (2016). - PubMed
Publication types
MeSH terms
Substances
Grants and funding
LinkOut - more resources
Full Text Sources
Medical
Research Materials
Miscellaneous
