. 2023 Jan 28;14(1):473.
doi: 10.1038/s41467-023-36068-0.

The classical pathway triggers pathogenic complement activation in membranous nephropathy

Affiliations

The classical pathway triggers pathogenic complement activation in membranous nephropathy

Larissa Seifert et al. Nat Commun. .

Abstract

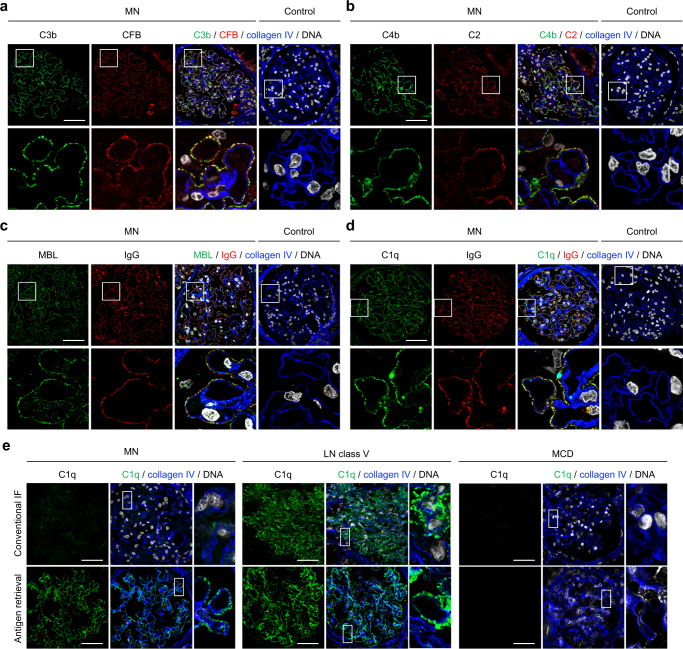
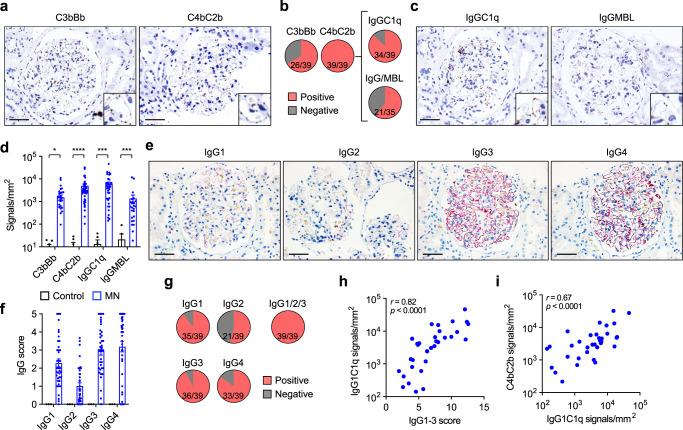
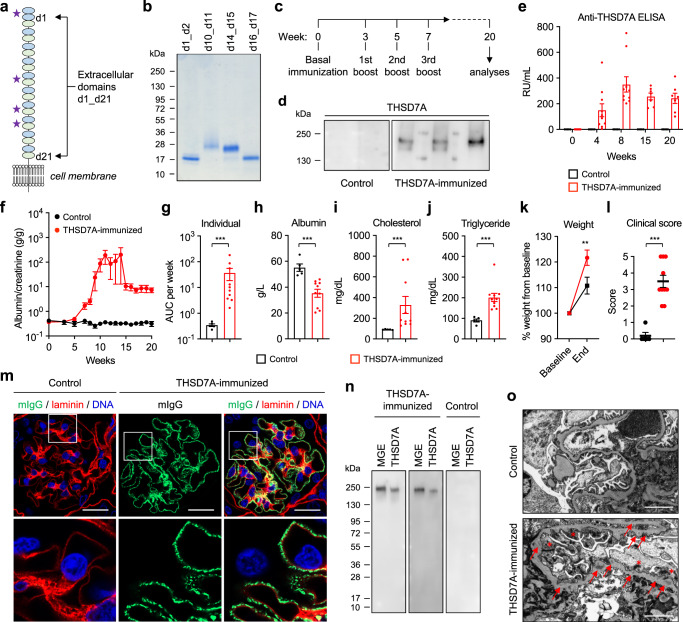
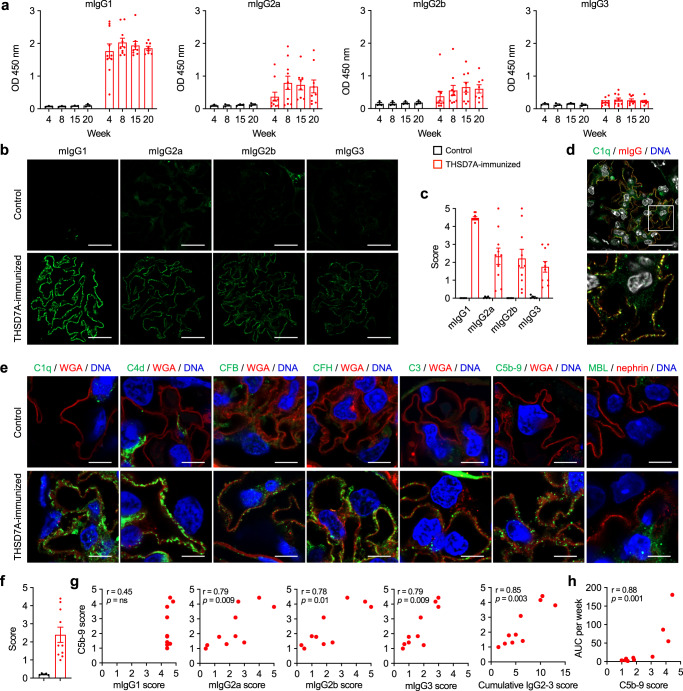
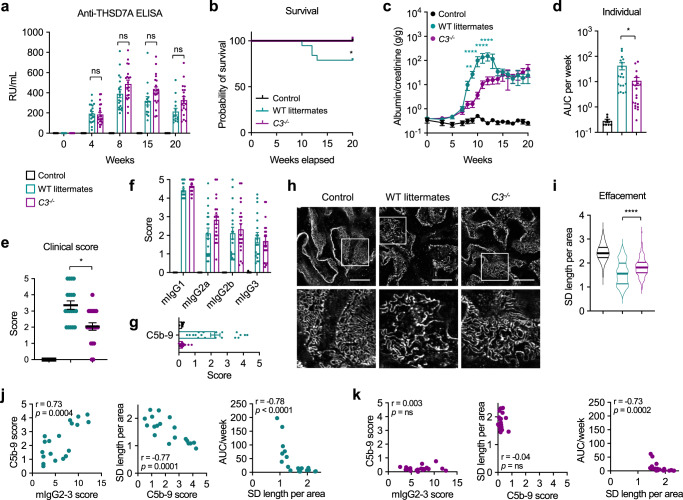
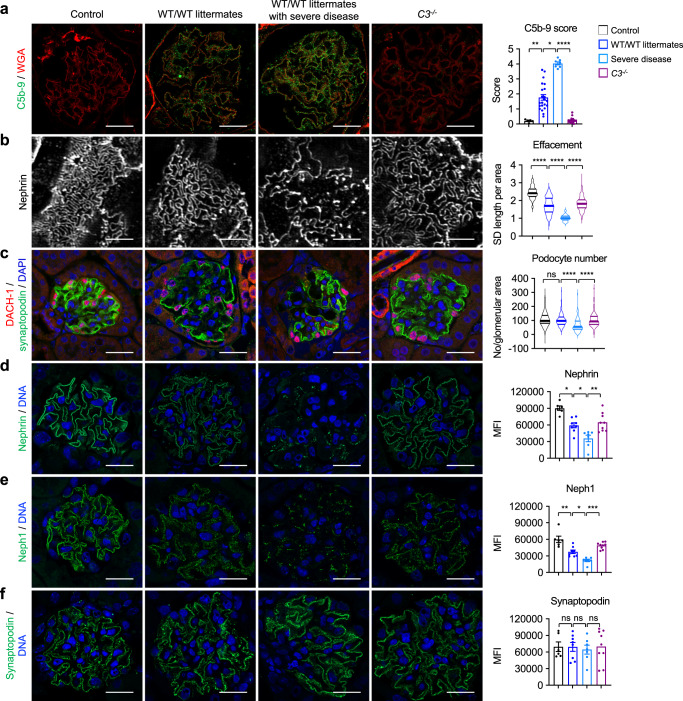
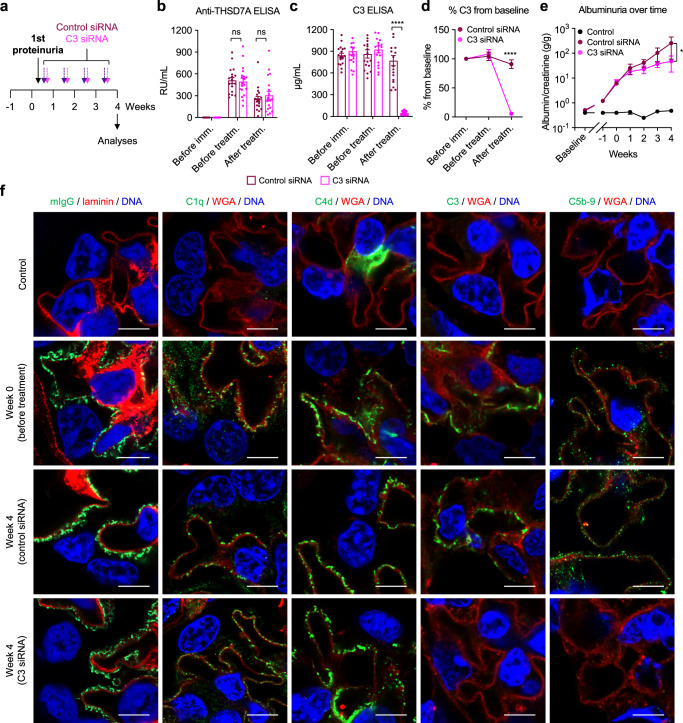
Membranous nephropathy (MN) is an antibody-mediated autoimmune disease characterized by glomerular immune complexes containing complement components. However, both the initiation pathways and the pathogenic significance of complement activation in MN are poorly understood. Here, we show that components from all three complement pathways (alternative, classical and lectin) are found in renal biopsies from patients with MN. Proximity ligation assays to directly visualize complement assembly in the tissue reveal dominant activation via the classical pathway, with a close correlation to the degree of glomerular C1q-binding IgG subclasses. In an antigen-specific autoimmune mouse model of MN, glomerular damage and proteinuria are reduced in complement-deficient mice compared with wild-type littermates. Severe disease with progressive ascites, accompanied by extensive loss of the integral podocyte slit diaphragm proteins, nephrin and neph1, only occur in wild-type animals. Finally, targeted silencing of C3 using RNA interference after the onset of proteinuria significantly attenuates disease. Our study shows that, in MN, complement is primarily activated via the classical pathway and targeting complement components such as C3 may represent a promising therapeutic strategy.


Conflict of interest statement

A.B. is an employee and shareholder of Alnylam Pharmaceuticals. P.F.Z. serves as a consultant for Eleva GMBH, Novartis, Generic Assays, Alexion, Bayer, Vifor Fresenius Medical Care Renal Pharma, and Samsung Bioepis. All other authors declare no competing interests. P.F., S.W., and T.W. applied for a patent “C3/C5 convertase assays” (EP 3771468/US-2022-0276261).

Figures

Fig. 1
Fig. 1. Complement components from all three complement activation pathways can be detected in biopsies from MN patients.
ad Representative immunofluorescence (IF) stainings (paraffin-embedded tissue) for C3b and CFB (a), C4b and C2 (b), MBL and IgG (c), and C1q and IgG (d) in co-localization with the glomerular basement membrane constituent collagen IV in biopsies from MN patients (n = 5) and controls (n = 4). The lower panels represent 5-fold enlargements of the boxed areas in the upper panels. Bars 50 µm. e Representative IF stainings (frozen tissue) for C1q in co-localization with collagen IV in biopsies from patients with MN (n = 6), patients with lupus nephritis (LN) class V (n = 2), and patients with minimal change disease (MCD, n = 2) using conventional indirect IF (upper panels) and IF after antigen retrieval with methanol and trypsin (lower panels). Panels on the right represent 5-fold enlargements of the boxed areas in the left panels. Bars 50 µm.
Fig. 2
Fig. 2. Complement is dominantly activated via the classical pathway in patients with MN.
a Representative images of proximity ligation assays showing the alternative convertase C3bBb (left) and the classical/lectin convertase C4bC2b (right) performed on biopsies from patients with MN (n = 39). Bars 50 µm. b Detection of C3bBb, C4bC2b and IgGC1q using proximity ligation assays as well as of MBL/IgG in immunofluorescence and proximity ligation assay. c Representative images of proximity ligation assays showing the assembly of IgGC1q (left) and IgGMBL (right) performed on biopsies from patients with MN (n = 39 and n = 26 for IgGC1q and IgGMBL, respectively). Bars 50 µm. d Quantitative analysis of proximity ligation assay signals in biopsies from patients with MN and time point zero biopsies from renal transplant recipients. Data are presented as mean and SEM. C3bBb, *p = 0.0442; C4bC2b, ****p < 0.0001; IgGC1q, ***p = 0.0005; IgGMBL, ***p = 0.0003 (two-tailed Mann–Whitney test). e Representative immunohistochemical stainings for the IgG subclasses IgG1, IgG2, IgG3, and IgG4 in a biopsy sample from a patient with MN (n = 39). Bars 50 µm. f Quantitative analysis (histological score) of IgG subclass signals in 39 biopsies from patients with MN and 3 time point zero biopsies from renal transplant recipients. Data are presented as mean and SEM. g Detection of IgG1, IgG2, IgG3, and IgG4 as well as at least one of the C1q-binding subclasses IgG1, IgG2, or IgG3 in biopsies from patients with MN. h, i Correlation of the cumulative IgG1-3 score with IgGC1q proximity ligation assay signals (h) and IgGC1q signals with the C4bC2b signals (i). Spearman’s r correlation coefficient (two-tailed).
Fig. 3
Fig. 3. Active immunization with THSD7A fragments induces membranous nephropathy in mice.
a Molecular architecture of THSD7A with 21 extracellular domains. Asterisks mark the four regions that were used for active immunization. b Coomassie-blue staining of the four THSD7A fragments that were used for immunization (representative gel from at least 10 experiments). c Immunization scheme. Mice were immunized with PBS (further referred to as control, n = 5) or THSD7A fragments (further referred to as THSD7A-immunized, n = 10), both in combination with Freund’s adjuvant, in two independent experiments. d Western blot analyses of mouse sera (from 2 controls and 4 THSD7A-immunized animals) taken 4 weeks after immunization on recombinant THSD7A. e, f Anti-THSD7A antibody titers as measured by ELISA (e) and albuminuria as measured by albumin-to-creatinine ratio (f) over time. g Individual albuminuria as measured by the area under the curve (AUC) per week. ***p = 0.0007 (two-tailed Mann–Whitney test). hj Serum values for albumin (h, ***p = 0.0007), cholesterol (i, ***p = 0.0007) and triglyceride (j, ***p = 0.0007) (two-tailed Mann–Whitney test). k Weight change in percent. **p = 0.0079 (two-way ANOVA with Bonferroni correction for multiple comparisons). l Nephrotic syndrome clinical score. ***p = 0.0003 (two-tailed Mann–Whitney test). In panels el, data are presented as mean and SEM and derived from n = 5 controls and n = 10 THSD7A-immunized animals. m Representative immunofluorescence staining for mouse IgG (mIgG) in co-localization with laminin in control (n = 5) and THSD7A-immunized (n = 10) mice. Bars 20 µm. Lower panels represent 3.5-fold enlargements of the boxed areas in the upper panels. n Western blot analysis of antibodies eluted from frozen kidney sections of experimental mice on mouse glomerular extracts (MGE) and recombinant THSD7A (n = 1 experiment). o Representative electron microscopic analysis of the glomerular filtration barrier in control and THSD7A-immunized mice (n = 5 per group). Red arrows point at subepithelial electron-dense deposits. Red asterisks mark effaced podocyte foot processes. Bars 2 µm.
Fig. 4
Fig. 4. Analysis of IgG subclasses and complement deposition in experimental autoimmune MN.
a mIgG subclass-specific anti-THSD7A antibody levels over time as measured by ELISA in controls (n = 3) and THSD7A-immunized mice (n = 10). Data are presented as mean and SEM. b Representative immunofluorescence stainings for mIgG1, mIgG2a, mIgG2b, and mIgG3 in controls (n = 5) and THSD7A-immunized mice (n = 10). Bars 20 µm. c Quantitative analysis (histological score) of glomerular IgG subclass deposition in control and THSD7A-immunized mice. Data are presented as mean and SEM. d Representative immunofluorescence staining of complement C1q in co-localization with mouse IgG (mIgG) in THSD7A-immunized mice (n = 4). Bar 20 µm. The lower image is an enlargement of the boxed area in the upper image. e Representative immunofluorescence stainings for complement C1q, C4d, CFB, CFH, C3, and C5b-9 in co-localization with wheat germ agglutinin (WGA) and MBL in co-localization with nephrin in control (n = 5) and THSD7A-immunized mice (n = 10). Bars 4 µm. f Quantitative analysis (histological score) of glomerular C5b-9 deposition in control (n = 5) and THSD7A-immunized mice (n = 10). Data are presented as mean and SEM. g Correlation analyses of the mIgG1, mIgG2a, mIgG2b and mIgG3 scores with the C5b-9 score and correlation of the cumulative mIgG2a, mIgG2b, and mIgG3 (referred to as mIgG2-3) score with the C5b-9 score in THSD7A-immunized mice (n = 10). ns, not significant. Spearman’s r correlation coefficient (two-tailed). h Correlation analysis of C5b-9 scores with individual albuminuria values as measured by the area under the curve (AUC) per week in THSD7A-immunized mice (n = 10). Spearman’s r correlation coefficient (two-tailed).
Fig. 5
Fig. 5. Complement C3-deficient (C3−/−) mice show an ameliorated course of MN.
a Anti-THSD7A antibody titers as measured by ELISA in immunized animals. Controls (n = 7), THSD7A-immunized wild-type (WT) littermates (n = 19) and THSD7A-immunized C3−/− mice (n = 20) were experimented in three independent experiments. ns, not significant (mixed-effects analysis with Bonferroni correction for multiple comparisons). b Survival analysis. *p = 0.0457 (log-rank Mantel cox test). c Albuminuria over time as measured by albumin-to-creatinine ratio. **p = 0.0015, ****p < 0.0001 (mixed-effects analysis with Bonferroni correction for multiple comparisons). d Individual albuminuria as measured by the area under the curve (AUC) per week. *p = 0.0384 (Kruskal–Wallis with Dunn’s correction for multiple comparisons). e Nephrotic syndrome clinical score. *p = 0.0178 (Kruskal–Wallis test with Dunn’s correction for multiple comparisons). f Quantitative analysis (histological score) of glomerular mIgG subclass deposition. g Quantitative analysis (histological score) of glomerular C5b-9 deposition. In panels bg, data are presented as mean and SEM and derived from n = 7 controls, n = 19 THSD7A-immunized WT littermates, and n = 20 THSD7A-immunized C3−/− mice. h Representative images of podocyte foot process effacement as indicated by nephrin staining in structured-illumination super-resolution microscopy. Bars 10 µm. i Quantification of podocyte foot process effacement as measured by slit diaphragm (SD) length per area using the podocyte exact morphology measurement procedure (n = 3 controls, n = 19 WT littermates, n = 20 C3−/− mice analyzed). Data are presented as mean and SEM. ****p < 0.0001 (Kruskal–Wallis test with Dunn’s correction for multiple comparisons). j, k Correlation of the cumulative mIgG2a, mIgG2b, and mIgG3 (referred to as mIgG2-3) score with the C5b-9 score (left), correlation of the C5b-9 score with SD length per area (middle), and correlation of SD length per area with individual albuminuria as measured by the AUC per week (right) in THSD7A-immunized WT littermates (j) and C3−/− mice (k). ns, not significant. Spearman’s r correlation coefficient (two-tailed).
Fig. 6
Fig. 6. Exacerbation of disease in complement-competent mice is associated with distinct glomerular alterations.
a Representative immunofluorescence stainings and quantification of C5b-9 in control mice (n = 5), THSD7A-immunized wild-type (WT) mice, and WT littermates (analyzed together in one group referred to as WT/WT littermates; n = 22), THSD7A-immunized WT/WT littermates with severe disease (n = 7), and C3−/− mice (n = 20). Data are presented as mean and SEM. p from left to right, 0.003, 0.0320, <0.0001 (Kruskal–Wallis test with Dunn’s correction for multiple comparisons). b Representative nephrin stainings in structured-illumination super-resolution microscopy and quantification of podocyte foot process effacement as measured by slit diaphragm (SD) length per area using the podocyte exact morphology measurement procedure. Controls, n = 3. WT/WT littermates, n = 22. WT/WT littermates with severe disease, n = 7, C3−/− mice, n = 20. Data are presented as mean and SEM. ****p < 0.0001 (Kruskal–Wallis test with Dunn’s correction for multiple comparisons). c Representative immunofluorescence stainings showing DACH-1–positive podocytes and quantification of podocyte number. Controls, n = 5. WT/WT littermates, n = 21. WT/WT littermates with severe disease, n = 7, C3−/− mice, n = 20. Data are presented as mean and SEM. ns, not significant; ****p < 0.0001 (Kruskal–Wallis test with Dunn’s correction for multiple comparisons). d Representative immunofluorescence stainings and quantification (mean fluorescence intensity, MFI) of nephrin. Data are presented as mean and SEM. p from left to right, 0.0175, 0.0279, 0.0053 (Kruskal–Wallis test with Dunn’s correction for multiple comparisons). e Representative immunofluorescence stainings and quantification (MFI) of neph1. Data are presented as mean and SEM. p from left to right, 0.0077, 0.0482, 0.0003 (Kruskal–Wallis test with Dunn’s correction for multiple comparisons). f Representative immunofluorescence stainings and quantification (MFI) of synaptopodin. Data are presented as mean and SEM. ns, not significant (Kruskal–Wallis test with Dunn’s correction for multiple comparisons). In df controls, n = 6; WT/WT littermates, n = 8; WT/WT littermates with severe disease, n = 7; C3−/− mice, n = 9. Bars in b are 10 µm, all other bars are 20 µm.
Fig. 7
Fig. 7. C3-targeted siRNA treatment after onset of proteinuria attenuates MN in mice.
a Experimental scheme. Mice were injected weekly with control siRNA (n = 18) or C3 siRNA (n = 19) for 4 weeks in three independent experiments, starting when albuminuria exceeded 3 g/g urinary albumin-to-creatinine ratio. b Serum anti-THSD7A antibody titers as measured by ELISA. Data are presented as mean and SEM. ns, not significant (two-way ANOVA with Bonferroni correction for multiple comparisons). c, d Serum C3 levels in µg/mL (c) and expressed as percent from baseline (d). Data are presented as mean and SEM. ****p < 0.0001 (two-way ANOVA with Bonferroni correction for multiple comparisons). e Albuminuria over time as measured by albumin-to-creatinine ratio in control mice and THSD7A-immunized mice treated with control siRNA or C3 siRNA. *p = 0.0127 (two-way ANOVA with Bonferroni correction for multiple comparisons). In panels be, n = 18 control siRNA-treated animals and n = 19 C3 siRNA-treated animals were investigated. f Representative immunofluorescence stainings for murine IgG (mIgG) and complement components C1q, C4d, C3, and C5b-9 (controls, n = 3. Week 0, n = 1. Week 4 control siRNA, n = 6. Week 4 C3 siRNA, n = 6). Bars 4 µm.

Similar articles

Cited by

References

    1. Maisonneuve P, et al. Distribution of primary renal diseases leading to end-stage renal failure in the United States, Europe, and Australia/New Zealand: results from an international comparative study. Am. J. Kidney Dis. 2000;35:157–165. - PubMed
    1. Fogo AB, Lusco MA, Najafian B, Alpers CE. AJKD atlas of renal pathology: membranous nephropathy. Am. J. Kidney Dis. 2015;66:e15–e17. - PubMed
    1. Segawa Y, et al. IgG subclasses and complement pathway in segmental and global membranous nephropathy. Pediatr. Nephrol. 2010;25:1091–1099. - PubMed
    1. Beck LH, Jr., et al. M-type phospholipase A2 receptor as target antigen in idiopathic membranous nephropathy. N. Engl. J. Med. 2009;361:11–21. - PMC - PubMed
    1. Tomas NM, et al. Thrombospondin type-1 domain-containing 7A in idiopathic membranous nephropathy. N. Engl. J. Med. 2014;371:2277–2287. - PMC - PubMed

Publication types

Substances