. 2023 Jan 28;6(1):118.
doi: 10.1038/s42003-023-04496-9.

A design of experiments screen reveals that Clostridium novyi-NT spore germinant sensing is stereoflexible for valine and its analogs

Affiliations

A design of experiments screen reveals that Clostridium novyi-NT spore germinant sensing is stereoflexible for valine and its analogs

Ajitha Sundaresan et al. Commun Biol. .

Abstract

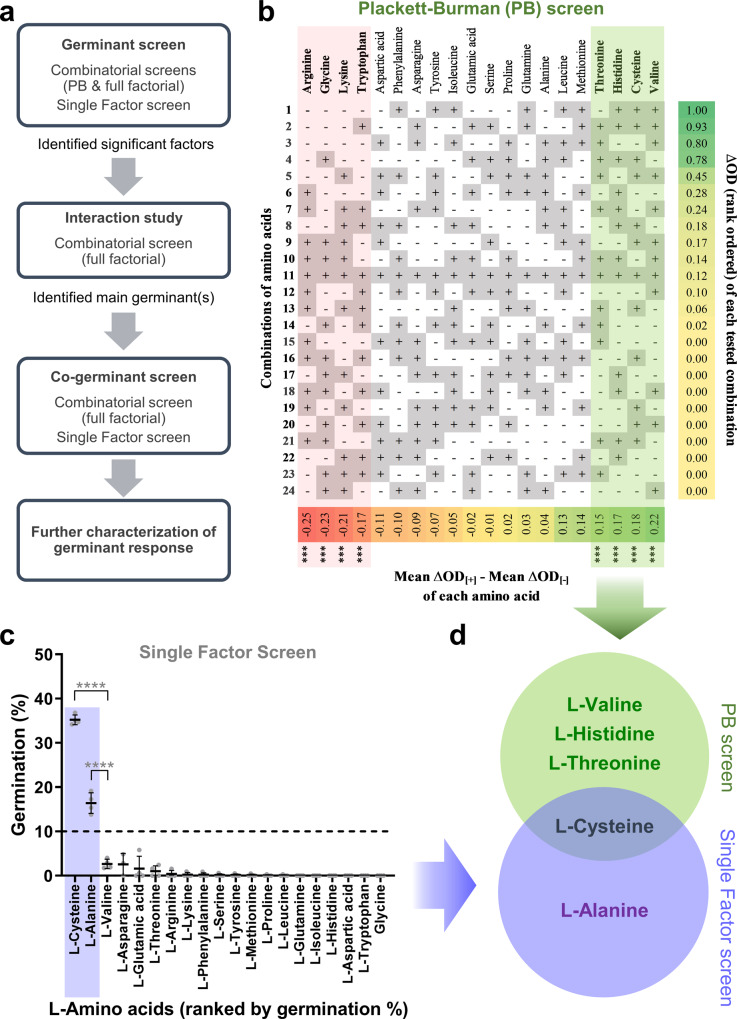
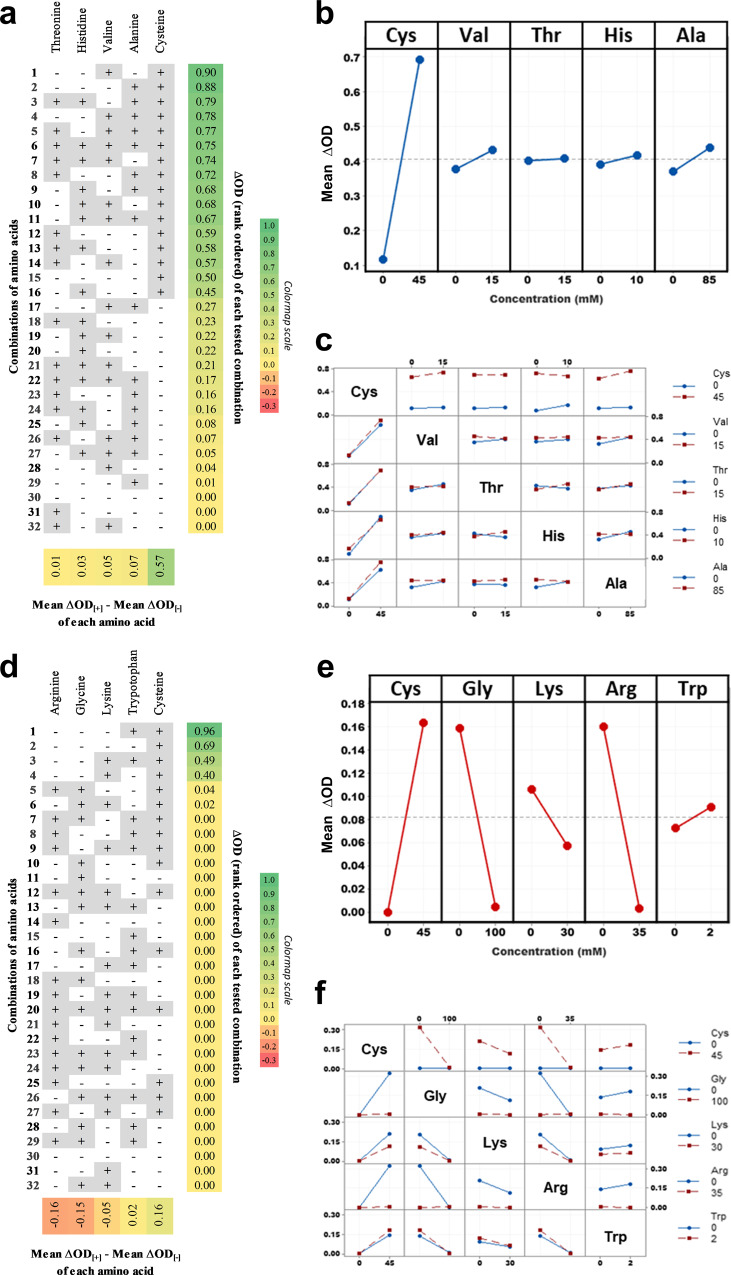
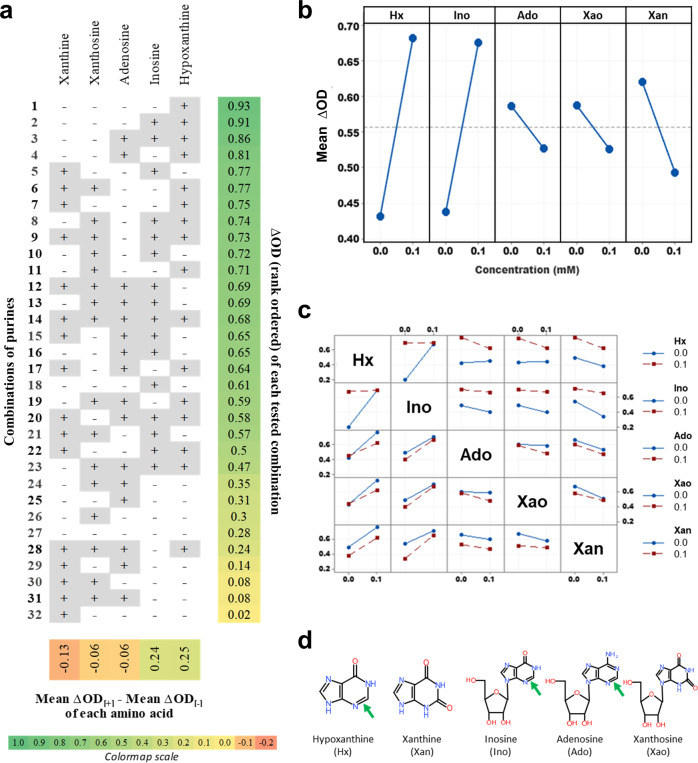
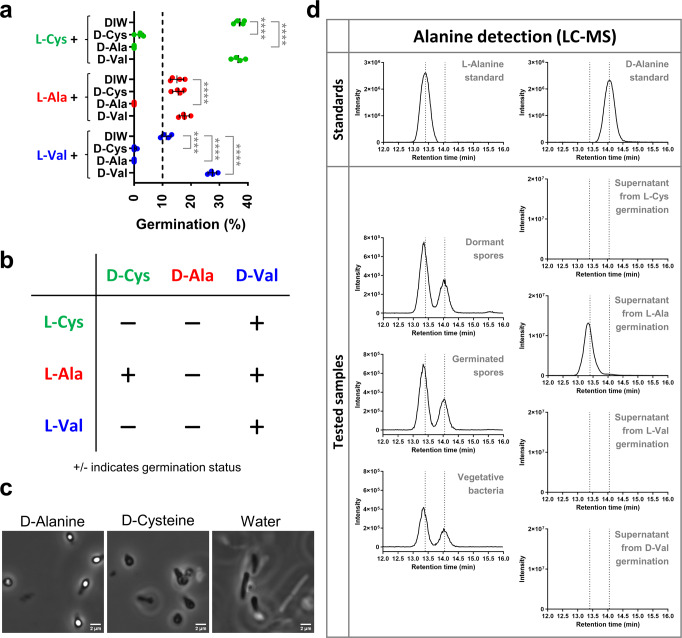
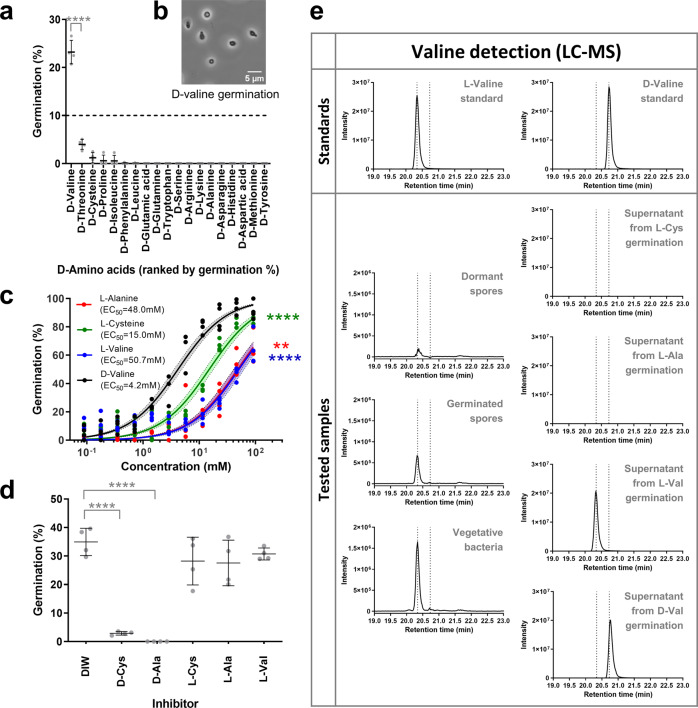
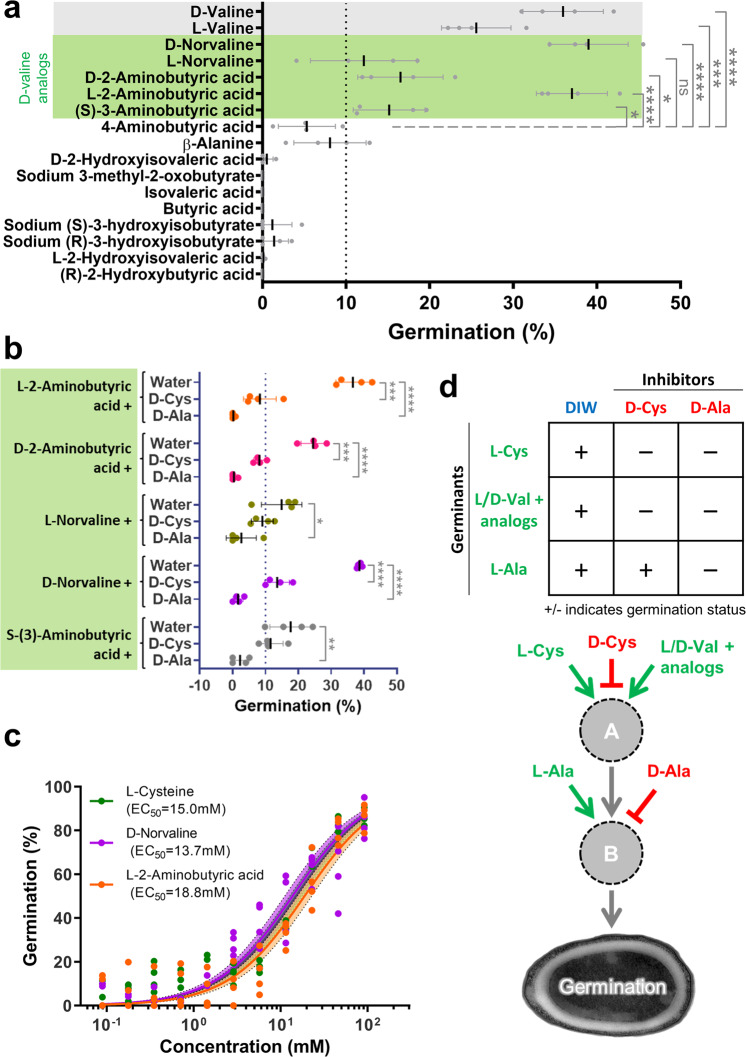
Although Clostridium novyi-NT is an anti-cancer bacterial therapeutic which germinates within hypoxic tumors to kill cancer cells, the actual germination triggers for C. novyi-NT are still unknown. In this study, we screen candidate germinants using combinatorial experimental designs and discover by serendipity that D-valine is a potent germinant, inducing 50% spore germination at 4.2 mM concentration. Further investigation revealed that five D-valine analogs are also germinants and four of these analogs are enantiomeric pairs. This stereoflexible effect of L- and D-amino acids shows that spore germination is a complex process where enantiomeric interactions can be confounders. This study also identifies L-cysteine as a germinant, and hypoxanthine and inosine as co-germinants. Several other amino acids promote (L-valine, L-histidine, L-threonine and L-alanine) or inhibit (L-arginine, L-glycine, L-lysine, L-tryptophan) germination in an interaction-dependent manner. D-alanine inhibits all germination, even in complex growth media. This work lays the foundation for improving the germination efficacy of C. novyi-NT spores in tumors.


Conflict of interest statement

The authors declare no competing interests.

Figures

Fig. 1
Fig. 1. Plackett–Burman and single factor screens for L-amino acid germinants.
a Schematic of the Design of Experiments (DOE) approach. b 20 L-amino acids at concentrations in Supplementary Table 3 were added in different combinations according to the Plackett-Burman (PB) design in Supplementary Table 1. Figure depicts the different combinations sorted in decreasing order (from top to bottom) of germination response expressed as ΔOD (extreme right column) as defined in Supplementary Table 4. Figure also shows the effect (bottom row) of each L-amino acid on the ΔOD, arranged in increasing order from left to right. Factors highlighted in red and green at the two extreme ends of the matrix represent the L-amino acids with the most significant antagonist and pro-germination effects respectively (ɑ = 0.0005). All data were averaged from two independent experiments with two replicates each and represent mean response values. c 20 L-amino acids at twice the concentrations in Supplementary Table 3 were added individually per well. The germination extent scatter dot plot for 20 L-amino acids as single factors is shown (mean ± SD), n = 4 biologically independent samples. Dashed line represents the 10% threshold for germination. L-amino acids are sorted according to their germination % (as defined in Supplementary Table 4), with highest to lowest from left to right. Shaded area in purple highlights L-amino acids which show significant germination compared to L-valine (Unpaired t-test, ****p < 0.0001). d Venn diagram of significant pro-germination candidates discovered through the PB screen (green) and single factor screen (purple).
Fig. 2
Fig. 2. Germinant interaction study of L-amino acid hits from PB and single factor screens.
Full factorial experiments were performed involving the pro-germination factors (panels ac) and antagonists of L-cysteine germination (panels df). Both experimental designs are detailed in Supplementary Table 2. Concentrations used were the same as the Plackett-Burman screen. a, d Figures depict the different combinations of factors, sorted in decreasing order (from top to bottom) of ΔOD (extreme right column) as defined in Supplementary Table 4. The effect (bottom row) of each L-amino acid on ΔOD, arranged in increasing order from left to right is also shown. b, e Main interaction plot of pro-germination L-amino acids (blue lines with circles, model ɑ = 0.0001) and antagonist L-amino acids with L-cysteine (red lines with circles, model ɑ = 0.001) respectively showing the average of ΔOD for each amino acid concentration. c, f Secondary interaction plot showing the interactions between all pairs of factors. Blue lines with circles represent absence, and red lines with circles represent the presence of indicated L-amino acids. All data were averaged from two independent experiments with two replicates each and represent mean response values. Positive slopes indicate positive effects on germination, while negative slopes indicate inhibitory effects.
Fig. 3
Fig. 3. Purine co-germinant full factorial screen with L-cysteine.
Germination response was measured in the presence of L-cysteine (10 mM) for all combinations of purines (0.1 mM) according to the factorial design detailed in Supplementary Table 2 (panels ac). a Figure shows the different combinations of purines in the presence of main germinant L-cysteine, sorted in decreasing order (from top to bottom) of ΔOD (extreme right column) as defined in Supplementary Table 4. Figure also shows the effect (bottom row) of each purine on ΔOD, arranged in increasing order from left to right. b Main interactions plot for the five purine analogs (blue lines with circles, model ɑ = 0.0005). c Secondary interaction plot showing the interactions between all pairs of factors. Blue lines with circles represent absence and red lines with circles represent presence of indicated purines. d Structures of the five purine analogs. A reduced purine ring featuring a C2-N3 double bond (green arrow) is associated with germination. All data were averaged from two independent experiments with two replicates each and represent mean response values.
Fig. 4
Fig. 4. Inhibition of C. novyi-NT spore germination by D-alanine.
a Scatter dot plot of percent germination (as defined in Supplementary Table 4) by L-amino acid germinants (91.5 mM) in the presence of candidate D-amino acid inhibitors (91.5 mM). Green, red and blue circles refer to L-cysteine, L-alanine, and L-valine, respectively. All data depict mean ± SD, n = 4 biologically independent samples. Significance at ****p ≤ 0.0001 (Unpaired t-test). b Summary table of results from (a). c Phase contrast images of spores inoculated overnight in RCM-FBS oxyrase media containing D-alanine (93.5 mM), D-cysteine (93.5 mM) and Water. Images are best representative from two independent experiments. Magnification 1600×, Scale bar 2 µm. d LC-MS EIC spectra of derivatized alanine ion (351 m/z) for Standards of L-alanine, D-alanine and Samples of peptidoglycan extracts from dormant spores, germinated spores, vegetative bacteria, and supernatants from spores germinated in L-cysteine, L-alanine, L-valine or D-valine. Dotted lines represent standard peaks for L-alanine and D-alanine at retention times of 13.4 and 14.05 min, respectively. Data shown is the best representative of water blank subtracted spectra from two independent experiments.
Fig. 5
Fig. 5. D-valine is a bona fide germinant.
a Single factor screen for 19 D-amino acids where each D-amino acid was tested individually for germination at concentrations in Supplementary Table 3. Dashed line represents a germination threshold of 10%. D-amino acids are sorted in decreasing order of germination % from left to right. Significant at ****p ≤ 0.0001 (unpaired t-test) when compared with D-threonine. b Phase contrast image of C. novyi-NT spores germinated with D-valine (45.7 mM) at 1000× magnification. Scale bar 5 µm. c Dose response curve for germination response at different concentrations of D-valine (black), L-cysteine (green), L-alanine (red), and L-valine (blue) normalized to germination with D-valine at the highest concentration 91.5 mM. Circles depict individual values. Solid lines depict the least squares fit regression curve. Shaded area shows the 95% confidence error bands for each L-amino acid fit. EC50 values are shown in the legend and are significant at ****p ≤ 0.0001,***p ≤ 0.001,**p ≤ 0.01 (unpaired t-test) when compared to D-valine. d Germination by D-valine (91.5 mM) in the presence of other D- and L-amino acids (91.5 mM). Significant at ****p ≤ 0.0001 (unpaired t-test) when compared with DIW control. e LC-MS EIC spectra of derivatized valine ion (379 m/z) for Standards of L-valine, D-valine, and Samples of Peptidoglycan extracts of dormant spores, germinated spores, vegetative bacteria and supernatants from spores germinated in L-cysteine, L-alanine, L-valine or D-valine. Data shown is the best representative of water blank-subtracted spectra from two independent experiments. Dotted lines represent the standard peaks for L-valine (20.34 min) and D-valine (20.73 min) respectively. All germination data depict mean ± SD, n = 4 biologically independent samples. Germination % for all graphs are defined in Supplementary Table 4.
Fig. 6
Fig. 6. Germination with D-valine analogs.
a Single factor screen of stereoisomeric structural analogs of D-valine. All analogs were at 91.5 mM concentration. D-valine and L-valine were used as reference positive controls (gray). All valine analogs with germination >10% (green) were identified as germinants. Significant at ****p ≤ 0.0001,***p ≤ 0.001,**p ≤ 0.01,*p ≤ 0.05, ns p > 0.05 (unpaired t-test) when compared to 4-aminobutyric acid. b Germination response of valine analogs (91.5 mM) L-2-aminobutyric acid (orange circles), D-2-aminobutyric acid (pink circles), L-norvaline (dark green circles), D-norvaline (purple circles), S-(3)-aminobutyric acid (gray circles) in the presence of the inhibitors D-cysteine and D-alanine (91.5 mM concentration). Significant at ****p ≤ 0.0001,***p ≤ 0.001,**p ≤ 0.01,*p ≤ 0.05, ns p > 0.05 (unpaired t-test) when compared to corresponding water controls. c Dose response curve for germination response at different concentrations of L-2-aminobutyric acid (orange), D-norvaline (purple) and L-cysteine (green) (normalized to germination with D-valine at the highest concentration 91.5 mM) shows potency of valine analogs similar to L-cysteine. Circles depict individual values. Solid lines depict the least squares fit regression curve. Shaded area shows the 95% confidence error bands for each amino acid fit. EC50 values are shown in the legend. d Proposed two-component signaling framework for C. novyi-NT germination. All germination data depict mean ± SD, n = 4 biologically independent samples. Germination % for all graphs are defined in Supplementary Table 4.

References

    1. Hatheway CL. Toxigenic clostridia. Clin. Microbiol. Rev. 1990;3:66–98. - PMC - PubMed
    1. Prescott, J. F. Clostridial Diseases of Animals 13–19 (John Wiley & Sons, Inc, 2016).
    1. McGUIGAN CC, et al. Lethal outbreak of infection with Clostridium novyi type A and other spore-forming organisms in Scottish injecting drug users. J. Med. Microbiol. 2002;51:971–977. - PubMed
    1. Dang LH, Bettegowda C, Huso DL, Kinzler KW, Vogelstein B. Combination bacteriolytic therapy for the treatment of experimental tumors. Proc. Natl Acad. Sci. USA. 2001;98:15155–15160. - PMC - PubMed
    1. Cheong I, et al. A bacterial protein enhances the release and efficacy of liposomal cancer drugs. Science. 2006;314:1308–1311. - PubMed

Publication types

Supplementary concepts