

Spatio-temporal trends of malaria incidence from 2011 to 2017 and environmental predictors of malaria transmission in Myanmar
- PMID: 36709318
- PMCID: PMC9883610
- DOI: 10.1186/s40249-023-01055-6
Spatio-temporal trends of malaria incidence from 2011 to 2017 and environmental predictors of malaria transmission in Myanmar
Abstract
Background: Myanmar bears the heaviest malaria burden in the Greater Mekong Subregion (GMS). This study assessed the spatio-temporal dynamics and environmental predictors of Plasmodium falciparum and Plasmodium vivax malaria in Myanmar.
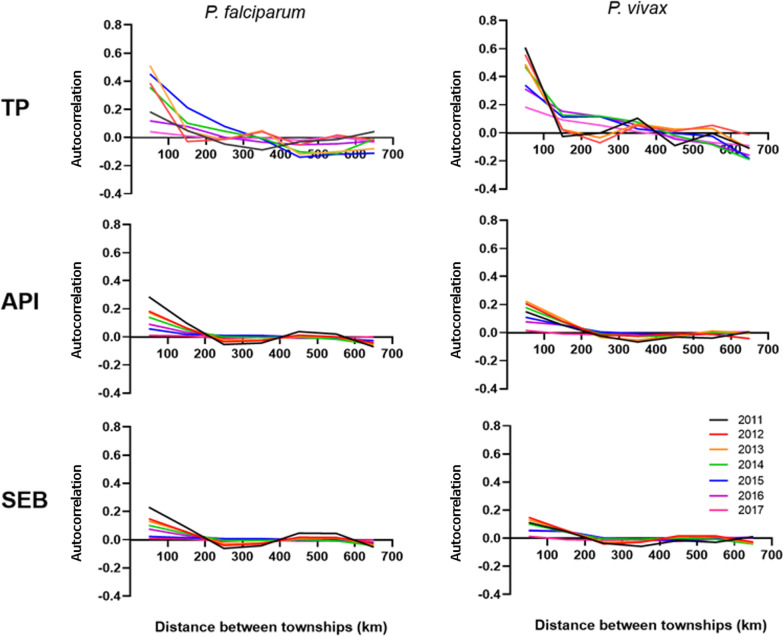
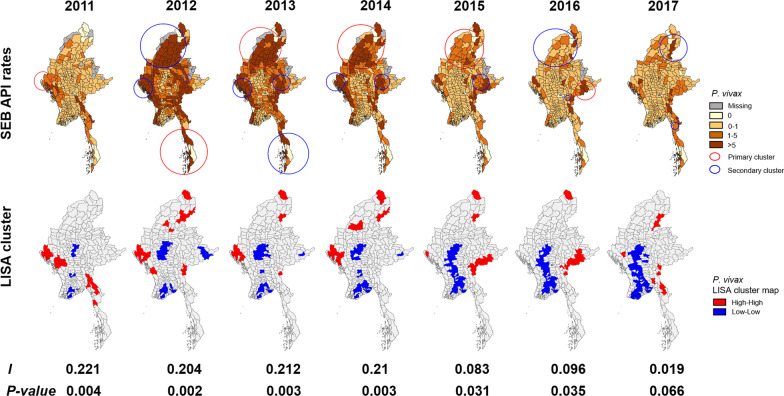
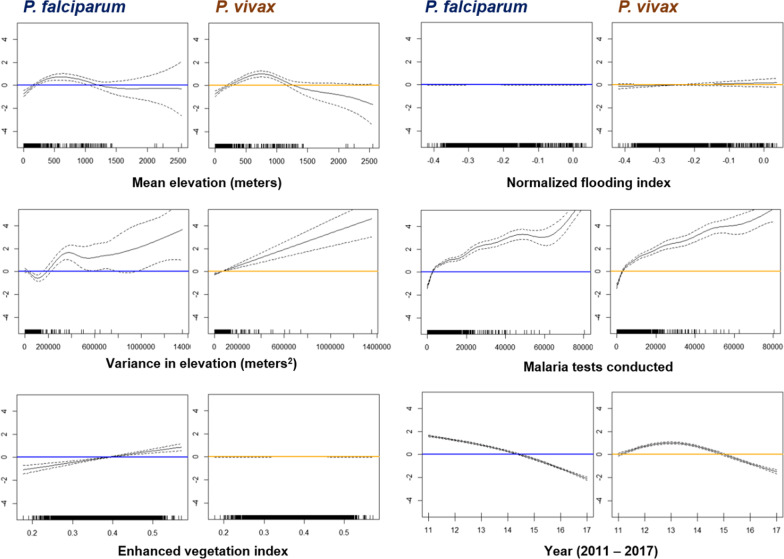
Methods: Monthly reports of malaria cases at primary health centers during 2011-2017 were analyzed to describe malaria distribution across Myanmar at the township and state/region levels by spatial autocorrelation (Moran index) and spatio-temporal clustering. Negative binomial generalized additive models identified environmental predictors for falciparum and vivax malaria, respectively.
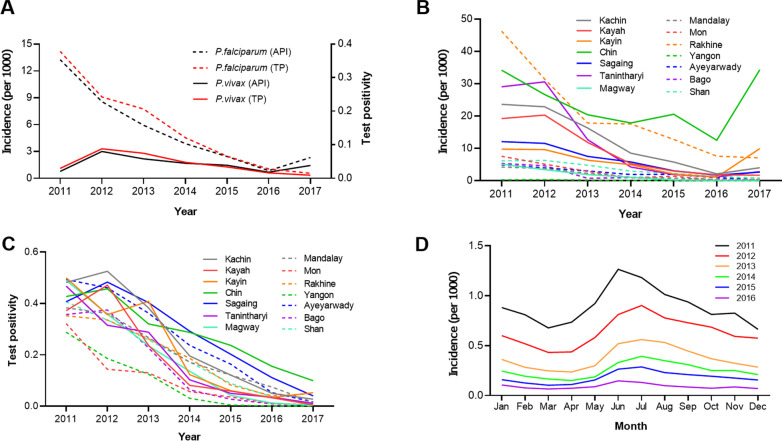
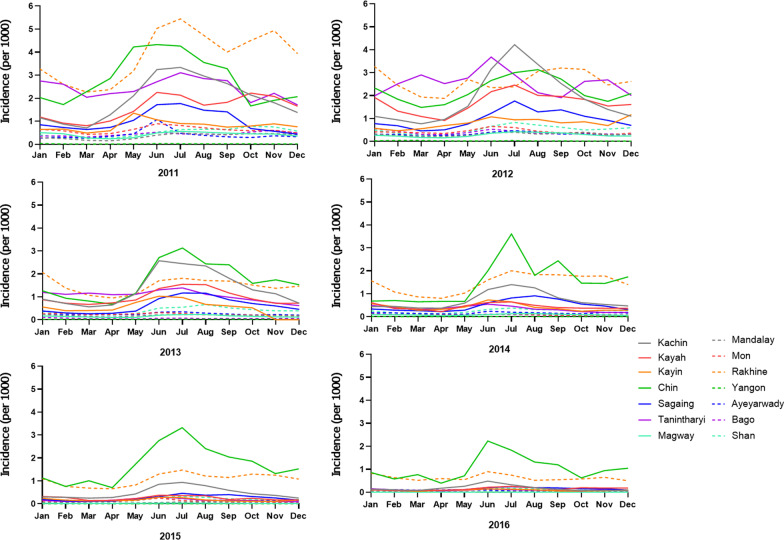
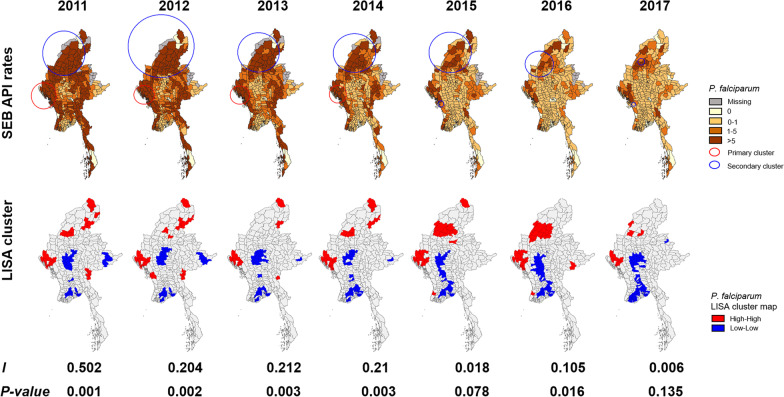
Results: From 2011 to 2017, there was an apparent reduction in malaria incidence in Myanmar. Malaria incidence peaked in June each year. There were significant spatial autocorrelation and clustering with extreme spatial heterogeneity in malaria cases and test positivity across the nation (P < 0.05). Areas with higher malaria incidence were concentrated along international borders. Primary clusters of P. falciparum persisted in western townships, while clusters of P. vivax shifted geographically over the study period. The primary cluster was detected from January 2011 to December 2013 and covered two states (Sagaing and Kachin). Annual malaria incidence was highest in townships with a mean elevation of 500‒600 m and a high variance in elevation (states with both high and low elevation). There was an apparent linear relationship between the mean normalized difference vegetative index and annual P. falciparum incidence (P < 0.05).
Conclusion: The decreasing trends reflect the significant achievement of malaria control efforts in Myanmar. Prioritizing the allocation of resources to high-risk areas identified in this study can achieve effective disease control.
Keywords: Environmental predictor; Myanmar; Plasmodium falciparum; Plasmodium vivax; Spatial distribution; Spatiotemporal clustering; Temporal clustering.
© 2023. The Author(s).
Conflict of interest statement
The authors declare that they have no conflict of interests.
Figures
Similar articles
-
Spatiotemporal dynamics of malaria in Banmauk Township, Sagaing region of Northern Myanmar: characteristics, trends, and risk factors.BMC Infect Dis. 2022 Jul 28;22(1):653. doi: 10.1186/s12879-022-07634-6. BMC Infect Dis. 2022. PMID: 35902825 Free PMC article.
-
From control to elimination: a spatial-temporal analysis of malaria along the China-Myanmar border.Infect Dis Poverty. 2020 Nov 19;9(1):158. doi: 10.1186/s40249-020-00777-1. Infect Dis Poverty. 2020. PMID: 33213516 Free PMC article.
-
Geographical heterogeneity in prevalence of subclinical malaria infections at sentinel endemic sites of Myanmar.Parasit Vectors. 2019 Feb 18;12(1):83. doi: 10.1186/s13071-019-3330-1. Parasit Vectors. 2019. PMID: 30777127 Free PMC article.
-
Malaria epidemiology and interventions in Ethiopia from 2001 to 2016.Infect Dis Poverty. 2018 Nov 5;7(1):103. doi: 10.1186/s40249-018-0487-3. Infect Dis Poverty. 2018. PMID: 30392470 Free PMC article. Review.
-
The impact of mass screening and treatment interventions on malaria incidence and prevalence: a retrospective analysis of a malaria elimination programme in eastern Myanmar, and systematic review and meta-analysis.Malar J. 2025 May 8;24(1):148. doi: 10.1186/s12936-025-05392-9. Malar J. 2025. PMID: 40340798 Free PMC article.
Cited by
-
'Forest malaria' in Myanmar? Tracking transmission landscapes in a diversity of environments.Parasit Vectors. 2023 Sep 12;16(1):324. doi: 10.1186/s13071-023-05915-w. Parasit Vectors. 2023. PMID: 37700295 Free PMC article.
-
Analyzing spatial delays of tuberculosis from surveillance and awareness surveys in Eastern China.Sci Rep. 2024 Aug 27;14(1):19799. doi: 10.1038/s41598-024-70283-z. Sci Rep. 2024. PMID: 39187557 Free PMC article.
-
Risk factor for gametocyte carriage and gametocytemia in Plasmodium vivax and Plasmodium falciparum.Infect Dis Poverty. 2025 Aug 4;14(1):79. doi: 10.1186/s40249-025-01352-2. Infect Dis Poverty. 2025. PMID: 40759976 Free PMC article.
-
Efficacy of Focal Primaquine Mass Administration for Eliminating Plasmodium vivax Malaria in Northern Myanmar: A Cluster-Randomized Trial.Open Forum Infect Dis. 2025 Aug 5;12(8):ofaf465. doi: 10.1093/ofid/ofaf465. eCollection 2025 Aug. Open Forum Infect Dis. 2025. PMID: 40799786 Free PMC article.
-
Plasmodium vivax populations in the western Greater Mekong Subregion evaluated using a genetic barcode.PLoS Negl Trop Dis. 2024 Jul 3;18(7):e0012299. doi: 10.1371/journal.pntd.0012299. eCollection 2024 Jul. PLoS Negl Trop Dis. 2024. PMID: 38959285 Free PMC article.
References
-
- WHO . World Malaria Report 2022. Geneva: World Health Organization; 2022.
-
- WHO . Mekong Malaria Elimination Programme. Geneva: World Health Organization; 2021.
-
- Inkochasan M, Gopinath D, Vicario E, Lee A, Duigan P. Access to health care for migrants in the Greater Mekong Subregion: policies and legal frameworks and their impact on malaria control in the context of malaria elimination. WHO South East Asia J Public Health. 2019;8:26–34. - PubMed
-
- Hewitt SE. Let’s ‘cut to the chase’ on malaria elimination in the Greater Mekong Subregion. Trans R Soc Trop Med Hyg. 2019;113:161–2. - PubMed
-
- Hewitt S, Delacollette C, Poirot E. Malaria control in the Greater Mekong Subregion: an overview of the current response and its limitations. Southeast Asian J Trop Med Public Health. 2013;44(Suppl 1):249–305. - PubMed
MeSH terms
Grants and funding
LinkOut - more resources
Full Text Sources
Medical
