

Next-Generation Morphometry for pathomics-data mining in histopathology
- PMID: 36709324
- PMCID: PMC9884209
- DOI: 10.1038/s41467-023-36173-0
Next-Generation Morphometry for pathomics-data mining in histopathology
Abstract
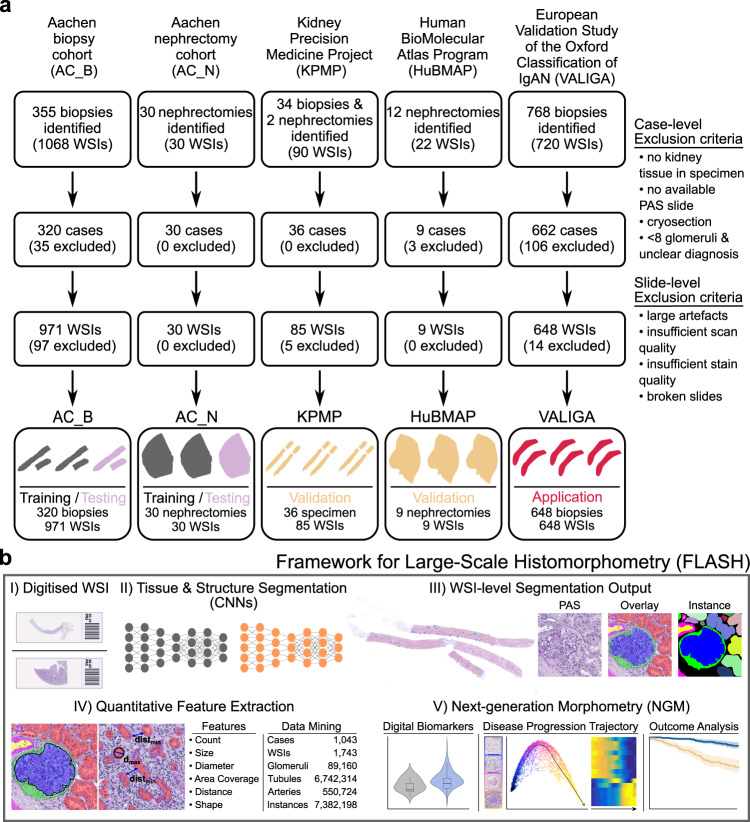
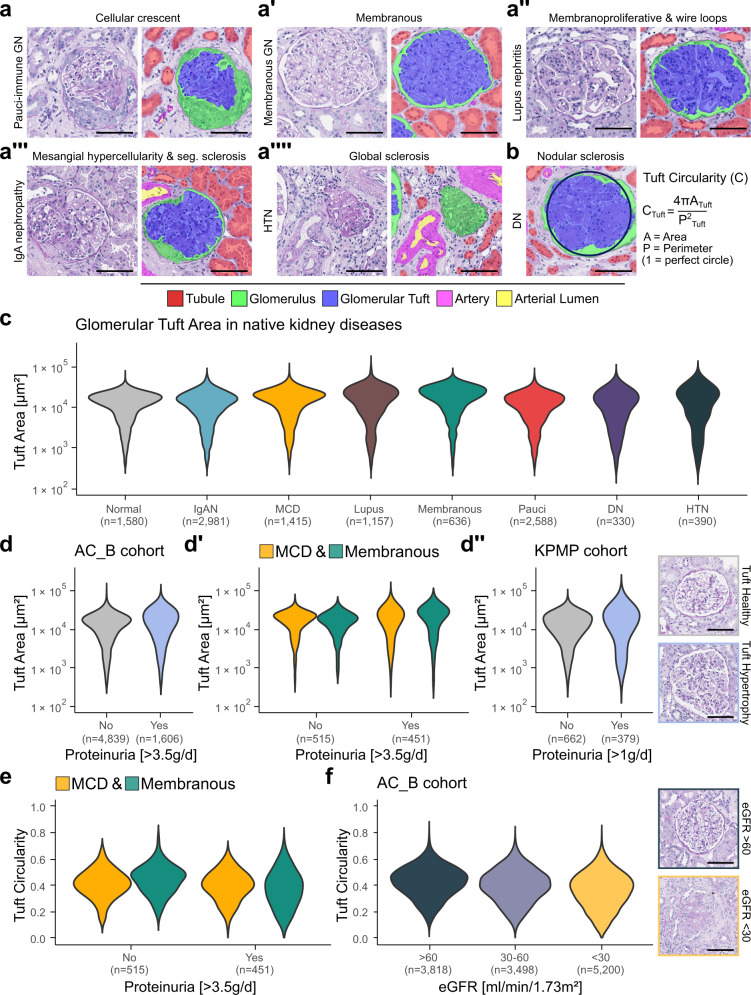
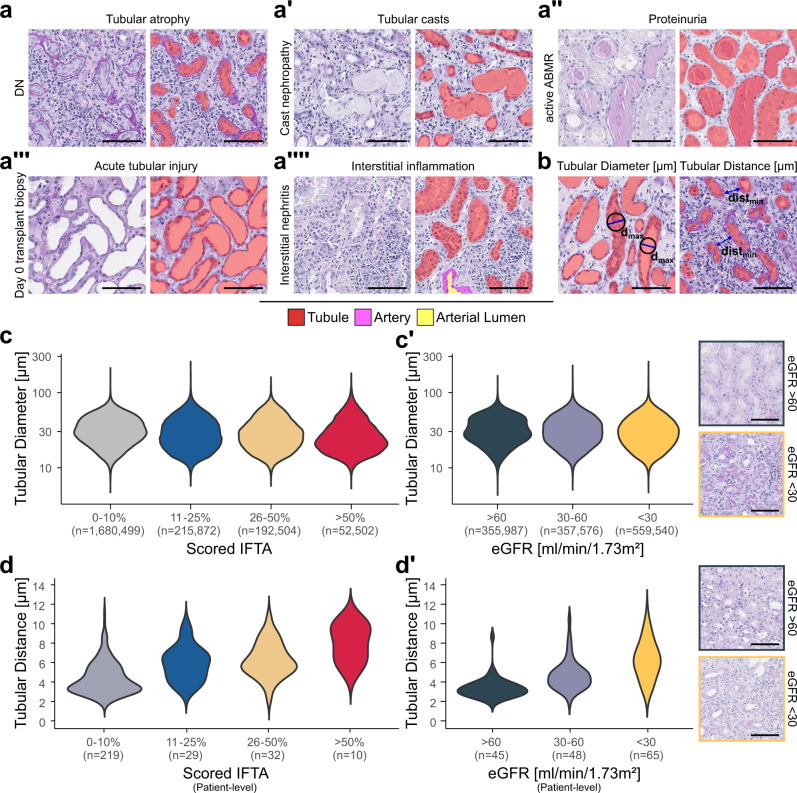
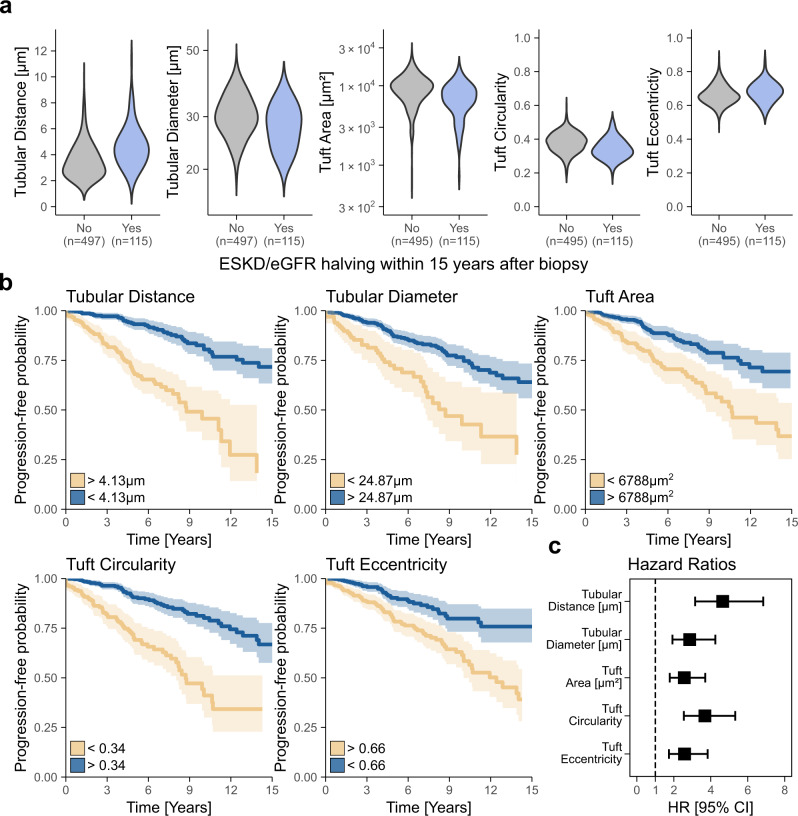
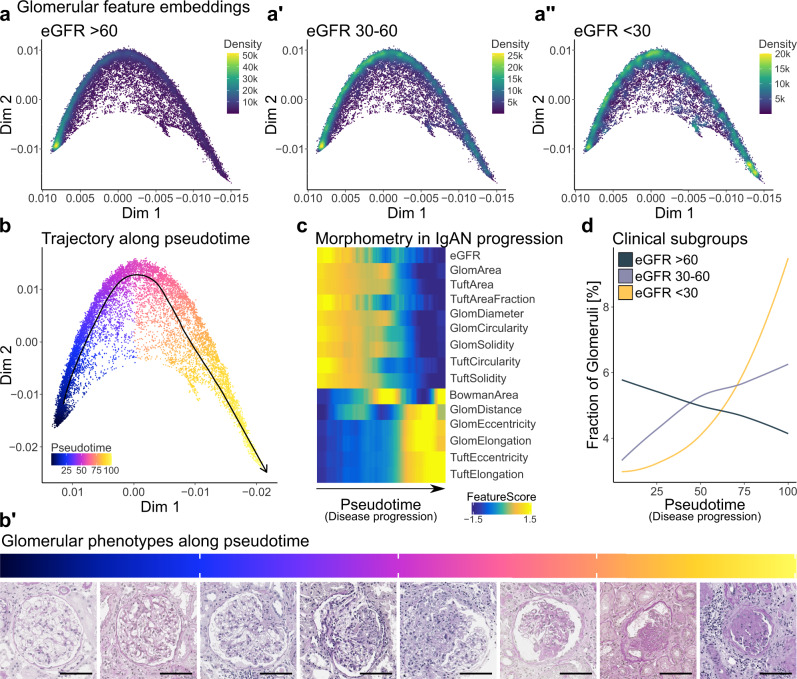
Pathology diagnostics relies on the assessment of morphology by trained experts, which remains subjective and qualitative. Here we developed a framework for large-scale histomorphometry (FLASH) performing deep learning-based semantic segmentation and subsequent large-scale extraction of interpretable, quantitative, morphometric features in non-tumour kidney histology. We use two internal and three external, multi-centre cohorts to analyse over 1000 kidney biopsies and nephrectomies. By associating morphometric features with clinical parameters, we confirm previous concepts and reveal unexpected relations. We show that the extracted features are independent predictors of long-term clinical outcomes in IgA-nephropathy. We introduce single-structure morphometric analysis by applying techniques from single-cell transcriptomics, identifying distinct glomerular populations and morphometric phenotypes along a trajectory of disease progression. Our study provides a concept for Next-generation Morphometry (NGM), enabling comprehensive quantitative pathology data mining, i.e., pathomics.
© 2023. The Author(s).
Conflict of interest statement
The authors declare no competing interests.
Figures
Comment in
-
Learning from deep learning and pathomics.Kidney Int. 2023 Dec;104(6):1050-1053. doi: 10.1016/j.kint.2023.06.006. Epub 2023 Jun 17. Kidney Int. 2023. PMID: 37336291 No abstract available.
Similar articles
-
Deep Learning-Based Segmentation and Quantification in Experimental Kidney Histopathology.J Am Soc Nephrol. 2021 Jan;32(1):52-68. doi: 10.1681/ASN.2020050597. Epub 2020 Nov 5. J Am Soc Nephrol. 2021. PMID: 33154175 Free PMC article.
-
[Advances in computational quantitative nephropathology].Pathologie (Heidelb). 2024 Mar;45(2):140-145. doi: 10.1007/s00292-024-01300-1. Epub 2024 Feb 2. Pathologie (Heidelb). 2024. PMID: 38308066 Review. German.
-
Large-scale extraction of interpretable features provides new insights into kidney histopathology - A proof-of-concept study.J Pathol Inform. 2022 May 25;13:100097. doi: 10.1016/j.jpi.2022.100097. eCollection 2022. J Pathol Inform. 2022. PMID: 36268111 Free PMC article.
-
Spatial Pathomics Toolkit for Quantitative Analysis of Podocyte Nuclei with Histology and Spatial Transcriptomics Data in Renal Pathology.Proc SPIE Int Soc Opt Eng. 2024 Feb;12933:1293310. doi: 10.1117/12.3006318. Epub 2024 Apr 3. Proc SPIE Int Soc Opt Eng. 2024. PMID: 40375953 Free PMC article.
-
[Aiming for zero blindness].Nippon Ganka Gakkai Zasshi. 2015 Mar;119(3):168-93; discussion 194. Nippon Ganka Gakkai Zasshi. 2015. PMID: 25854109 Review. Japanese.
Cited by
-
Artificial Intelligence-Based Treatment Decisions: A New Era for NSCLC.Cancers (Basel). 2024 Feb 19;16(4):831. doi: 10.3390/cancers16040831. Cancers (Basel). 2024. PMID: 38398222 Free PMC article. Review.
-
High-throughput image analysis with deep learning captures heterogeneity and spatial relationships after kidney injury.Sci Rep. 2023 Apr 19;13(1):6361. doi: 10.1038/s41598-023-33433-3. Sci Rep. 2023. PMID: 37076596 Free PMC article.
-
Chronic Changes on Kidney Histology by a Multiclass Artificial Intelligence Model.Kidney Int Rep. 2025 May 29;10(8):2668-2679. doi: 10.1016/j.ekir.2025.05.035. eCollection 2025 Aug. Kidney Int Rep. 2025. PMID: 40814612 Free PMC article.
-
Artificial Intelligence Assists in the Detection of Blood Vessels in Whole Slide Images: Practical Benefits for Oncological Pathology.Biomolecules. 2023 Aug 29;13(9):1327. doi: 10.3390/biom13091327. Biomolecules. 2023. PMID: 37759727 Free PMC article. Review.
-
QOT: Efficient Computation of Sample Level Distance Matrix from Single-Cell Omics Data through Quantized Optimal Transport.bioRxiv [Preprint]. 2024 Feb 6:2024.02.06.578032. doi: 10.1101/2024.02.06.578032. bioRxiv. 2024. Update in: Brief Bioinform. 2024 Nov 22;26(1):bbae713. doi: 10.1093/bib/bbae713. PMID: 38370767 Free PMC article. Updated. Preprint.
References
-
- Working Group of the International IgA Nephropathy Network and the Renal Pathology Society. et al. The Oxford classification of IgA nephropathy: rationale, clinicopathological correlations, and classification. Kidney Int. 2009;76:534–545. - PubMed
-
- Trimarchi H, et al. Oxford Classification of IgA nephropathy 2016: an update from the IgA Nephropathy Classification Working Group. Kidney Int. 2017;91:1014–1021. - PubMed
-
- Bellur SS, et al. Reproducibility of the Oxford classification of immunoglobulin A nephropathy, impact of biopsy scoring on treatment allocation and clinical relevance of disagreements: evidence from the VALidation of IGA study cohort. Nephrol. Dial. Transpl. 2019;34:1681–1690. - PubMed
Publication types
MeSH terms
LinkOut - more resources
Full Text Sources
Miscellaneous
