. 2023 Jan 28;13(1):1599.
doi: 10.1038/s41598-023-27535-1.

Malaria parasite density and detailed qualitative microscopy enhances large-scale profiling of infection endemicity in Nigeria

Affiliations

Malaria parasite density and detailed qualitative microscopy enhances large-scale profiling of infection endemicity in Nigeria

Wellington Oyibo et al. Sci Rep. .

Abstract

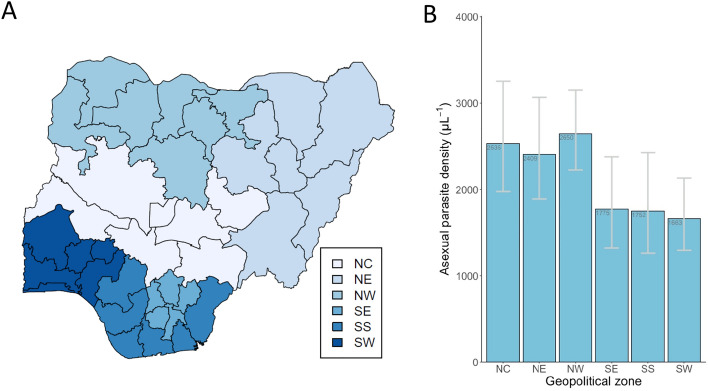
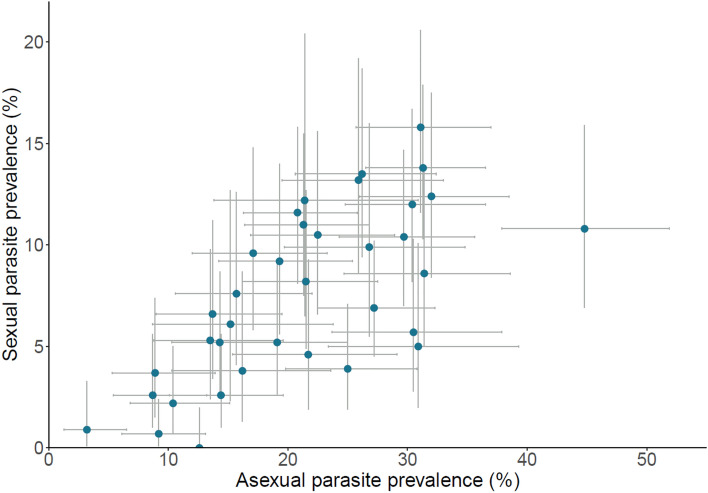
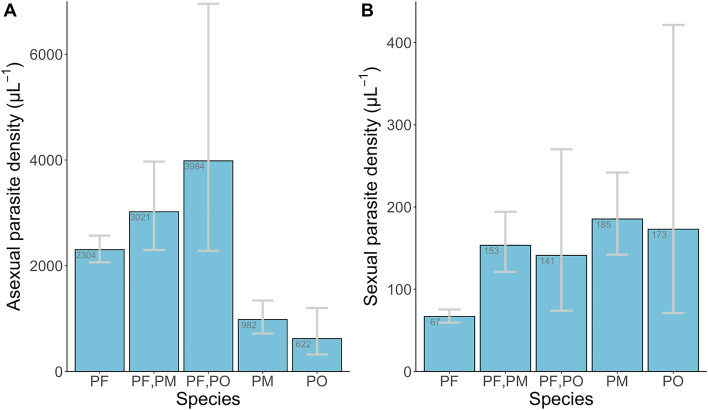
With global progress towards malaria reduction stalling, further analysis of epidemiology is required, particularly in countries with the highest burden. National surveys have mostly analysed infection prevalence, while large-scale data on parasite density and different developmental forms rarely available. In Nigeria, the country with the largest burden globally, blood slide microscopy of children up to 5 years of age was conducted in the 2018 National Demographic and Health Survey, and parasite prevalence previously reported. In the current study, malaria parasite density measurements are reported and analysed for 7783 of the children sampled across the 36 states within the six geopolitical zones of the country. Asexual and sexual stages, and infections with different malaria parasite species are analysed. Across all states of Nigeria, there was a positive correlation between mean asexual parasite density within infected individuals and prevalence of infection in the community (Spearman's rho = 0.39, P = 0.02). Asexual parasite densities were highest in the northern geopolitical zones (geometric means > 2000 μL-1), extending the evidence of exceptionally high infection burden in many areas. Sexual parasite prevalence in each state was highly correlated with asexual parasite prevalence (Spearman's rho = 0.70, P < 0.001), although sexual parasite densities were low (geometric means < 100 μL-1 in all zones). Infants had lower parasite densities than children above 1 year of age, but there were no differences between male and female children. Most infections were of P. falciparum, which had higher asexual densities but lower sexual parasite densities than P. malariae or P. ovale mono-infections. However, mixed species infections had the highest asexual parasite densities. It is recommended that future large surveys in high burden countries measure parasite densities as well as developmental stages and species, to improve the quality of malaria epidemiology and tracking of future changes.


Conflict of interest statement

The authors declare no competing interests.

Figures

Figure 1
Figure 1
Malaria parasite densities within infections in children up to 5 years of age vary among the major geopolitical regions of Nigeria. (A) Map of Nigeria, showing the major six geopolitical zones of the country, and the individual states (map produced in R using the naijR package). (B) Geometric mean parasite densities (with 95% confidence intervals) among slide-positive children in the six different major geopolitical zones (NC, North Central; NE, North East, NW, North West; SE, South East; SS, South South; SW, South West). There is significant overall heterogeneity (Kruskal–Wallis test, P < 0.001), and each zone in the north of the country has higher density infections than each zone in the south of the country (Mann–Whitney pairwise tests, P < 0.001).
Figure 2
Figure 2
Geographical variation in mean malaria parasite density in infected children up to 5 years of age in Nigeria. (A) Variation in geometric mean parasite density among all 36 states, with densities shaded by value categories as indicated. The names of individual states are shown in Fig. 1, and numerical values (with 95% CIs of estimates) are tabulated in Supplementary Table S1. (B) Prevalence of malaria parasite infection in each of the states, shaded by value categories as indicated and previously analysed. (C) Scatterplot showing a positive significant correlation between asexual parasite prevalence and density within infections in each state in Nigeria. Lines indicate the 95% CI for the density and prevalence for each state (a point on the far left corresponds to Lagos which does not show 95% CI for density as there were too few samples positive for accurate estimation). All values are shown in Supplementary Table S1.
Figure 3
Figure 3
Significant positive correlation between asexual and sexual malaria parasite prevalence in children up to 5 years of age in each of the 36 states within Nigeria (Spearman’s rho = 0.70, P < 0.001). 95% CIs are shown for all estimates, and all values are shown in Supplementary Table S1.
Figure 4
Figure 4
Geometric means (with 95% CIs) of asexual and sexual parasite densities for different Plasmodium species and co-infections in Nigeria (PF, P. falciparum; PM, P. malariae; PO, P. ovale; no slide was positive for P. vivax). Sample sizes (numbers of infections with asexual parasites counted) for the asexual density measurements were 1450, 109, 24, 71 and 19 (for PF, PF/PM, PF/PO, PM and PO respectively). Sample sizes (numbers of infections with sexual parasites counted) for the sexual density measurements was 472, 61, 15, 45 and 11 (for PF, PF/PM, PF/PO, PM and 19 respectively).

References

    1. WHO. World Malaria Report 2022. (World Health Organization, 2022).
    1. WHO. High burden to high impact: A targeted malaria response. https://www.who.int/malaria/publications/atoz/high-impact-response/en/. (World Health Organization, 2019).
    1. Rosenthal PJ, John CC, Rabinovich NR. Malaria: How are we doing and how can we do better? Am. J. Trop. Med. Hyg. 2019;100:239–241. doi: 10.4269/ajtmh.18-0997. - DOI - PMC - PubMed
    1. Hay SI, Smith DL, Snow RW. Measuring malaria endemicity from intense to interrupted transmission. Lancet Infect. Dis. 2008;8:369–378. doi: 10.1016/S1473-3099(08)70069-0. - DOI - PMC - PubMed
    1. Abeles J, Conway DJ. The Gini coefficient as a useful measure of malaria inequality among populations. Malar. J. 2020;19:444. doi: 10.1186/s12936-020-03489-x. - DOI - PMC - PubMed

Publication types