

Improved downstream functional analysis of single-cell RNA-sequence data using DGAN
- PMID: 36709340
- PMCID: PMC9884242
- DOI: 10.1038/s41598-023-28952-y
Improved downstream functional analysis of single-cell RNA-sequence data using DGAN
Abstract
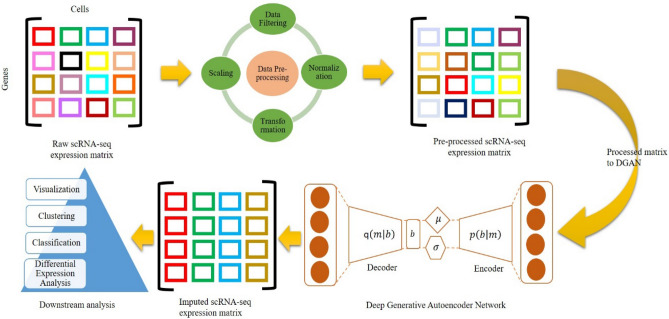
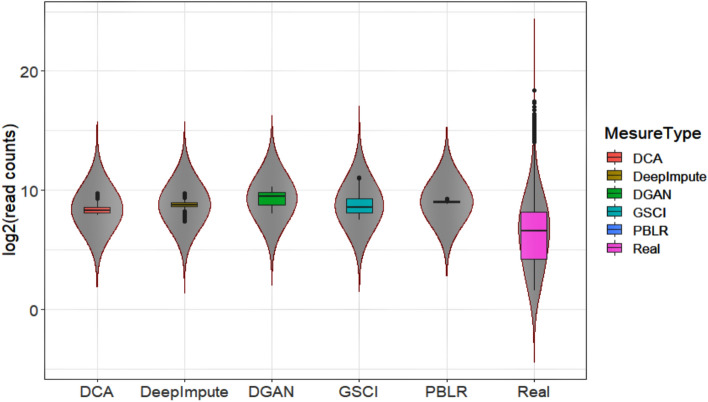
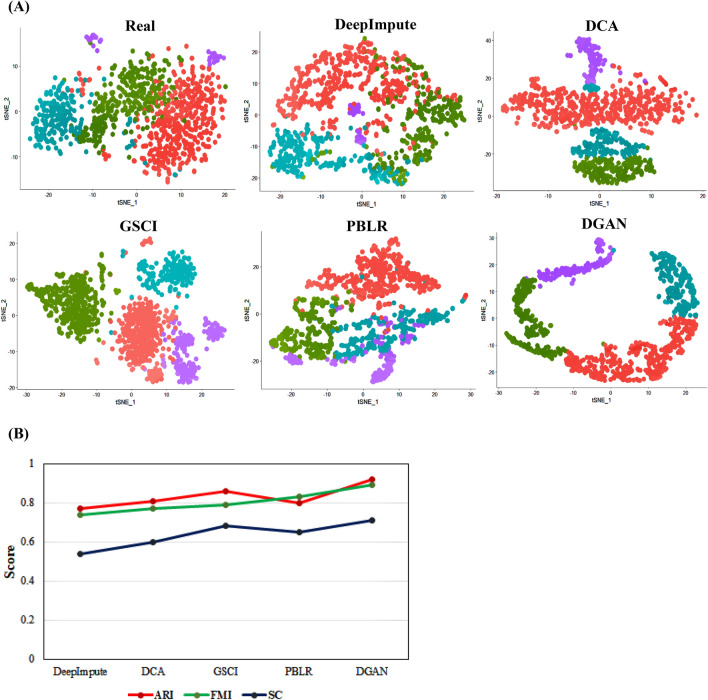
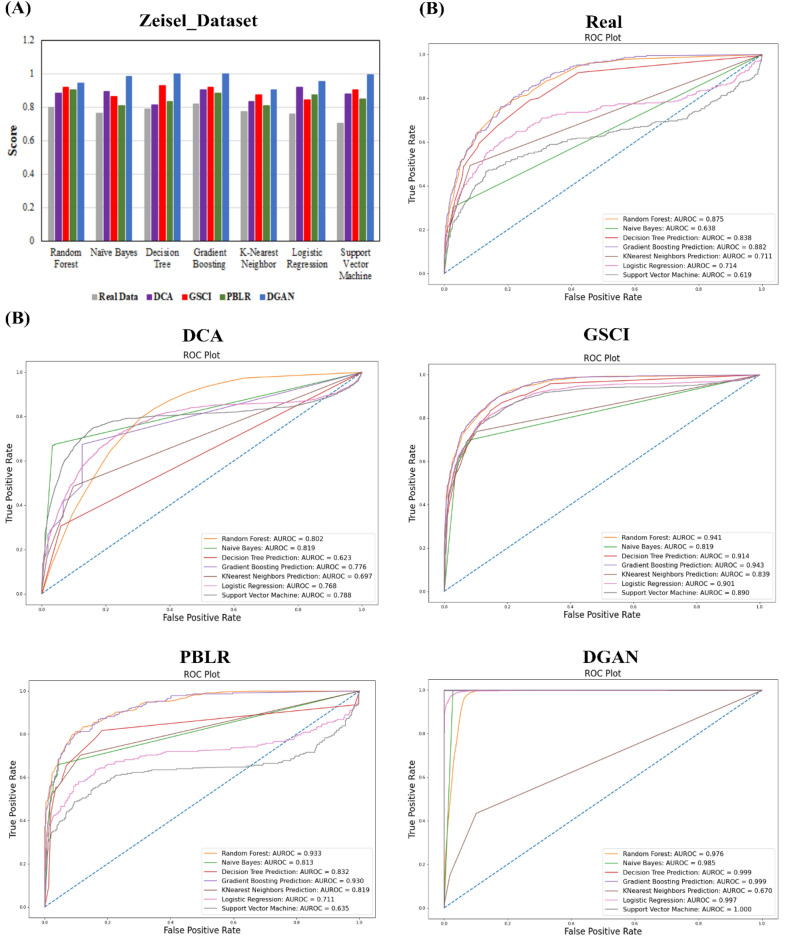
The dramatic increase in the number of single-cell RNA-sequence (scRNA-seq) investigations is indeed an endorsement of the new-fangled proficiencies of next generation sequencing technologies that facilitate the accurate measurement of tens of thousands of RNA expression levels at the cellular resolution. Nevertheless, missing values of RNA amplification persist and remain as a significant computational challenge, as these data omission induce further noise in their respective cellular data and ultimately impede downstream functional analysis of scRNA-seq data. Consequently, it turns imperative to develop robust and efficient scRNA-seq data imputation methods for improved downstream functional analysis outcomes. To overcome this adversity, we have designed an imputation framework namely deep generative autoencoder network [DGAN]. In essence, DGAN is an evolved variational autoencoder designed to robustly impute data dropouts in scRNA-seq data manifested as a sparse gene expression matrix. DGAN principally reckons count distribution, besides data sparsity utilizing a gaussian model whereby, cell dependencies are capitalized to detect and exclude outlier cells via imputation. When tested on five publicly available scRNA-seq data, DGAN outperformed every single baseline method paralleled, with respect to downstream functional analysis including cell data visualization, clustering, classification and differential expression analysis. DGAN is executed in Python and is accessible at https://github.com/dikshap11/DGAN .
© 2023. The Author(s).
Conflict of interest statement
The authors declare no competing interests.
Figures
Similar articles
-
GE-Impute: graph embedding-based imputation for single-cell RNA-seq data.Brief Bioinform. 2022 Sep 20;23(5):bbac313. doi: 10.1093/bib/bbac313. Brief Bioinform. 2022. PMID: 35901457
-
Bubble: a fast single-cell RNA-seq imputation using an autoencoder constrained by bulk RNA-seq data.Brief Bioinform. 2023 Jan 19;24(1):bbac580. doi: 10.1093/bib/bbac580. Brief Bioinform. 2023. PMID: 36567258
-
CDSImpute: An ensemble similarity imputation method for single-cell RNA sequence dropouts.Comput Biol Med. 2022 Jul;146:105658. doi: 10.1016/j.compbiomed.2022.105658. Epub 2022 May 21. Comput Biol Med. 2022. PMID: 35751187
-
Machine learning and statistical methods for clustering single-cell RNA-sequencing data.Brief Bioinform. 2020 Jul 15;21(4):1209-1223. doi: 10.1093/bib/bbz063. Brief Bioinform. 2020. PMID: 31243426 Review.
-
Evaluating the performance of dropout imputation and clustering methods for single-cell RNA sequencing data.Comput Biol Med. 2022 Jul;146:105697. doi: 10.1016/j.compbiomed.2022.105697. Epub 2022 Jun 8. Comput Biol Med. 2022. PMID: 35697529 Review.
Cited by
-
Refining the optimal CAF cluster marker for predicting TME-dependent survival expectancy and treatment benefits in NSCLC patients.Sci Rep. 2024 Jul 21;14(1):16766. doi: 10.1038/s41598-024-55375-0. Sci Rep. 2024. PMID: 39034310 Free PMC article.
-
A scoping review on deep learning for next-generation RNA-Seq. data analysis.Funct Integr Genomics. 2023 Apr 21;23(2):134. doi: 10.1007/s10142-023-01064-6. Funct Integr Genomics. 2023. PMID: 37084004
-
Improved meta-analysis pipeline ameliorates distinctive gene regulators of diabetic vasculopathy in human endothelial cell (hECs) RNA-Seq data.PLoS One. 2023 Nov 9;18(11):e0293939. doi: 10.1371/journal.pone.0293939. eCollection 2023. PLoS One. 2023. PMID: 37943808 Free PMC article.
-
scMGCN: A Multi-View Graph Convolutional Network for Cell Type Identification in scRNA-seq Data.Int J Mol Sci. 2024 Feb 13;25(4):2234. doi: 10.3390/ijms25042234. Int J Mol Sci. 2024. PMID: 38396909 Free PMC article.
References
-
- Svensson, V., Vento-Tormo, R. & Teichmann, S. A. Exponential scaling of single-cell RNA-seq in the last decade. [Online]. https://www.neb.com/faqs/2012/11/19/what-is-the-starting-material-i-need...-. - PubMed
MeSH terms
Substances
LinkOut - more resources
Full Text Sources
