. 2023 Jan 28;14(1):466.
doi: 10.1038/s41467-023-36023-z.

Metamorphism in TDP-43 prion-like domain determines chaperone recognition

Affiliations

Metamorphism in TDP-43 prion-like domain determines chaperone recognition

Jaime Carrasco et al. Nat Commun. .

Abstract

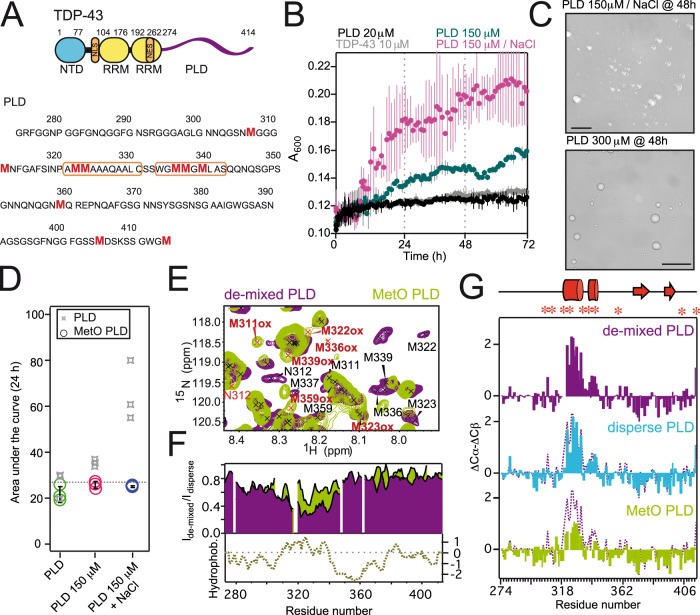
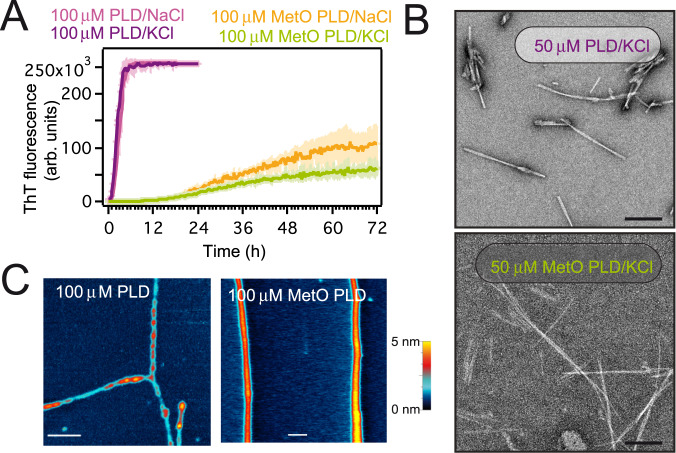
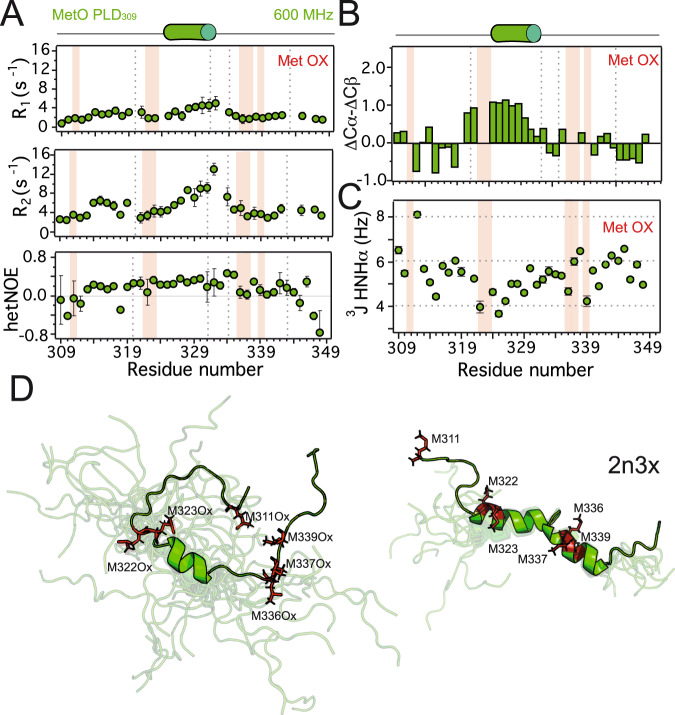
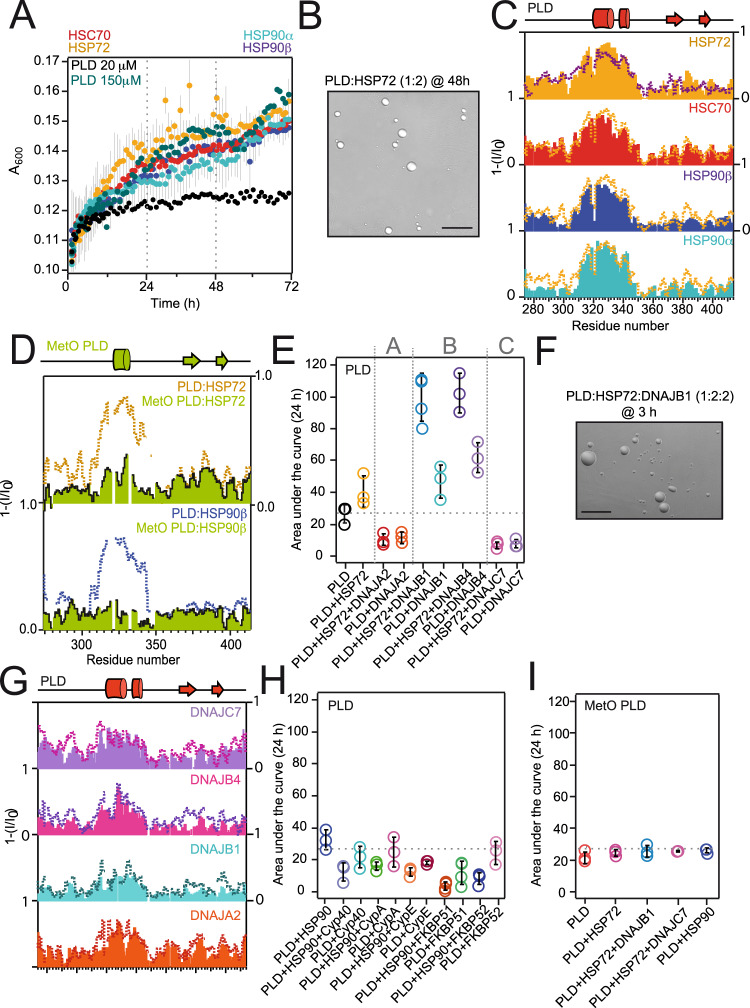
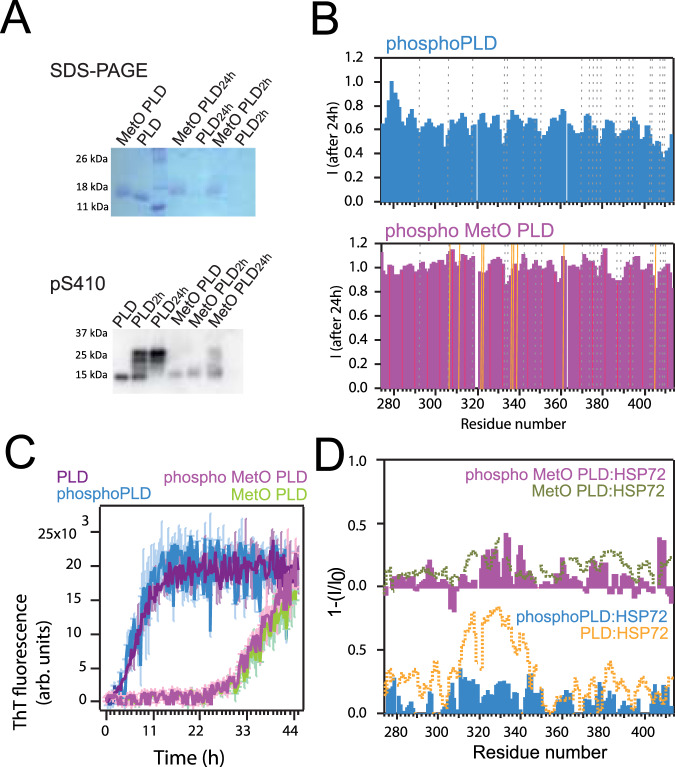
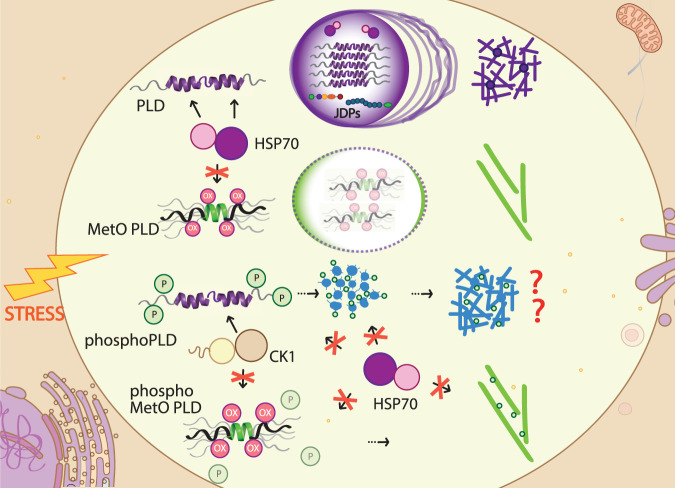
The RNA binding protein TDP-43 forms cytoplasmic inclusions via its C-terminal prion-like domain in several neurodegenerative diseases. Aberrant TDP-43 aggregation arises upon phase de-mixing and transitions from liquid to solid states, following still unknown structural conversions which are primed by oxidative stress and chaperone inhibition. Despite the well-established protective roles for molecular chaperones against protein aggregation pathologies, knowledge on the determinants of chaperone recognition in disease-related prions is scarce. Here we show that chaperones and co-chaperones primarily recognize the structured elements in TDP-43´s prion-like domain. Significantly, while HSP70 and HSP90 chaperones promote TDP-43 phase separation, co-chaperones from the three classes of the large human HSP40 family (namely DNAJA2, DNAJB1, DNAJB4 and DNAJC7) show strikingly different effects on TDP-43 de-mixing. Dismantling of the second helical element in TDP-43 prion-like domain by methionine sulfoxidation impacts phase separation and amyloid formation, abrogates chaperone recognition and alters phosphorylation by casein kinase-1δ. Our results show that metamorphism in the post-translationally modified TDP-43 prion-like domain encodes determinants that command mechanisms with major relevance in disease.


Conflict of interest statement

J.C., R.A., D.P.U., D.V.L., M.G., and J.O. are co-inventors of the patent application EP22383245 filed on 20/12/2022 by Consejo Superior de Investigaciones Científicas, that includes the production, sulfoxidation and conformational features of PLD and PLD309 fragments. A.V., M.M., and R.H. declare no competing interests.

Figures

Fig. 1
Fig. 1. Methionine sulfoxidation impairs TDP-43’s PLD phase separation by reshaping its structure.
A Cartoon representation of the domain architecture of TDP-43 (top). The disordered PLD (region 274–414) is represented by a purple line. PLD primary structure, with the Met residues highlighted in red (bottom). The double α-helices are limited by orange boxes. B Turbidity measurements showing concentration- and salt-dependent LLPS for the PLD. C Differential Interference Contrast (DIC) microscopy images showing liquid condensates formed by the PLD in the specified conditions. Scale bars correspond to 25 μM. D LLPS of MetO PLD in the corresponding samples (circles), compared to unmodified PLD (gray stars), as measured by the area under the turbidity curves after 24 h of incubation. Gray broken line corresponds to the averaged LLPS of unmodified PLD. E Detailed region of the overlay of the 15N-HSQC spectra from de-mixed PLD (purple) and MetO PLD (green) showing the large shifts for the Met moieties upon methionine sulfoxidation. MetO cross peaks are highlighted in red. F Comparison of the NMR signal intensity of unmodified PLD (purple) and MetO PLD (green) upon de-mixing shows a reduced broadening in the region 305-345 for MetO PLD. The preceding region (280–305) is also partially broadened in both proteins. The plot at the bottom shows the hydrophobicity of the PLD. G Secondary chemical shifts (ΔCα-ΔCβ) analysis for 300 μM PLD (top), 25 μM PLD (middle), and 300 μM MetO PLD (bottom). In these plots, positive values indicate acquisition of α-helical conformations, while negative values correspond to β-strand structures. Each plot shows the overlay with the structural propensities at 300 μM (broken purple line) for comparison. The schematic cartoon at the top highlights the two α-helices (in cylinders) and β-strands (arrows) formed in the PLD. Met residues are located with asterisks. For clarity, Met residues were removed from the MetO PLD plot (bottom) due to the strong shifts upon oxidation (Supplementary Fig. 5B). Unless otherwise stated, turbidimetry and microscopy samples (B–D) contained 150 mM KCl. NaCl in B–D refers to 150 mM NaCl. NMR samples (E–G) contained 10 mM KCl.
Fig. 2
Fig. 2. MetO PLD forms distinct fibrillar aggregates.
A Amyloid aggregation kinetics as measured by ThT fluorescence. Samples contained either 150 mM KCl or 150 mM NaCl, as noted. B Representative electron micrographs showing fibrils formed by 50 μM PLD and MetO PLD aged for 20 days. Scale bars correspond to 200 nm. C Atomic force microscopy topographic characterization of the fibrils formed by 100 μM PLD (left) and 100 μM MetO PLD (right) samples aged for 4 months. PLD fibrils show variable diameters along their length. Scale bars correspond to 400 nm. Heat-color height scale is 5 nm. Samples in B and C contained 150 mM KCl.
Fig. 3
Fig. 3. Methionine sulfoxidation promotes significant disorder in the PLD.
A Longitudinal (R1, top), transverse (R2, middle) rate constants, and heteronuclear (1H)-15N NOE (bottom) relaxation parameters were obtained for MetO PLD309 at 600 MHz. The values of all relaxation parameters indicate that the protein is highly dynamic. B Secondary chemical shifts (ΔCα-ΔCβ) for MetO PLD309. C J-coupling assessment of the secondary structure propensities for MetO PLD309. Values around 4 Hz indicate α-helix formation, while values around 8 Hz are typical of β-strand structures. D Structural ensemble of the 20 conformers of MetO PLD309 with the lowest conformational energy as calculated by CYANA (left), compared to the ensemble of ten conformers of a comparable PLD fragment (PDB code 2n3x, right). The lowest energy structure is displayed on top of the corresponding ensemble, with the rest of the conformers shown in transparent representation. Structures were aligned onto the structured elements. Met residues are highlighted in red stick representation. Gray broken lines in A, B plots indicate the boundaries of the two α-helices present in the PLD, while light red bars mark the location of Met residues. Diagrams on top of the plots (A, B) represent the α-helix formed in MetO PLD309 (green cylinder).
Fig. 4
Fig. 4. The interplay with chaperones and co-chaperones is mediated by the double α-helix of the PLD.
A Turbidity measurements of the PLD in presence of the indicated chaperones (all in 1:2 molar ratios). Error bars are not included in the PLD plot (black dots) for clarity. B DIC microscopy image of the condensates formed by 20 μM PLD in complex with HSP72 after 48 h of incubation at 25 °C. C NMR signal intensity plots of 25–35 μM PLD in complex with the indicated chaperones (all in 1:2 molar ratios). For comparison, the plots are overlaid with the data corresponding to de-mixed PLD (300 μM PLD, broken purple line, Fig. 1F) and HSP72 interaction (orange broken line). D NMR intensity plots for MetO PLD in the presence of the chaperones (green bars) in comparison to the unmodified PLD:chaperone interactions in identical molar ratios (broken lines). E LLPS of 20 μM PLD in the presence of HSP72 and/or JDPs represented as the area under the curve of the turbidity measurements after 24 h. Vertical broken lines separate the three JDP classes (A, B, and C, indicated on top). F DIC microscopy image of the condensates formed by 20 μM PLD in complex with HSP72:DNAJB1 after 3 h of incubation at 25 °C. G NMR signal intensity plots for the interaction of 25–35 μM PLD with JDPs (all in 1:2 molar ratios). In each plot, the broken line represents the interaction of the PLD with HSP72 and the corresponding JDPs (all in 1:2:2 molar ratios). H LLPS of 20 μM PLD in presence of HSP90 and the specified co-chaperones as measured by turbidity. I LLPS of 20 μM MetO PLD in the presence of the specified chaperones and co-chaperones. For simplicity, the plots in C, D, and G show the reverse of the NMR signal decay. The gray broken line in E, H, and I represents the average turbidity of 20 μM PLD, for comparison. Scale bars (B, F) correspond to 25 μM. Turbidimetry and microscopy samples (A, B, E, F, H, I) contained 150 mM KCl, whereas NMR samples (C, D, G) contained 10 mM KCl.
Fig. 5
Fig. 5. MetO impairs CK1δ phosphorylation.
A Western blot immunoblotting results for the phosphorylation of the PLD using pS410 (bottom) antibody. CK1δ incubation times are indicated. Band at 14 kDa corresponds to unphosphorylated PLD, and phosphorylation is revealed as an increase in the molecular weight. On top, the same samples are subjected to SDS-PAGE, for comparison. Phosphorylated PLD is undetected in the gel due to aggregation. MetO samples are noticeably detained during migration in the gel. B NMR signal intensity decay plots after 24 h of incubation at 25 °C for 40 μM phosphoPLD (top) and phospho MetO PLD (bottom). The decay in intensity observed in phosphoPLD is attributed to sample precipitation. Broken gray lines locate Ser resides and golden lines locate Met residues. C Kinetics of amyloid fibril formation as measured by ThT fluorescence for 20 μM PLD samples. D Reverse of the NMR intensity plots for 40 μM phosphoPLD (bottom, blue) and phospho MetO PLD (top, magenta) in the presence of HSP72 (all in 1:2 molar ratios). For comparison, the plots are overlaid to the data for PLD:HSP72 interaction (bottom, orange line, corresponding to Fig. 4C) and MetO PLD:HSP72 (top, green line, corresponding to Fig. 4D) in identical molar ratios.
Fig. 6
Fig. 6. Mechanistic model for the role of the modifications in the PLD in TDP-43 pathogenicity.
TDP-43 PLD phase separation is strictly controlled by HSP70 and JDPs, whose interaction is mediated by structured elements present in the PLD. A liquid-to-solid transition will promote aggregate and fibril formation. Under oxidative stress, methionine sulfoxidation of the PLD will promote structural changes that will abrogate chaperone control and impact PLD phase separation, leading to the formation of alternative mature amyloid fibrils. While CK1δ phosphorylation promotes the aggregation of the PLD and hampers its recognition by HSP70, phosphorylation of soluble PLD is prevented after methionine sulfoxidation. Overall, modifications in the PLD trigger metamorphism which determines chaperone recognition, with impact on TDP-43’s pathophysiology.

References

    1. Josephs KA, et al. TDP-43 is a key player in the clinical features associated with Alzheimer’s disease. Acta Neuropathol. 2014;127:811–824. - PMC - PubMed
    1. Nonaka T, et al. Prion-like properties of pathological TDP-43 aggregates from diseased brains. Cell Rep. 2013;4:124–134. - PubMed
    1. Polymenidou M, Cleveland DW. The seeds of neurodegeneration: prion-like spreading in ALS. Cell. 2011;147:498–508. - PMC - PubMed
    1. Taylor JP, Brown RH, Cleveland DW. Decoding ALS: from genes to mechanism. Nature. 2016;539:197–206. - PMC - PubMed
    1. Neumann M, et al. Ubiquitinated TDP-43 in frontotemporal lobar degeneration and amyotrophic lateral sclerosis. Science. 2006;314:130–133. - PubMed

Publication types