

Magnetic and electronic properties unveil polaron formation in Eu[Formula: see text]In[Formula: see text]Sb[Formula: see text]
- PMID: 36709384
- PMCID: PMC9884272
- DOI: 10.1038/s41598-023-28711-z
Magnetic and electronic properties unveil polaron formation in Eu[Formula: see text]In[Formula: see text]Sb[Formula: see text]
Abstract
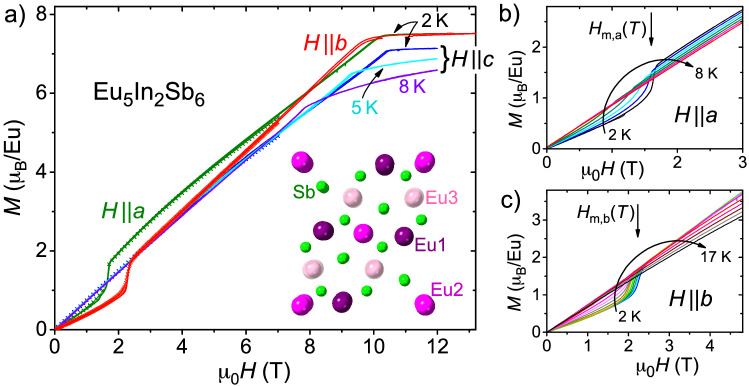
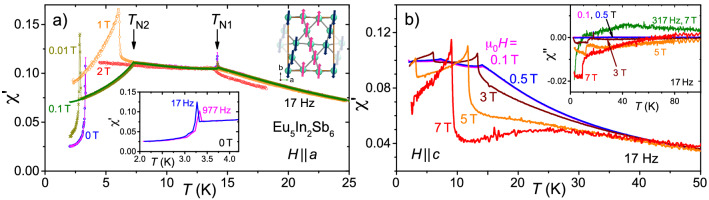
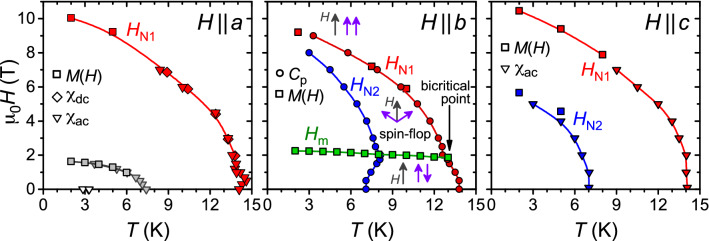
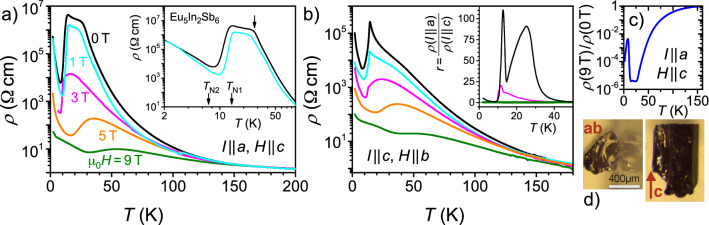
The intermetallic compound Eu[Formula: see text]In[Formula: see text]Sb[Formula: see text], an antiferromagnetic material with nonsymmorphic crystalline structure, is investigated by magnetic, electronic transport and specific heat measurements. Being a Zintl phase, insulating behavior is expected. Our thermodynamic and magnetotransport measurements along different crystallographic directions strongly indicate polaron formation well above the magnetic ordering temperatures. Pronounced anisotropies of the magnetic and transport properties even above the magnetic ordering temperature are observed despite the Eu[Formula: see text] configuration which testify to complex and competing magnetic interactions between these ions and give rise to intricate phase diagrams discussed in detail. Our results provide a comprehensive framework for further detailed study of this multifaceted compound with possible nontrivial topology.
© 2023. The Author(s).
Conflict of interest statement
The authors declare no competing interests.
Figures


Similar articles
-
Linear magnetoelastic coupling and magnetic phase diagrams of the buckled-kagomé antiferromagnet [Formula: see text].Sci Rep. 2022 May 5;12(1):7383. doi: 10.1038/s41598-022-11368-5. Sci Rep. 2022. PMID: 35513475 Free PMC article.
-
Development of short and long-range magnetic order in the double perovskite based frustrated triangular lattice antiferromagnet Ba[Formula: see text]MnTeO[Formula: see text].Sci Rep. 2021 Mar 26;11(1):6959. doi: 10.1038/s41598-021-84876-5. Sci Rep. 2021. PMID: 33772050 Free PMC article.
-
Complex magnetic properties associated with competing local and itinerant magnetism in [Formula: see text].Sci Rep. 2021 Jun 24;11(1):13245. doi: 10.1038/s41598-021-90751-0. Sci Rep. 2021. PMID: 34168172 Free PMC article.
-
Effect of Gd and Cr substitution on the structural, electronic and magnetic phases of SrRuO3: a case study of doping and chemical phase separation.J Phys Condens Matter. 2017 Dec 13;29(49):495803. doi: 10.1088/1361-648X/aa9728. J Phys Condens Matter. 2017. PMID: 29087361
-
Nuclear and magnetic spin structure of the antiferromagnetic triangular lattice compound LiCrTe2 investigated by [Formula: see text]SR, neutron and X-ray diffraction.Sci Rep. 2022 Dec 15;12(1):21657. doi: 10.1038/s41598-022-25921-9. Sci Rep. 2022. PMID: 36522382 Free PMC article.
References
-
- Ziese M, Thornton MJ, editors. Spin Electronics. Springer; 2001.
-
- Coey JMD, Viret M, von Molnár S. Mixed-valence manganites. Adv. Phys. 1999;48:167–293. doi: 10.1080/000187399243455. - DOI
-
- Kivelson SA, et al. How to detect fluctuating stripes in the high-temperature superconductors. Rev. Mod. Phys. 2003;75:1201–1241. doi: 10.1103/RevModPhys.75.1201. - DOI
Grants and funding
LinkOut - more resources
Full Text Sources
