. 2023 Apr;33(4):424-441.
doi: 10.1002/hipo.23505. Epub 2023 Jan 28.

Neuroligin-2 controls the establishment of fast GABAergic transmission in adult-born granule cells

Affiliations

Neuroligin-2 controls the establishment of fast GABAergic transmission in adult-born granule cells

Ayelén I Groisman et al. Hippocampus. 2023 Apr.

Abstract

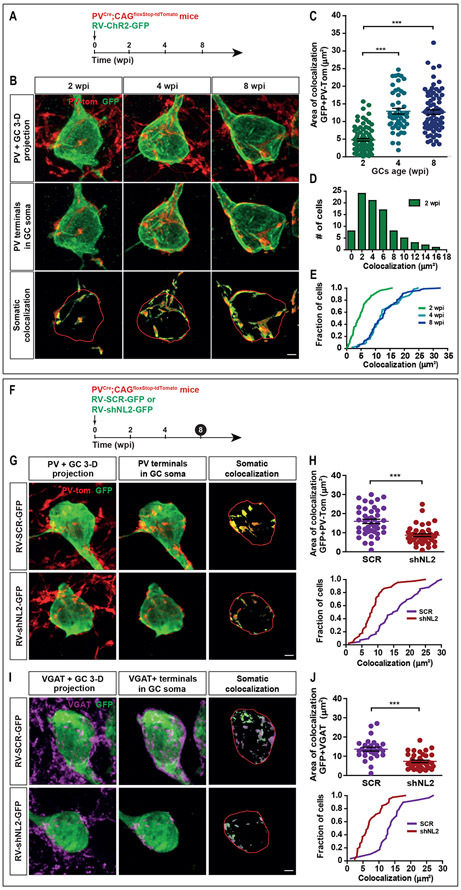
GABAergic inhibition is critical for the precision of neuronal spiking and the homeostatic regulation of network activity in the brain. Adult neurogenesis challenges network homeostasis because new granule cells (GCs) integrate continuously in the functional dentate gyrus. While developing, adult-born GCs undergo a transient state of enhanced excitability due to the delayed maturation of perisomatic GABAergic inhibition by parvalbumin interneurons (PV-INs). The mechanisms underlying this delayed synaptic maturation remain unknown. We examined the morphology and function of synapses formed by PV-INs onto new GCs over a 2-month interval in young adult mice, and investigated the influence of the synaptic adhesion molecule neuroligin-2 (NL2). Perisomatic appositions of PV-IN terminals onto new GCs were conspicuous at 2 weeks and continued to grow in size to reach a plateau over the fourth week. Postsynaptic knockdown of NL2 by expression of a short-hairpin RNA (shNL2) in new GCs resulted in smaller size of synaptic contacts, reduced area of perisomatic appositions of the vesicular GABA transporter VGAT, and the number of presynaptic active sites. GCs expressing shNL2 displayed spontaneous GABAergic responses with decreased frequency and amplitude, as well as slower kinetics compared to control GCs. In addition, postsynaptic responses evoked by optogenetic stimulation of PV-INs exhibited slow kinetics, increased paired-pulse ratio and coefficient of variation in GCs with NL2 knockdown, suggesting a reduction in the number of active synapses as well as in the probability of neurotransmitter release (Pr ). Our results demonstrate that synapses formed by PV-INs on adult-born GCs continue to develop beyond the point of anatomical growth, and require NL2 for the structural and functional maturation that accompanies the conversion into fast GABAergic transmission.

Keywords: adult neurogenesis; dentate gyrus; excitability; interneurons; neural development; plasticity; synaptogenesis.


Conflict of interest statement

CONFLICT OF INTEREST

The authors declare that they have no competing interests.

Figures

Figure 1.
Figure 1.. Perisomatic inhibition by PV-INs onto adult-born GCs revealed by confocal imaging.
Images display 8 wpi GCs labeled with RV-ChR2-GFP in PVCre;CAGfloxStop-tdTomato mice. (A) Left panel, Confocal projections of the dentate gyrus highlighting adult-born GCs (green) and PV-INs (red) intermingled within the GCL. Scale bar: 50 μm. Right panels, images displaying single optical sections of PV-IN terminals surrounding GC somas labeled with DAPI (cyan). Scale bar: 10 μm. (B) Image displaying PV-INs and VGAT immunofluorescence (cyan) in the GCL. Scale bar: 50 μm. Right panels, single confocal planes displaying VGAT and PV-IN terminals surrounding GC somas. Scale bar: 10 μm. (C) Images displaying single optical sections of PV-IN terminals colocalizing with VGAT (cyan) throughout the GCL. Note that both PV-INs and VGAT labels display colocalization sites around the GFP-labeled soma (arrows). Scale bar: 5 μm. (D) Three-dimensional reconstruction of an adult-born GC soma surrounded by PV-IN terminals colocalizing with VGAT (top panels). Orthogonal projections (bottom panels) reveal colocalization of PV-INs terminals, VGAT, and a GFP-labeled GC (arrow). Scale bars: 2 μm. ML: molecular layer.
Figure 2.
Figure 2.. Perisomatic synaptogenesis in newborn GCs requires NL2.
(A) Experimental design. GCs expressing RV-ChR2-GFP in PVCre;CAGfloxStoptdTomato mice were analyzed at the indicated times post injection. (B) Representative 3-D reconstructions of individual adult-born GCs at 2, 4 and 8 wpi (green) surrounded by PV-IN projections (red). Middle panels show processed images depicting the appositions of PV-IN terminals onto the cell soma. Bottom panels show optimized projections after plane-by-plane detection of PV-IN and GC colocalization. Scale bar: 2μm. (C) Projected area of colocalization between GC somas and PV-IN terminals at different ages. Dots represent individual neurons. (***) denote p < 0.001 after Kruskal-Wallis’ test followed by Dunn’s post hoc. (D) Distribution of overlap areas between PV-Tom and GFP for 2 wpi GCs. (E) Cumulative distributions corresponding to values displayed in (C). (F) Experimental design. New GCs labeled with RV-SCR-GFP or RV-shNL2-GFP in PVCre;CAGfloxStoptdTomato mice were studied at 8 wpi. (G) Representative 3-D reconstructions of individual GCs expressing SCR-GFP (top panels) or shNL2-GFP (bottom panels) surrounded by PV-IN projections (red). Middle columns show processed images depicting the appositions of PV-IN terminals onto the cell soma. Right columns show optimized projections after plane-by-plane detection of PV-IN and GC colocalization. Scale bar: 2 μm. (H) Top panel: Projected area of colocalization between GC somas and PV-IN terminals for SCR and shNL2. (***) denote statistical comparisons done using Mann-Whitney’s test with p < 0.001. Bottom panel: cumulative distribution of colocalization area in SCR and shNL2 cells. (I) Three-dimensional reconstructions of individual GCs expressing SCR-GFP or shNL2-GFP surrounded by VGAT immunofluorescence (cyan). Scale bar: 2 μm. (J) Area of somatic apposition of VGAT terminals (top panels) and cumulative distribution (bottom panel). (***) denote p < 0.001 after Mann-Whitney’s test. Sample sizes are N = 85 for 2 wpi GFP-GCs (4 mice), N = 45 for 4 wpi GFP-GCs (4 mice), N = 29 - 80 for 8 wpi GFP-GCs (4 mice), N = 29 - 72 for SCR-GCs (8 mice), and N = 38 - 82 for shNL2-GCs (8 mice). Horizontal bars denote mean ± SEM.
Figure 3.
Figure 3.. NL2 knockdown impairs spontaneous GABAergic transmission at proximal synapses.
(A) Experimental scheme. Adult-born GCs were labeled using RV-GFP or RV-shNL2-GFP. Whole-cell recordings were carried out at 6 wpi in the presence of APV (100 μM) and DNQX (20 μM) at VHOLDING = −70 mV, to detect proximal sIPSCs. (B) Representative sIPSC recordings performed in GCs expressing GFP, shNL2-GFP or unlabeled (outer third of the GCL). Scale bars: 100 pA, 5 s. (C) sIPSC frequency. Dots correspond to individual neurons. (D) Examples of normalized sIPSCs to highlight differences in kinetics. Traces depict normalized individual sweeps (gray) and their average (colored) corresponding to single neurons. Scale bars: 0.2 a.u., 25 ms. (E, F) sIPSC amplitude and rise time. Dots correspond to individual neurons. (G) Experimental scheme for distal sIPSC recordings at VHOLDING = 0 mV. (H) Representative sIPSC recordings performed in GCs expressing GFP, shNL2-GFP or unlabeled (outer third of the GCL). Scale bars: 20 pA, 5 s. (I) sIPSC frequency. (J) Examples of normalized sIPSCs corresponding to individual neurons. Scale bars: 0.2 a.u, 100 ms. (K, L) sIPSC amplitude and rise time. Sample sizes are N = 23 GFP GCs (7 mice), N = 16 shNL2 GCs (7 mice), and N = 21 unlabeled GCs (10 mice). Bars denote mean ± SEM. (*), (**) and (***) denote p < 0.05, p < 0.01 and p < 0.001 after Mann-Whitney’s test.
Figure 4.
Figure 4.. Altered presynaptic properties of perisomatic contacts onto new GCs with reduced NL2 expression revealed by evoked transmission.
(A) Experimental scheme. PVCre;CAGfloxStopChR2 mice received RV-SCR-GFP or RV-shNL2-GFP to label adult-born GCs. Responses (eIPSCs) were evoked by single laser pulses (0.2 ms, blue marks) delivered at 0.07 Hz in the presence of APV (100 μM) and DNQX (20 μM). Whole-cell recordings were carried out in 6 wpi GCs at VHOLDING= −70 mV. (B) Representative recordings in new GC expressing SCR-GFP, shNL2-GFP, or unlabeled (outer third of the GCL). Traces depict individual sweeps (gray) and their average (colored). Scale bars: 50 pA, 50 ms. (C, D) eIPSCs rise and decay time. Dots correspond to individual neurons. (E) Proximal eIPSCs peak amplitude. (F) Coefficient of variation CV2 = (σ/m)2; σ and m are the standard deviation and mean eIPSC amplitude for each cell. (G) CV2 vs eIPSC amplitude for shNL2 and SCR, suggesting higher Pr for the larger events. A significant Spearman correlation (p < 0.001) between CV2 and the eIPSC amplitude was obtained for both datasets together (shNL2 + SCR). The global dataset was fitted to a single exponential decay (y=y0.exτ, with y0 = 0.35, τ = 45.7 pA), denoted by a dotted line. (H) Experimental scheme for responses evoked by pulse trains (5 pulses at 20 Hz) delivered at 0.03 Hz. (I) Representative recordings obtained from GCs expressing SCR- GFP or shNL2-GFP. Scale bars: 100 pA, 100 ms. (J) Normalized charge for eIPSCs in response to the entire train. (K) Individual paired pulse ratio (PPR) measured as the peak amplitude of each pulse response and normalized to the first pulse of each train. Sample sizes are N = 12 for SCR (7 mice), N = 15 for shNL2 (9 mice) and N = 13 unlabeled (9 mice). Bars denote mean ± SEM. (*) and (**) denote p < 0.05 and p < 0.01 after Mann-Whitney’s test.
Figure 5.
Figure 5.. Unaltered GABAergic transmission at distal dendrites in new GCs with NL2 knockdown.
(A) Experimental scheme. Adult-born GCs were labeled using RV-GFP, RV-SCR-GFP or RV-shNL2-GFP. Distal dendritic responses (eIPSCs) were evoked by electrical stimulation of the outer molecular layer (0.2 ms) at 0.07 Hz in the presence of APV (100 μM) and DNQX (20 μM). Whole-cell recordings were carried out in 6 wpi GCs at VHOLDING = −30 mV. (B) Example traces show responses blocked by PTX (100 μM) in a 6 wpi GC expressing SCR-GFP. Scale bars: 25 pA, 50 ms. (C) Representative recordings in new GC expressing SCR-GFP, shNL2-GFP, or unlabeled (outer third of the GCL). Traces depict normalized sweeps (gray) and their average (colored). Scale bars: 50 pA, 50 ms. (D) Distal eIPSC peak amplitude, rise and decay times. Dots correspond to individual neurons. Sample sizes are N = 20 for SCR (6 mice), N = 13 for shNL2 (7 mice) and N = 9 unlabeled (6 mice). Bars denote mean ± SEM. Statistical comparisons revealed no differences among the groups.

References

    1. Ali H, Marth L, & Krueger-Burg D (2020). Neuroligin-2 as a central organizer of inhibitory synapses in health and disease. Sci Signal, 13(663). doi: 10.1126/scisignal.abd8379 - DOI - PubMed
    1. Alvarez DD, Giacomini D, Yang SM, Trinchero MF, Temprana SG, Buttner KA, … Schinder AF (2016). A disynaptic feedback network activated by experience promotes the integration of new granule cells. Science, 354(6311), 459–465. doi: 10.1126/science.aaf2156 - DOI - PubMed
    1. Babaev O, Botta P, Meyer E, Muller C, Ehrenreich H, Brose N, … Krueger-Burg D (2016). Neuroligin 2 deletion alters inhibitory synapse function and anxiety-associated neuronal activation in the amygdala. Neuropharmacology, 100, 56–65. doi: 10.1016/j.neuropharm.2015.06.016 - DOI - PubMed
    1. Bekkers JM, & Stevens CF (1990). Presynaptic mechanism for long-term potentiation in the hippocampus. Nature, 346(6286), 724–729. doi: 10.1038/346724a0 - DOI - PubMed
    1. Chancey JH, Adlaf EW, Sapp MC, Pugh PC, Wadiche JI, & Overstreet-Wadiche LS (2013). GABA depolarization is required for experience-dependent synapse unsilencing in adult-born neurons. J Neurosci, 33(15), 6614–6622. doi: 10.1523/JNEUROSCI.0781-13.2013 - DOI - PMC - PubMed

Publication types

LinkOut - more resources