

Spatiotemporal evolution of COVID-19 in Portugal's Mainland with self-organizing maps
- PMID: 36710328
- PMCID: PMC9884330
- DOI: 10.1186/s12942-022-00322-3
Spatiotemporal evolution of COVID-19 in Portugal's Mainland with self-organizing maps
Abstract
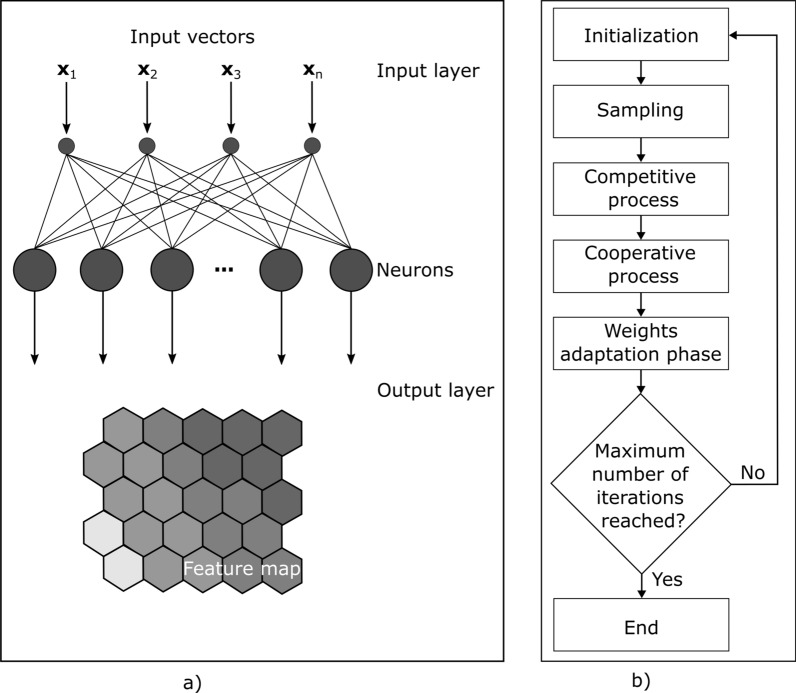
Background: Self-Organizing Maps (SOM) are an unsupervised learning clustering and dimensionality reduction algorithm capable of mapping an initial complex high-dimensional data set into a low-dimensional domain, such as a two-dimensional grid of neurons. In the reduced space, the original complex patterns and their interactions can be better visualized, interpreted and understood.
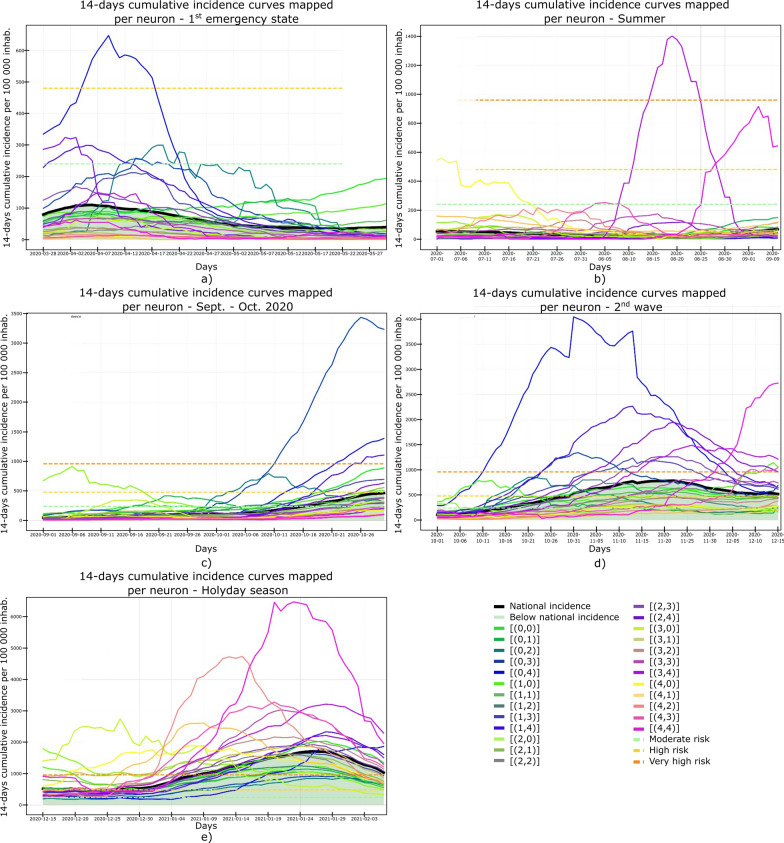
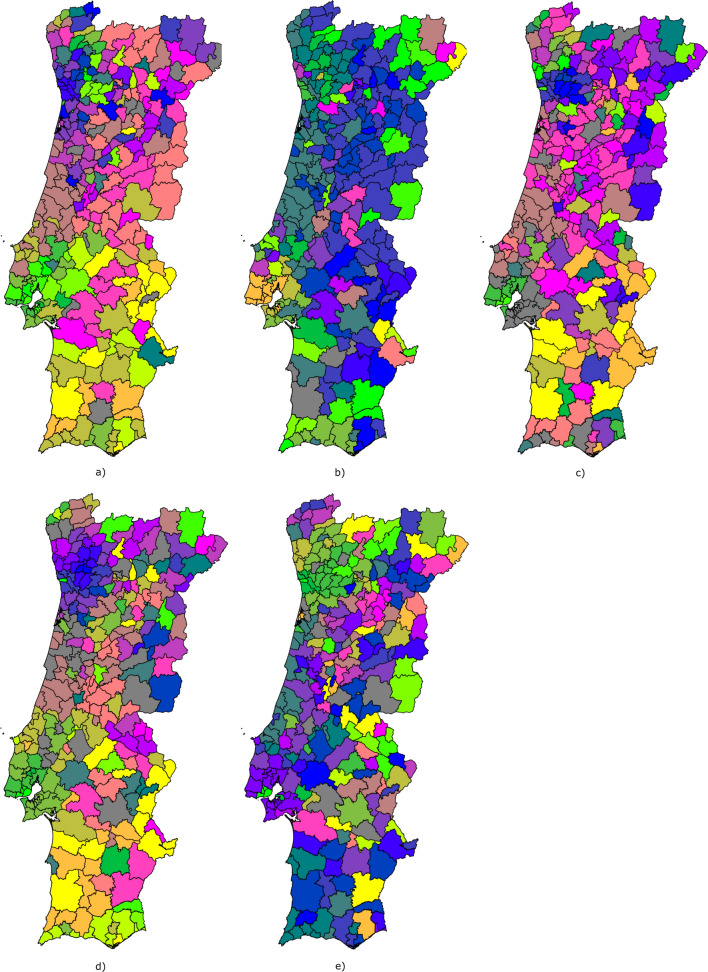
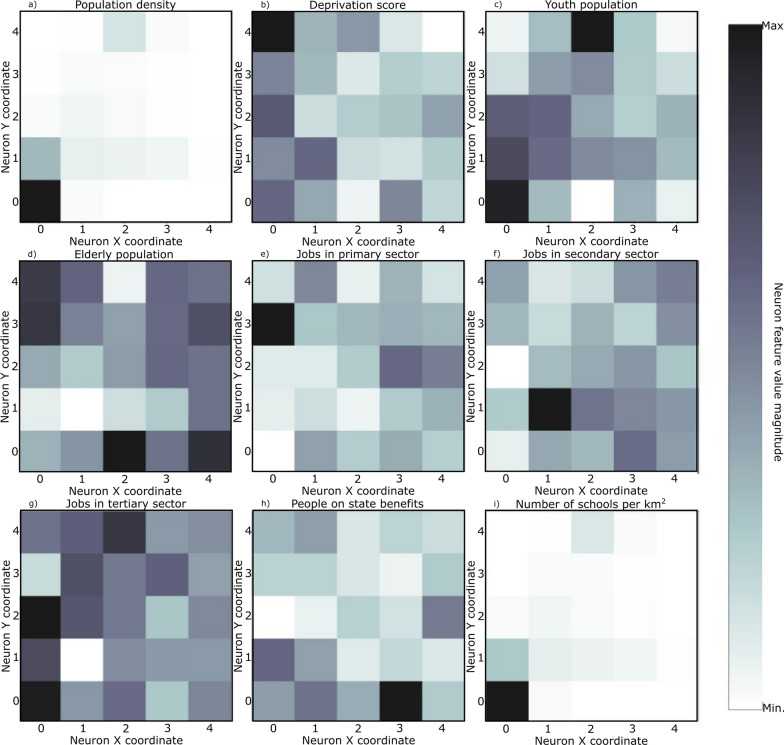
Methods: We use SOM to simultaneously couple the spatial and temporal domains of the COVID-19 evolution in the 278 municipalities of mainland Portugal during the first year of the pandemic. Temporal 14-days cumulative incidence time series along with socio-economic and demographic indicators per municipality were analyzed with SOM to identify regions of the country with similar behavior and infer the possible common origins of the incidence evolution.
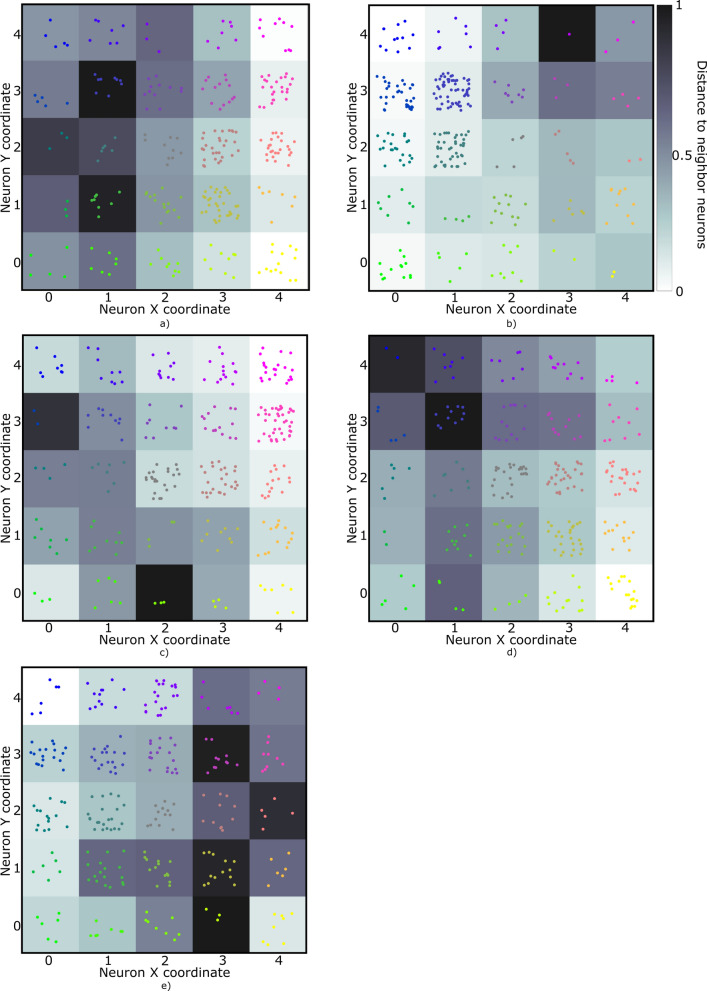
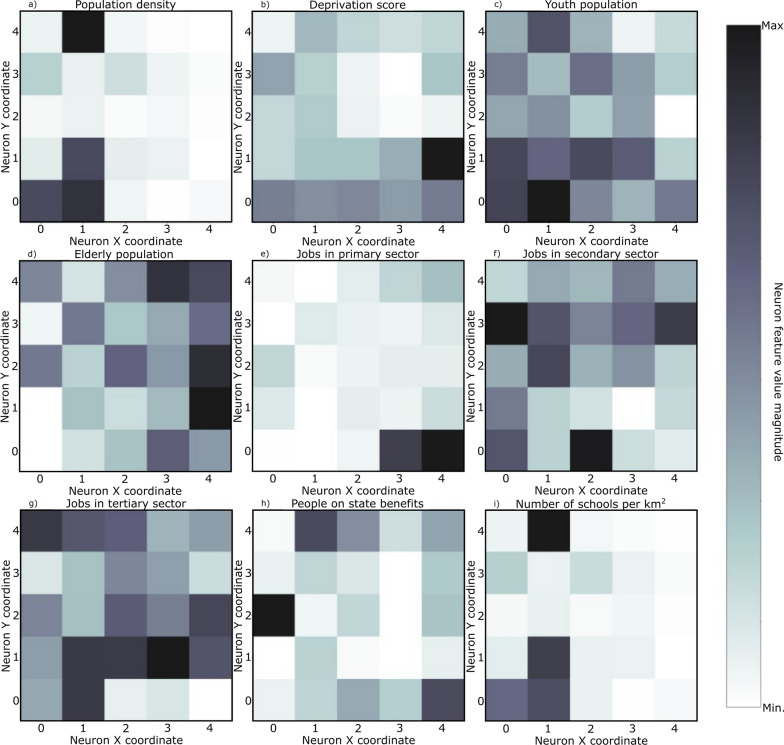
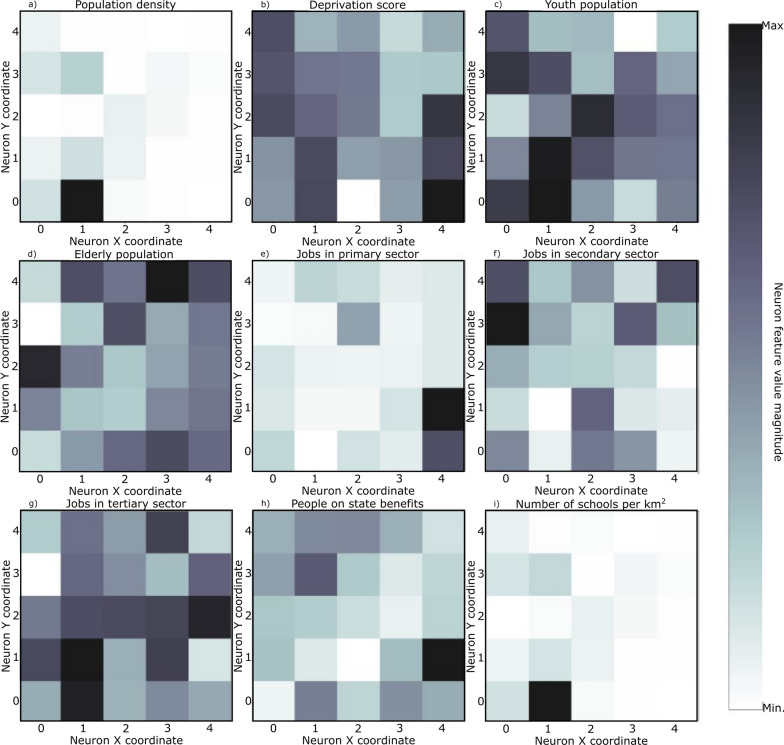
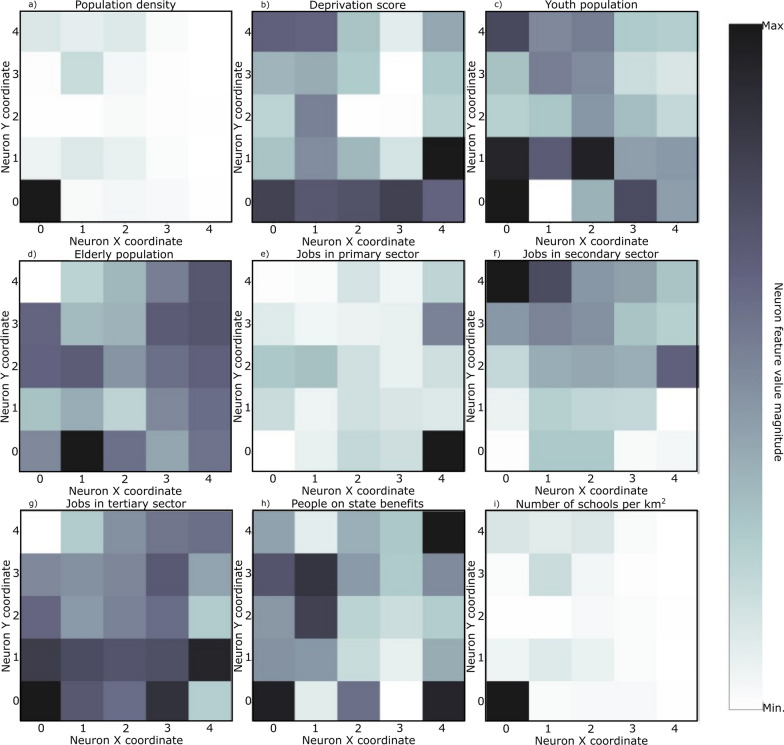
Results: The results show how neighbor municipalities tend to share a similar behavior of the disease, revealing the strong spatiotemporal relationship of the COVID-19 spreading beyond the administrative borders of each municipality. Additionally, we demonstrate how local socio-economic and demographic characteristics evolved as determinants of COVID-19 transmission, during the 1st wave school density per municipality was more relevant, where during 2nd wave jobs in the secondary sector and the deprivation score were more relevant.
Conclusions: The results show that SOM can be an effective tool to analysing the spatiotemporal behavior of COVID-19 and synthetize the history of the disease in mainland Portugal during the period in analysis. While SOM have been applied to diverse scientific fields, the application of SOM to study the spatiotemporal evolution of COVID-19 is still limited. This work illustrates how SOM can be used to describe the spatiotemporal behavior of epidemic events. While the example shown herein uses 14-days cumulative incidence curves, the same analysis can be performed using other relevant data such as mortality data, vaccination rates or even infection rates of other disease of infectious nature.
Keywords: COVID-19; Geo-Spatial Analysis; SARS-CoV-2; Self-organizing maps; Socio-economic determinants of disease.
© 2023. The Author(s).
Conflict of interest statement
The authors declare that they have no competing interests.
Figures


References
-
- World Health Organization (2020). Coronavirus disease 2019 (COVID-19): Situation Report, 52. WHO
-
- Greer SL, King E, Massard da Fonseca E, Peralta-Santos . A Coronavirus politics: The comparative politics and policy of COVID-19. Ann Arbor: University of Michigan Press; 2021.
Publication types
MeSH terms
LinkOut - more resources
Full Text Sources
Medical
Miscellaneous
