. 2023 Jan 30;42(1):35.
doi: 10.1186/s13046-022-02592-y.

Cancer-educated mammary adipose tissue-derived stromal/stem cells in obesity and breast cancer: spatial regulation and function

Affiliations

Cancer-educated mammary adipose tissue-derived stromal/stem cells in obesity and breast cancer: spatial regulation and function

Andreas Ritter et al. J Exp Clin Cancer Res. .

Abstract

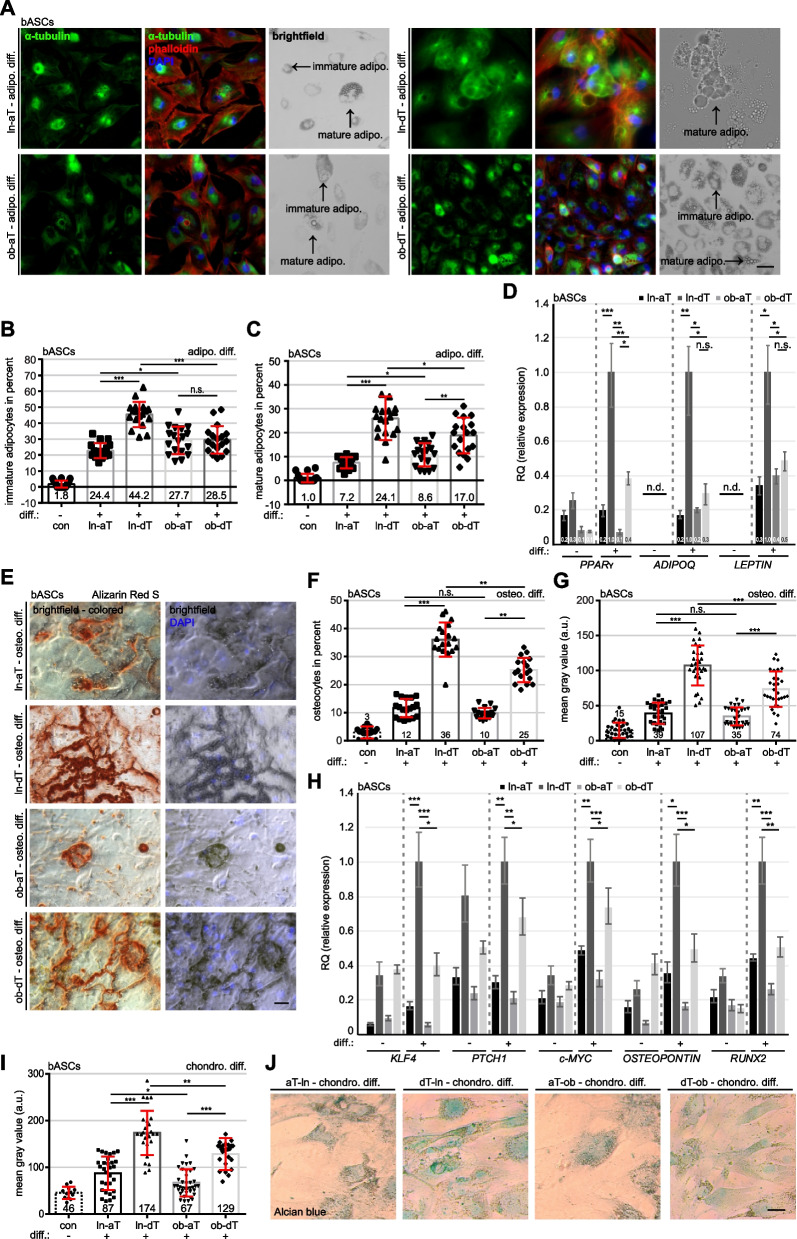
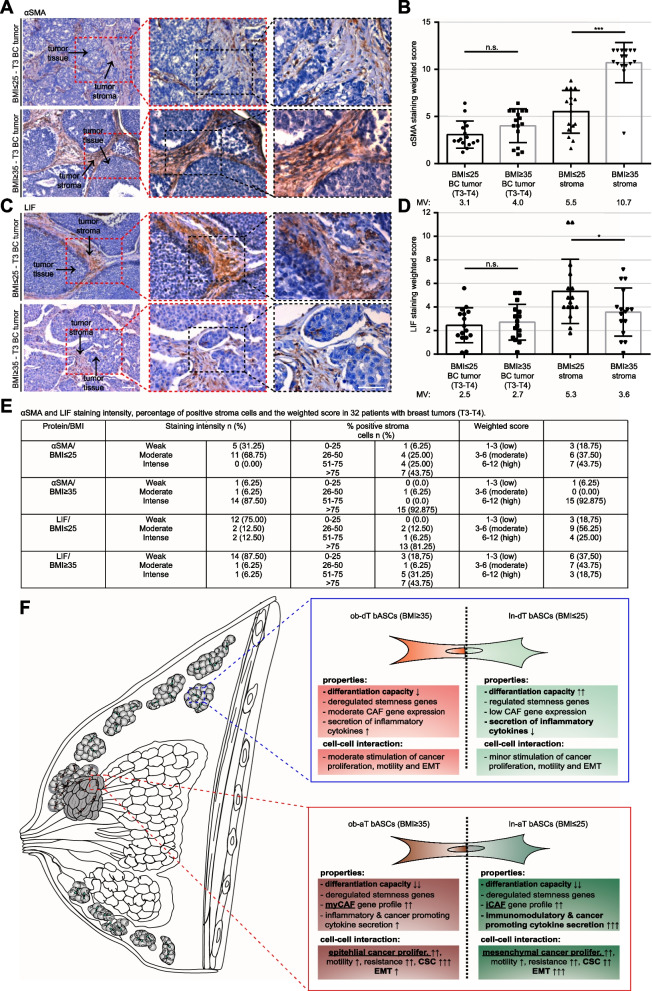
Background: Breast cancer is the most frequently diagnosed cancer and a common cause of cancer-related death in women. It is well recognized that obesity is associated with an enhanced risk of more aggressive breast cancer as well as reduced patient survival. Breast adipose tissue-derived mesenchymal stromal/stem cells (bASCs) are crucial components of the tumor microenvironment. A key step initially involved in this process might be the de-differentiation of bASCs into tumor supporting phenotypes.

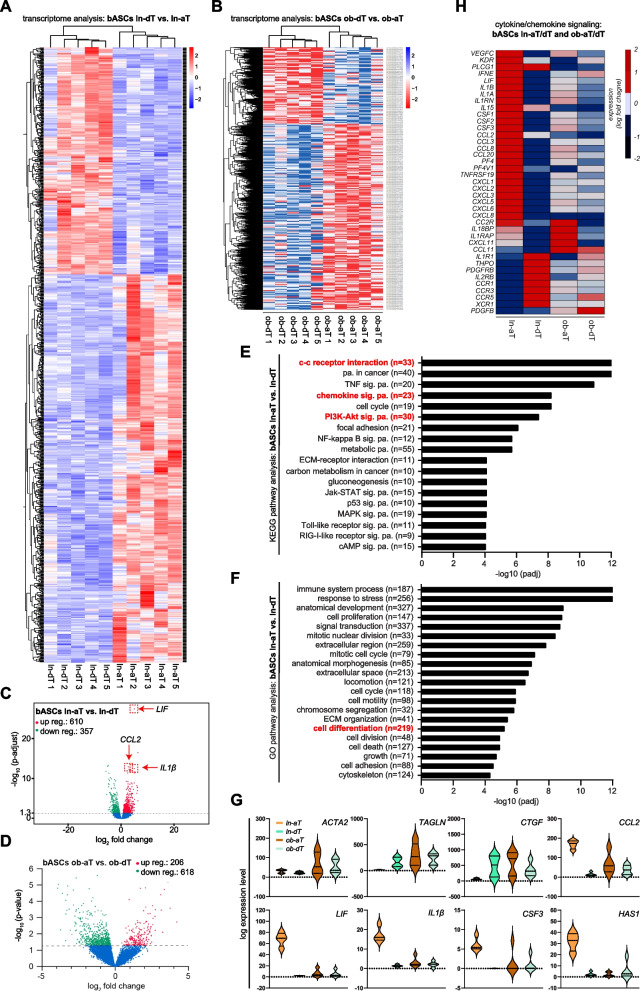
Methods: In the present work, we isolated bASCs from adipose tissues adjacent to the tumor (aT bASCs) from lean- (ln-aT bASCs, BMI ≤ 25) and breast cancer patients with obesity (ob-aT bASCs, BMI ≥ 35), and analyzed their phenotypes with functional assays and RNA sequencing, compared to their counterparts isolated from adipose tissues distant from the tumor (dT bASCs).

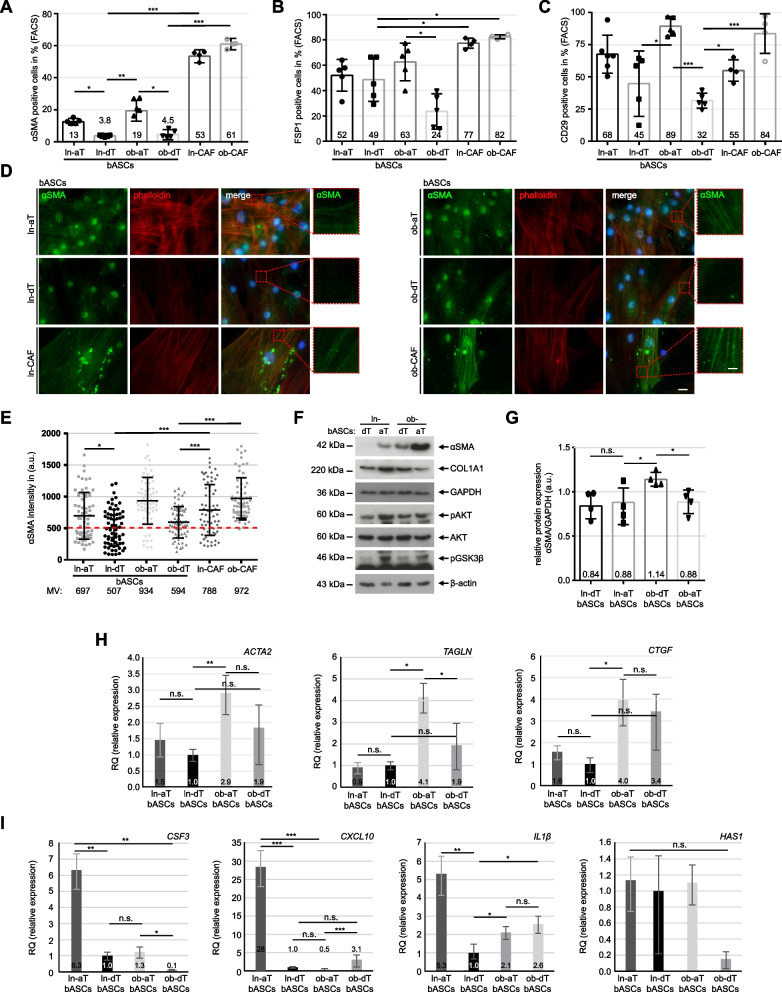
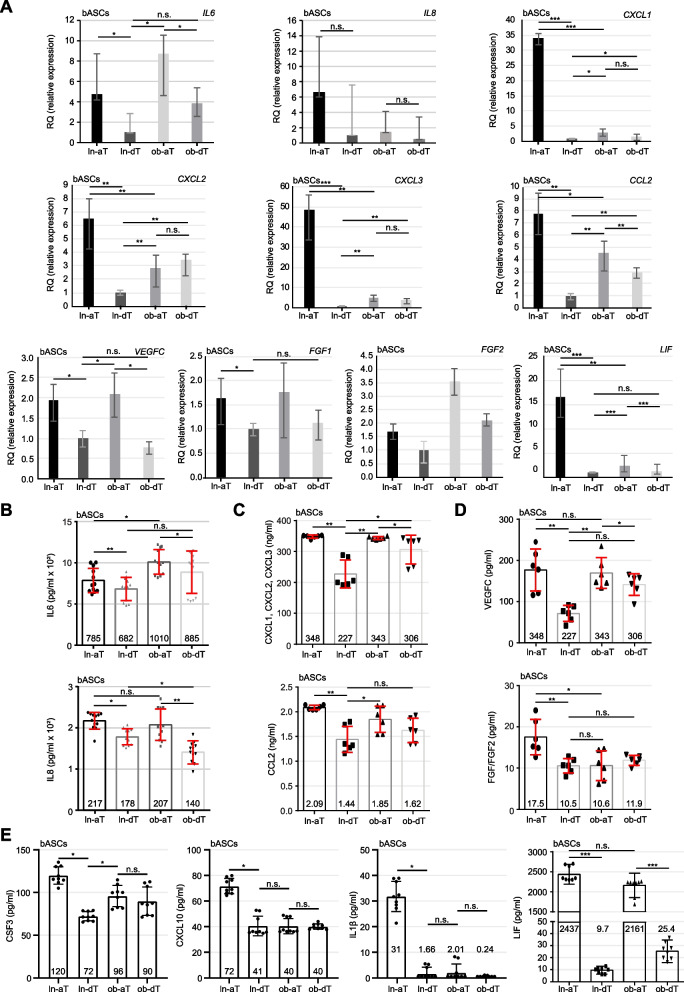
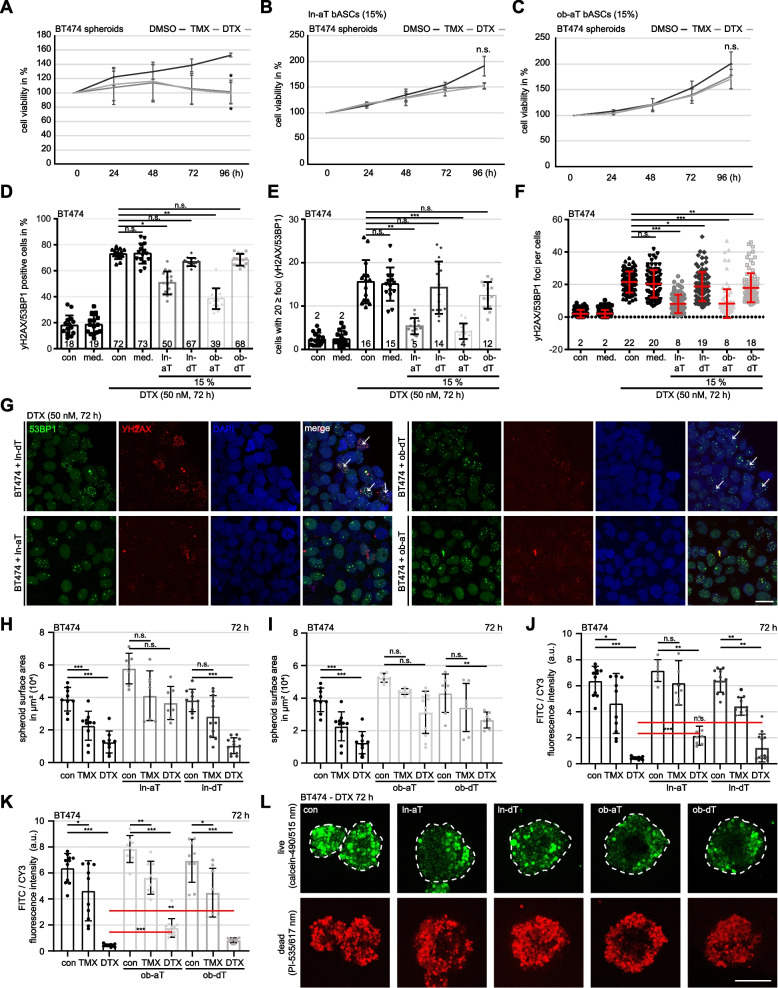
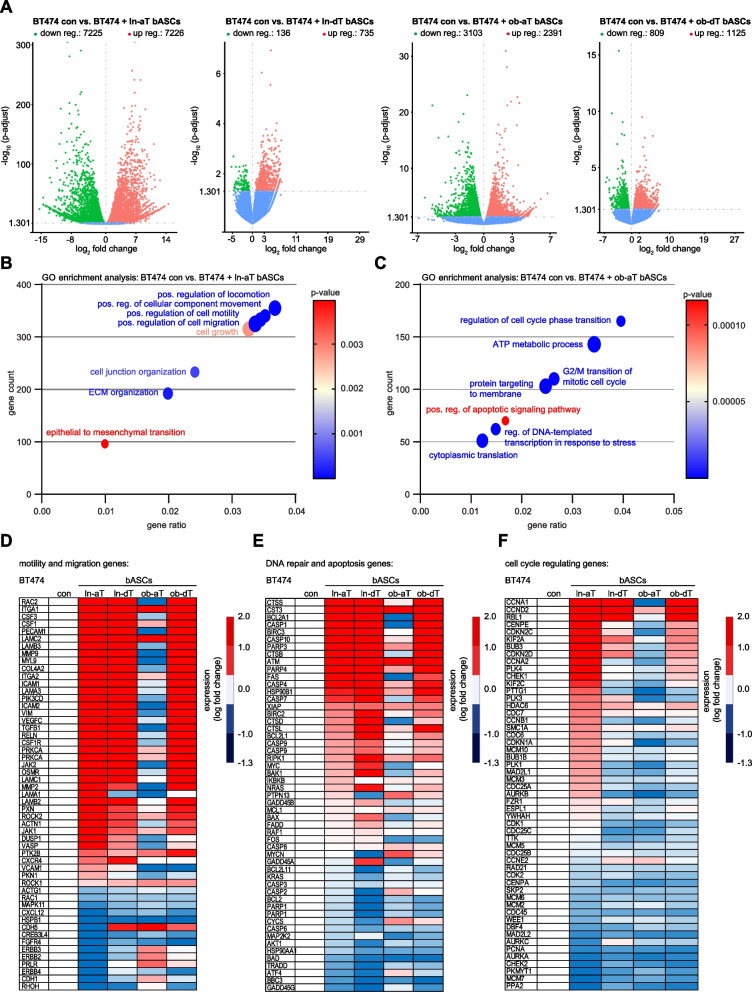
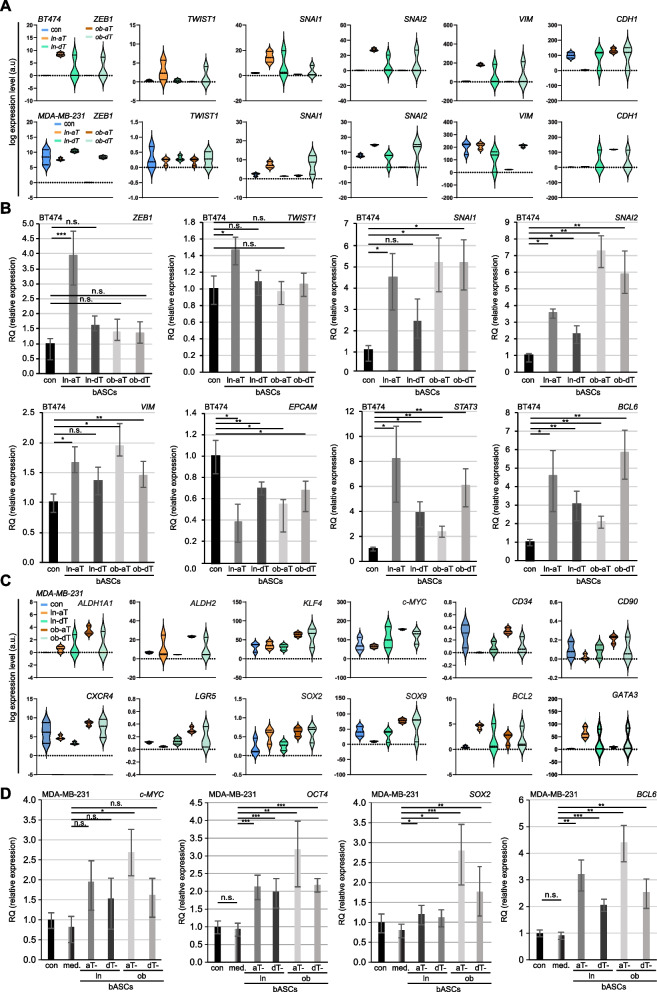
Results: We show that ln-aT bASCs are susceptible to be transformed into an inflammatory cancer-associated phenotype, whereas ob-aT bASCs are prone to be cancer-educated into a myofibroblastic phenotype. Both ln-aT- and ob-aT bASCs compromise their physiological differentiation capacity, and upregulate metastasis-promoting factors. While ln-aT bASCs stimulate proliferation, motility and chemoresistance by inducing epithelial-mesenchymal transition of low malignant breast cancer cells, ob-aT bASCs trigger more efficiently a cancer stem cell phenotype in highly malignant breast cancer cells.

Conclusion: Breast cancer-associated bASCs are able to foster malignancy of breast cancer cells by multiple mechanisms, especially, induction of epithelial-mesenchymal transition and activation of stemness-associated genes in breast cancer cells. Blocking the de-differentiation of bASCs in the tumor microenvironment could be a novel strategy to develop an effective intervention for breast cancer patients.

Significance: This study provides mechanistic insights into how obesity affects the phenotype of bASCs in the TME. Moreover, it highlights the molecular changes inside breast cancer cells upon cell-cell interaction with cancer-educated bASCs.

Keywords: Breast adipose tissue-derived mesenchymal stromal/stem cells; Breast cancer; Cancer stem cells; Cancer-associated fibroblasts; Chemoresistance; Epithelial-to-mesenchymal transition; Obesity; Tumor microenvironment.


Conflict of interest statement

The authors declare that they have no competing interests.

Figures

Fig. 1
Fig. 1
Lean and obese bASCs adjacent to breast cancer display an impaired differentiation capacity. A-J bASCs (ln-aT, ln-dT, ob-aT and ob-dT) were induced to adipogenic (adipo. Diff.) (A-D) for 14 days, osteogenic (osteo. Diff.) (E-H) and chondrogenic differentiation (chondro. Diff.) (I and J) for 21 days and their differentiation rates were evaluated. ln-dT bASCs were used as control cells without differentiation medium. A bASCs were stained for α-tubulin (green), phalloidin (red) to visualize the cytoskeleton, and DNA (DAPI, blue). Example images are shown. Scale bar: 50 μm. B and C The percentage of immature adipocytes (lipid vacuoles < 5 nm) (B) or mature adipocytes (lipid vacuoles > 5 nm) (C) was quantified. The results of individual bASC subgroups are presented as mean ± SEM (n = 500 cells for each condition, pooled from three experiments). D The gene expression of PPARγ, ADIPOQ and LEPTIN is shown for undifferentiated (−) and differentiated (+) bASCs. The results are from three individual experiments and presented as mean ± SEM. E bASCs were stained with Alizarin Red S to visualize calcium deposition. Representative images are shown. Scale bar: 50 μm. F and G The percentage of bASCs showing calcium deposition (F) and the mean gray value (G) were evaluated. The results are presented as mean ± SEM (F: n = 500 cells for each condition, pooled from three experiments, G: n = 30 images for each condition, pooled from three experiments). H The gene expression of KLF4, PTCH1, c-MYC, OSTEOPONTIN and RUNX2 is shown for undifferentiated (−) and differentiated (+) bASCs. The results are from three individual experiments and presented as mean ± SEM. I and J bASCs were stained with Alcian blue to visualize acidic polysaccharides. Representative bright-field images are shown (J). Scale bar: 50 μm. The quantification of the mean gray value is presented (I). The results are shown as mean ± SEM (n = 30 images for each condition, pooled from three experiments). Unpaired Mann-Whitney U test was used in (B and C), (F and G) and (I). ∗p < 0.05, ∗∗p < 0.01, ∗∗∗p < 0.001. Student’s t test was used in (D) and (H). ∗p < 0.05, ∗∗p < 0.01, ∗∗∗p < 0.001
Fig. 2
Fig. 2
The tumor microenvironment induces the de-differentiation of bASCs. A-C bASCs (ln-aT, ln-dT, ob-aT and ob-dT) were stained for αSMA, FSP1 and CD29 for FACS analyses. CAFs (ln-CAF and ob-CAF) were isolated and stained as positive controls. Quantification of αSMA (A), FPS1 (B) and CD29 (C) are shown as bar graphs. The results are from three independent experiments (n = 3, 60.000 cells for each condition and in each group) and presented as mean ± SEM. D Representative images of bASCs and CAFs stained for αSMA (green), phalloidin (red) and DNA (DAPI, blue) are shown. Red boxes indicate measured areas. Scale: 25 μm. Inset scale: 12.5 μm. E The evaluation of the mean fluorescence intensity of αSMA is presented as scatter plots. The results are from three independent experiments (n = 3, 90 cells for each condition and in each group) and presented as mean ± SEM. F Cellular extracts from bASCs were prepared for WB analysis with antibodies against αSMA, COL1A1, caveolin-1, AKT, pAKT and pGSK3β. GAPDH and β-actin served as loading controls. G Quantification of the αSMA signal in WB is shown, relative to the corresponding amount of GAPDH. The results are from three independent experiments and presented as mean ± SEM. H and I Relative gene levels of ACTA2, TAGLN and CTGF, important myCAF marker genes (H), and relative gene expression of CSF3, CXCL10, IL1β and HAS1, iCAF marker genes (I), are shown for bASC subgroups (ln-dT, ln-aT, ob-dT and ob-aT). The results are from three independent experiments and presented as bar graphs with mean ± SEM. Student’s t test was used in (A-C) and (G-I). Unpaired Mann-Whitney U test was used in (E). ∗p < 0.05, ∗∗p < 0.01, ∗∗∗p < 0.001. ∗p < 0.05, ∗∗∗p < 0.001
Fig. 3
Fig. 3
Transcriptomic profiles of lean and obese bASCs adjacent to breast cancers. A-G Total RNAs were extracted from each sample of bASC subgroups (ln-dT, ln-aT, ob-dT and ob-aT, 5 samples for each subgroup) for transcriptome analysis. A and B Heatmap of significantly differentially expressed genes of ln-dT vs. ln-aT bASCs (A) and ob-dT vs. ob-aT (B). Gene expression was analyzed using DESeq2 R package. Genes with a p-value < 0.01, and a fold change greater than 2 (red color code) and below − 2 (blue color code), respectively, were included. C and D Volcano plots showing the adjusted p-value (adj. p > 0.05) for genes differentially expressed between bASCs close to and distant to the breast cancers in lean (C) and obese (p > 0.05) (D) bASCs. Upregulated genes are depicted in red color, downregulated in green, and non-changed genes in blue (adjusted p-value > 0.05). E and F Significantly enriched KEGG pathways (E) and GO pathways (F) are presented for ln-aT bASCs compared to ln-dT bASCs. For each KEGG or GO pathway, the bar shows the adjusted p-value. The numbers (n) behind the pathway names indicate deregulated genes. G Violin plots present selected myCAF/iCAF genes differentially expressed. Values reflect the log expression levels of genes from the RNA-seq data. H Heatmap depicts significantly differentially expressed cytokine/chemokine genes in four bASCs subgroups. These genes have a fold change greater than 2 (red color code) or below − 2 (blue color code). Genes in (A-F) have an adjusted p-value of ≤0.05 and genes shown in (G) have an adjusted p-value of ≤0.05, at least for one condition (ln-aT or ob-aT)
Fig. 4
Fig. 4
bASCs adjacent to breast cancer cells have increased gene expression and protein secretion of cancer promoting cytokines. A Relative gene levels of IL6, IL8, CXCL1, CXCL2, CXCL3, CCL2, VEGFC, FGF1, FGF2, and LIF are shown for bASC subgroups (ln-dT, ln-aT, ob-dT and ob-aT). The results are from three independent experiments and presented as bar graphs with mean ± SEM. B-E ELISA assays were performed with conditioned media from bASCs subgroups and the levels of cytokines IL6 and IL8 (B), chemokines CXCL1–3 and CCL2 (C), growth factors VEGFC and FGF1/2 (D), and inflammatory cancer-associated cytokines CSF3, CXCL10, IL1β and LIF (E) were analyzed. The results are from three independent experiments and presented as scatter bar graphs with mean ± SEM. Student’s t test was used. ∗p < 0.05, ∗∗p < 0.01, ∗∗∗p < 0.001
Fig. 5
Fig. 5
Hybrid spheroids of breast cancer cells and ln-aT/ob-aT bASCs demonstrate an increased resistance to chemotherapeutic agents. A-C BT474 spheroids (A), BT474/ln-aT bASCs (B) and BT474/ob-aT bASCs (C) hybrid spheroids, generated for 24 h, were transferred into 96-well low attachment plates, treated with DMSO, TMX (5 μM) or DTX (50 nM) for up to 96 h. Cell viability was measured at indicated time points. The results are based on three independent experiments and presented as mean ± SEM. D-G Indicated spheroids were treated with 50 nM DTX for 72 h, stained for DNA damage markers γ-H2AX (red) and 53BP1 (green), and DNA (DAPI, blue). G Representatives are shown. White arrows indicate cell nuclei with 20 ≥ foci. Scale: 25 μm. D-F Quantification of γ-H2AX and 53BP1 double positive cells (D, n = 15 fields in each group), cells with 20 ≥ foci (E, n = 15 fields in each group) and double positive foci per cell (F, n = 90 cells in each group). H-L BT474- and hybrid spheroids were stained using the live/dead viability/cytotoxicity kit. Spheroid surface area (H and I, n = 7–11 fields in each group), and the ratio between the fluorescence intensity of viable cells (calcein/green) and the dead fraction (PI/red) (J and K, n = 7–12 fields in each group) were evaluated. The results are based on three independent experiments and presented as mean ± SEM. L Representative images of spheroids treated with DTX (50 nM) for 72 h are shown. White dotted lines depict the measured area of the spheroids. Scale: 250 μm. Student’s t test was used in (A-C). Unpaired Mann-Whitney U test was used in (D-F) and (H-K). *p < 0.05, **p < 0.01, ***p < 0.001
Fig. 6
Fig. 6
Transcriptome profiles of triple positive BT474 cells directly co-cultured with bASCs. A-F BT474 cells cultured for 14 days alone or in direct co-culture with different bASCs (ln/ob-dT/aT) were sorted for RNA-seq analysis (n = 3). The gene expression was analyzed using DESeq2 R package. A Volcano plots show the adjusted p-value for genes differentially expressed between control BT474 cells and BT474 cells directly co-cultured with ln-aT bASCs (1st volcano plot), ln-dT bASCs (2nd volcano plot), ob-aT bASCs (3rd volcano plot) and ob-dT bASCs (4th volcano plot). B and C GO enrichment analysis of RNA-seq data with a p-value ≤0.05. Gene count: the number of genes that are deregulated in the pathway. Gene ratio: ratio of the number of target genes divided by the number of all genes in each pathway. Significance is color coded as indicated (high p-value, red; low p-value, blue). D-F Heatmaps of deregulated genes involved in motility and migration (D), DNA repair and apoptosis (E), and cell cycle regulation (F). A fold change of ≥2 (red color code) and ≤ − 2 (blue color code) are shown. Included genes have a p-adjusted value of ≤0.05 for at least one condition (ln-aT or ob-aT)
Fig. 7
Fig. 7
ln-aT bASCs induce the EMT in BT474 cells, whereas ob-aT bASCs stimulate MDA-MB-231 cells into a CSC phenotype. A and C BT474 and MDA-MB-231 cells were directly co-cultured with different bASCs (ln-aT, ln-dT, ob-aT and ob-dT) and were sorted for RNA-seq. Three independent experiments were performed for this analysis. A Representative violin plots show selected EMT marker genes. Values represent the log expression levels of genes from the RNA-seq data. Included genes have an adjusted p-value of ≤0.05 for at least one condition (ln-aT or ob-aT). B Relative levels of EMT-associated genes, including TWIST1, ZEB1, SNAI1, SNAI2, VIM, EPCAM, STAT3 and BCL6, are shown for different bASC subgroups (ln-dT, ln-aT, ob-dT and ob-aT). The results are from three independent experiments and presented as bar graphs with mean ± SEM. C Representative violin plots show selected CSC marker genes. Values represent the log expression levels of genes from the RNA-seq data. Included genes have an adjusted p-value of ≤0.05 for at least one condition (ln-aT or ob-aT). D Relative gene levels of CSC-associated genes c-MYC, OCT4, SOX2 and BCL6 are shown for different bASC subgroups (ln-dT, ln-aT, ob-dT and ob-aT). The results are from three independent experiments and presented as bar graphs with mean ± SEM. Student’s t test was used. *p < 0.05, **p < 0.01, ***p < 0.001
Fig. 8
Fig. 8
Increased αSMA and LIF in the cancer stroma from obese and lean patients, respectively. A and C Formalin-fixed and paraffin-embedded (FFPE) T3/4 breast cancer tissue sections of lean (BMI ≤ 25) or obese (BMI ≥ 35) patients were immunohistochemically stained with LIF (C) or αSMA (A) antibody (brown), respectively, and counterstained with hematoxylin (blue). Scale: 100 μm. Inset I and II scale: 50 μm. B and D Quantification of the weighted score in breast cancer cells and tumor stroma for LIF (D) and αSMA (B). The results are presented as bar and scatter plots showing the mean value ± SEM (n = 32, 16 lean / 16 obese breast cancer tissues). Student’s t test was used. *p < 0.05, ***p < 0.001. E Table depicts LIF and αSMA staining intensity, percentage of positive tumor stroma and weighted score in 32 breast cancer tissue sections. F Schematic illustration of the proposed working model. The breast cancer TME has a crucial impact on the properties of bASCs and on their cell-cell interaction capacity. The de-differentiation process within the TME is highly dependent on the cellular context and is influenced by BMI of patients. Both cancer-educated bASCs phenotypes, iCAF and myCAF, have drastic impacts on breast cancer cells, leading to different tumor promoting profiles in low and high malignant cancer cells

References

    1. Malik VS, Willet WC, Hu FB. Nearly a decade on - trends, risk factors and policy implications in global obesity. Nat Rev Endocrinol. 2020;16(11):615–616. - PMC - PubMed
    1. Bixby H, Bentham J, Zhou B, Di Cesare M, Paciorek CJ, Bennett JE, Taddei C, Stevens GA, Rodriguez-Martinez A, Carrillo-Larco RM, et al. Rising rural body-mass index is the main driver of the global obesity epidemic in adults. Nature. 2019;569(7755):260. - PMC - PubMed
    1. Wang LM, Zhou B, Zhao ZP, Yang L, Zhang M, Jiang Y, Li YC, Zhou MG, Wang LH, Huang ZJ, et al. Body-mass index and obesity in urban and rural China: findings from consecutive nationally representative surveys during 2004-18. Lancet. 2021;398(10294):53–63. - PMC - PubMed
    1. Garcia-Estevez L, Cortes J, Perez S, Calvo I, Gallegos I, Moreno-Bueno G. Obesity and breast Cancer: a paradoxical and controversial relationship influenced by menopausal status. Front Oncol. 2021;11:705911. - PMC - PubMed
    1. Kim M, Lee C, Park J. Extracellular matrix remodeling facilitates obesity-associated cancer progression. Trends Cell Biol. 2022;32(10):825–834. - PubMed