. 2023 Jan 12:9:1048726.
doi: 10.3389/fmolb.2022.1048726. eCollection 2022.

Innate immunity mediator STING modulates nascent DNA metabolism at stalled forks in human cells

Affiliations

Innate immunity mediator STING modulates nascent DNA metabolism at stalled forks in human cells

Pavlo Lazarchuk et al. Front Mol Biosci. .

Abstract

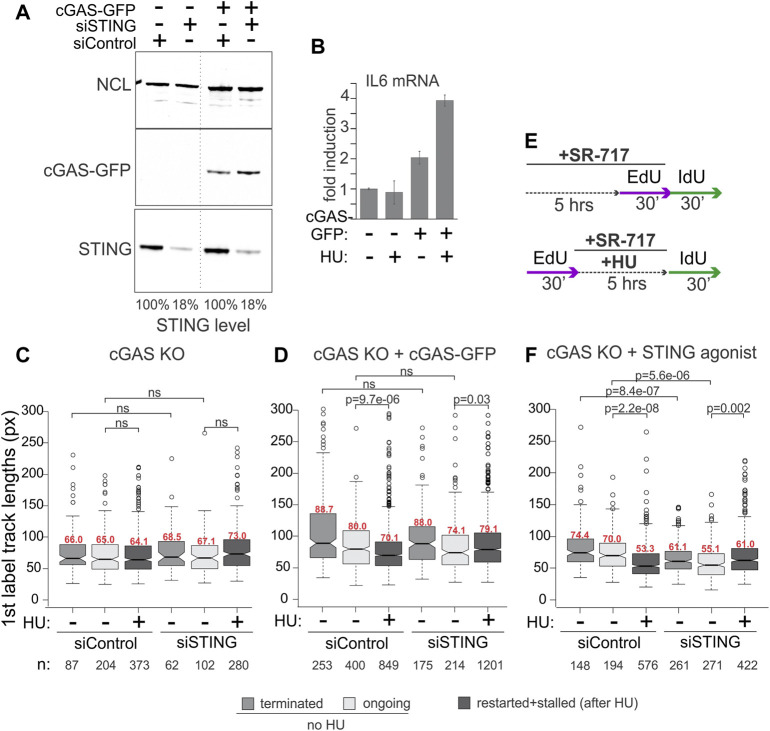
Background: The cGAS/STING pathway, part of the innate immune response to foreign DNA, can be activated by cell's own DNA arising from the processing of the genome, including the degradation of nascent DNA at arrested replication forks, which can be upregulated in cancer cells. Recent evidence raises a possibility that the cGAS/STING pathway may also modulate the very processes that trigger it, e.g., DNA damage repair or processing of stalled forks. Methods: We manipulated STING levels in human cells by depleting or re-expressing it, and assessed the effects of STING on replication using microfluidics-assisted replication track analysis, or maRTA, a DNA fiber assay, as well as immuno-precipitation of nascent DNA, or iPOND. We also assessed STING subcellular distribution and its ability to activate. Results: Depletion of STING suppressed and its re-expression in STING-deficient cancer cells upregulated the degradation of nascent DNA at arrested replication forks. Replication fork arrest was accompanied by the STING pathway activation, and a STING mutant that does not activate the pathway failed to upregulate nascent DNA degradation. cGAS was required for STING's effect on degradation, but this requirement could be bypassed by treating cells with a STING agonist. Cells expressing inactive STING had a reduced level of RPA on parental and nascent DNA of arrested forks and a reduced CHK1 activation compared to cells with the wild type STING. STING also affected unperturbed fork progression in a subset of cell lines. STING fractionated to the nuclear fractions enriched for structural components of chromatin and nuclear envelope, and furthermore, it associated with the chromatin of arrested replication forks as well as post-replicative chromatin. Conclusion: Our data highlight STING as a determinant of stalled replication fork integrity, thus revealing a novel connection between the replication stress and innate immune responses.

Keywords: STING; human; hydroxyurea; innate immunity; nascent DNA; replication.


Conflict of interest statement

The authors declare that the research was conducted in the absence of any commercial or financial relationships that could be construed as a potential conflict of interest.

Figures

FIGURE 1
FIGURE 1
STING fractionates into nuclear and cytoplasmic fractions. (A) A fractionation scheme and Western blots probed for the indicated proteins in the fractions derived from the untreated (left panel) and HU-treated (right panel) WI38 hTERT fibroblasts. HU treatment was with 5 mM HU for 5.5 h. (B) The same samples as in (A) were re-run and probed for the proteins ERp72, EMC1, Lamin A/C, and STING. The loaded amounts of chromatin pellet were increased two-fold compared to (A). A secondary band in the STING blot is STING degradation product. Here and elsewhere Western blot images are boxed to indicate the panels that were independently adjusted for brightness or come from separate protein gels.
FIGURE 2
FIGURE 2
STING depletion affects replication forks. (A) Experimental design for detection of NDD (left) and the categories of forks scored in untreated and HU-treated cells using this design (right). (B) A Western blot of siRNA-mediated depletion of STING in BRCA1-deficient ovarian cancer line UWB1.289. i.c., internal control. In his case, the WRN protein was used for i.c. (C) A boxplot of first label (IdU) track length distributions in terminated (ter) and ongoing (on) forks without HU, and in stalled (st) or restarted (res) forks after HU. The latter two categories were combined and plotted together since restarted forks were extremely rare at 30 min after HU in UWB1.289. (D) A boxplot of first label (CldU) track lengths in the terminated, ongoing, stalled, or restarted forks in UWB1.289. Cells were treated the same way as in (C) except SR-717 was added at 8 μM during the HU arrest in HU samples or for 5 h before the labeling in no-HU samples. All labeling times were 40 min. The results in (C,D) represent two independent experiments each. (E) A Western blot of siRNA-mediated depletion of STING in the SV40-transformed fibroblast line GM639. NCL, nucleolin, was used as i.c. (F) A boxplot of replication track length distributions of stalled or terminated forks in GM639 transfected with non-targeting and STING siRNAs. (G) A boxplot of replication track length distributions of ongoing or restarted forks in GM639 transfected with non-targeting and STING siRNAs. (F,G) represent two independent experiments. Here and elsewhere the track length measurements are in pixels (px on Y axes), and 1 pixel approximately equals .62 Kb. p values are derived in pairwise KS tests. Numbers of tracks (n) measured in each category are indicated beneath the graphs and median values (in red) of each distribution are shown above the boxes.
FIGURE 3
FIGURE 3
cGAS contributes to the activation of STING, which is required for STING effect on replication forks. (A) Depletion of STING and induction of cGAS-GFP expression in the cGAS knockout (KO) HeLa cells. Cells were transfected with the indicated siRNAs and in 24 h doxycycline was added to all cells (KO and complemented) at 400 ng/ml for another 16–24 h. A dotted line marks a spliced lane. (B) qPCR measurements of IL6 mRNA in cGAS KO and cGAS KO/cGAS-GFP HeLa incubated with doxycycline as in (A) to induce cGAS-GFP, and treated with 5 mM HU for 5 h. Error bars are standard deviations. (C,D) Boxplots of first label (EdU) track length distributions in doxycycline-treated cGAS KO cells (C) and cGAS KO + cGAS-GFP cells (D). The experimental design and HU treatment was as in Figure 2, and track length values in restarted and stalled forks after HU are combined due to the low fraction of restarted forks. The results represent two independent experiments. (E) A modification to the experimental design to include a STING agonist SR-717 treatment. (F) Boxplots of first label (EdU) track length distributions in cGAS KO cells with and without an incubation with SR-717 (4 μM). The results represent two independent experiments. p values in (C–F) are determined in KS tests.
FIGURE 4
FIGURE 4
Serine 358 to alanine mutation of STING disrupts its ability to activate and induce downstream transcriptional targets in response to exogenous DNA or replication arrest by HU. (A) A Western blot of re-expression of wild type STING, or its S358A mutant in A549 and U2OS. Cells were stably transfected with empty lentiviral vector pTRIP-SFFV-mtagBFP-2A (e.v.) or with the same vector expressing variants of STING (pTRIP-SFFV-mtagBFP-2A STING). Cells were flow-sorted for BFP expression, and several fractions were cultured and analyzed for STING expression to select populations with matching levels of the protein. Examples of the A549 selections are marked by asterisks. (B) qPCR measurements of IFNB1 mRNA induction in U2OS cells expressing STING or empty vector (e.v.) treated with 0, 2 or 4 mM HU for 6 h. (C) qPCR measurements of IL6 mRNA induction in U2OS cells expressing STING or empty vector (e.v.) treated with 0 or 4 mM HU for 6 h. (D) qPCR measurements of IFNB1 mRNA induction in U2OS cells expressing the indicated STING variants or empty vector, incubated with 5 mM HU for 6 h. (E,F) qPCR measurements of IFNB1 (E) or IL6 (F) mRNA induction in U2OS cells expressing the indicated STING variants or empty vector, and mock-transfected or transfected with interferon-stimulating DNA (ISD). qPCR results represent two independent experiments each. Error bars throughout are standard deviations. p values were calculated on ΔΔCq values in one-tailed two-sample t-tests. The color key [right of (F)] is common for (E,F). (G) Western blots of the fractionated extracts of U2OS cells expressing STING WT or S358A. Cells were transfected with ISD/poly dI/dC mix or mock-transfected and incubated for 6 h prior to harvest. The HU-treated samples, included for comparison, were incubated with 5 mM HU for 6 h. Blots were probed for ERp72, STING S366P, and STING. (H) Western blots of the fractionated extracts of U2OS cells expressing STING WT or S358A and probed for STING S366P and STING. Where indicated, HU treatment was for 5 h s at 5 mM. Note the higher exposure of STING S366P blots compared to those in (G) due to a lower S366P signal.
FIGURE 5
FIGURE 5
Activation of STING is important for its effect on degradation of nascent DNA. (A,B) Experimental design and boxplots of first label (IdU) track length distributions in terminated/stalled forks (left panels), or ongoing/restarted forks (right panels) in the A549 cells (A) and U2OS cells (B) expressing the indicated transgenes. The results represent two independent experiments each. p values are determined in KS tests. Median values of distributions are shown in red above the boxes. (C) Cliff’s delta values for the size of differences in unperturbed fork progression between empty vector and STING-expressing cells were calculated from six independent experiments each performed in U2OS and A549 cells. First label track lengths in ongoing forks were used for the calculation, and positive values correspond to longer tracks/faster fork progression in STING-expressing cells compared to the empty vector controls. Red lines are means. Gray circles identify the Cliff’s delta values derived from the experiments shown in (A,B). (D) A labeling scheme and examples of forks that incorporate trace IdU (are “active”) or do not incorporate any IdU (are “inactive”) in the presence of 5 mM HU. (E) A boxplot of first label (CldU) track length distributions in the “active in HU” forks in U2OS expressing the indicated transgenes. The results represent two independent experiments. p values were determined in KS tests. (F) Differences between first label (CldU) track length distributions in untreated vs. HU-treated cells with the indicated transgenes were quantified by calculating the respective Cliff’s delta values. Positive values correspond to longer tracks in untreated cells compared to HU-treated cells. Cliff’s delta values from two independent experiments (black and gray circles respectively) and their averages (triangles) were plotted.
FIGURE 6
FIGURE 6
STING affects the levels of RPA on parental and nascent DNA in HU-treated cells. (A) Examples of RPA32 to EdU PLA fluorescence in the control U2OS cells, treated as shown. Cells were labeled with EdU and harvested immediately or after a 5 h HU arrest, as shown by asterisks. Scale bar = 10 μm. (B) A schematic of the likely substrate for the RPA32/EdU PLA (red arc represents fluorescent signal) and representative distributions of RPA32/EdU PLA foci numbers in the U2OS cells with empty vector (e.v.) or the indicated STING transgenes. Cells were labeled as in (A) and EdU was Clicked to a mixture of biotin and Alexa488 azides at a molar ratio of 50:1 to enable simultaneous visualization of EdU-positive cells and PLA signals. PLA foci numbers are shown separately for EdU-negative (E−) and EdU-positive (E+) cells. Red lines are medians and their values are shown above the lines. p values were calculated in Wilcoxon tests. (C) Magnitudes of differences between RPA32/EdU PLA foci distributions in STING WT vs. control and STING S358A vs. control were calculated as Cliff’s delta values and plotted. Shown are Cliff’s delta values for each of four independent experiments performed and quantified as in (B). Each experiment is identifiable by fill tone of the circle symbols. Red triangles are means. Blue arrowheads identify the values derived from the experiment shown in (B). (D) Cliff’s delta values for two biological replicates of an experiment performed as in (B) and measuring RPA32/ssDNA PLA foci numbers. Likely substrates for the RPA32/ssDNA PLA are shown above the plot. (E) Distributions of RPA32 S33P/EdU PLA foci numbers in the U2OS cells with empty vector or the indicated STING transgenes. Cells were labeled with EdU and treated with HU as in (A). All samples are HU-treated. PLA foci numbers are shown separately for EdU-negative (E−) and EdU-positive (E+) cells. Red lines are medians and their values are shown above the lines. p values were calculated in Wilcoxon tests. (F) Cliff’s delta values calculated for RPA32 S33P/EdU PLA foci distributions in STING WT vs. control and STING S358A vs. control pairs in each of eight independent experiments performed and quantified as in (E) and identifiable by fill tone or fill pattern of the circle symbols. Triangle symbols are means. Blue arrowheads identify the values from the experiment shown in (E). (G) Cliff’s delta values calculated for differences of distributions of mean fluorescence intensities (MFI) per nucleus measured by IF in situ for RPA32 S33P in STING WT vs. control and STING S358A vs. control cells. MFI values were measured in EdU-positive, HU-arrested cells in three independent experiments. For all Cliff’s delta values, positive values mean that the values of the first distribution in the comparison (e.g., STING WT in the STING WT—e.v. comparison) are overall higher than those of the second distribution, and negative values mean that the reverse is true. Distribution medians are displayed as in (E).
FIGURE 7
FIGURE 7
CHK1 activation is affected by STING status. (A) A representative image of CHK1 S345P and EdU immunofluorescence in HU-treated (5 mM HU/5 h) and untreated U2OS expressing wild type STING. Cells were treated as in Figure 6A. MFI, mean fluorescence intensity, a.u, arbitrary units. Scale bar = 20 μm. (B) IF images of CHK1 S345P were generated for the HU-treated U2OS cells with the indicated transgenes, and CHK1 S345P signal intensity was quantified. Signal intensities are shown separately for EdU-negative (E−) and EdU-positive (E+) cells. Red lines are medians and their values are shown above the lines. p values were determined in KS tests. (C) Cliff’s delta values for MFI distribution differences between the indicated pairs of samples were calculated for two independent experiments with biological replicates (i.e., four sets total) quantified as in (A). Values derived for each set are identifiable by fill tone. Blue arrowheads identify the values from the experiment shown in (A). p values are determined in KS tests.
FIGURE 8
FIGURE 8
STING associates with chromatin in an immunoprecipitation of nascent DNA (iPOND) assay. (A) A schematic of EdU labeling, HU treatment, and sample preparation, and a Western blot of iPOND input and pulldown samples isolated from U2OS with the indicated transgenes or empty vector (e.v.), and probed with the STING and histone H3 (HH3) antibodies. Samples clicked with biotin azide: bio; mock-clicked samples: -. Dotted lines indicate different brightness settings and/or exposures of a Western blot image. (B) An EdU-labeling scheme and a Western blot of iPOND of samples of the same cells as in (A), probed for STING and histone H3. (A,B) represent two independent experiments each. (C) A model for STING effect on nascent strand degradation, NDD. A canonical pathway via the ER-bound, activated STING to the transcriptional upregulation and/or ROS-mediated responses is a possibility that has not been ruled out. However, our data are consistent with the existence of an inner nuclear membrane pool of STING that is activatable and can participate in the regulation of fork metabolism via association with lamina and chromatin, or, similarly to the ER STING, that facilitates upregulation of the activity and/or levels of nucleases. Green arrows indicate canonical mechanisms. Black arrows indicate the documented relationships that may be drawn upon to explain STING’s effect on NDD. Red arrows are the proposed novel mechanisms. Pacman symbols indicate nucleolytic processing of stalled forks. The model was generated with BioRender.

Similar articles

Cited by

References

    1. Alvarado-Cruz I., Mahmoud M., Khan M., Zhao S., Oeck S., Meas R., et al. (2021). Differential immunomodulatory effect of PARP inhibition in BRCA1 deficient and competent tumor cells. Biochem. Pharmacol. 184, 114359. 10.1016/j.bcp.2020.114359 - DOI - PMC - PubMed
    1. Bai J., Liu F. (2022). Nuclear cGAS: Sequestration and beyond. Protein Cell 13, 90–101. 10.1007/s13238-021-00869-0 - DOI - PMC - PubMed
    1. Bao K., Zhang Q., Liu S., Song N., Guo Q., Liu L., et al. (2022). LAP2α preserves genome integrity through assisting RPA deposition on damaged chromatin. Genome Biol. 23, 64. 10.1186/s13059-022-02638-6 - DOI - PMC - PubMed
    1. Berti M., Cortez D., Lopes M. (2020). The plasticity of DNA replication forks in response to clinically relevant genotoxic stress. Nat. Rev. Mol. Cell Biol. 21, 633–651. 10.1038/s41580-020-0257-5 - DOI - PubMed
    1. Bétous R., Pillaire M. J., Pierini L., van der Laan S., Recolin B., Ohl-Séguy E., et al. (2013). DNA polymerase κ-dependent DNA synthesis at stalled replication forks is important for CHK1 activation. Embo J. 32, 2172–2185. 10.1038/emboj.2013.148 - DOI - PMC - PubMed