[Preprint]. 2023 Jan 22:2023.01.22.525083.
doi: 10.1101/2023.01.22.525083.

RNA Polymerase II, the BAF remodeler and transcription factors synergize to evict nucleosomes

Affiliations

RNA Polymerase II, the BAF remodeler and transcription factors synergize to evict nucleosomes

Sandipan Brahma et al. bioRxiv. .

Update in

Abstract

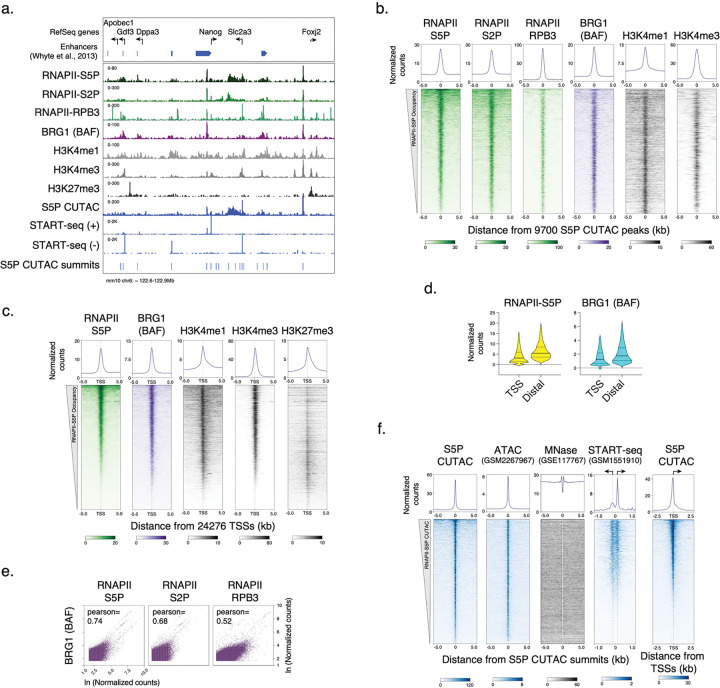
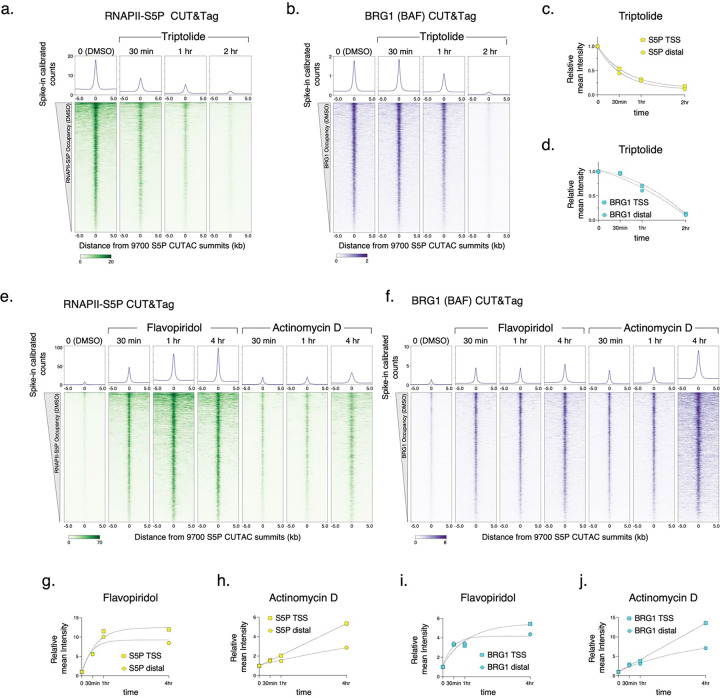
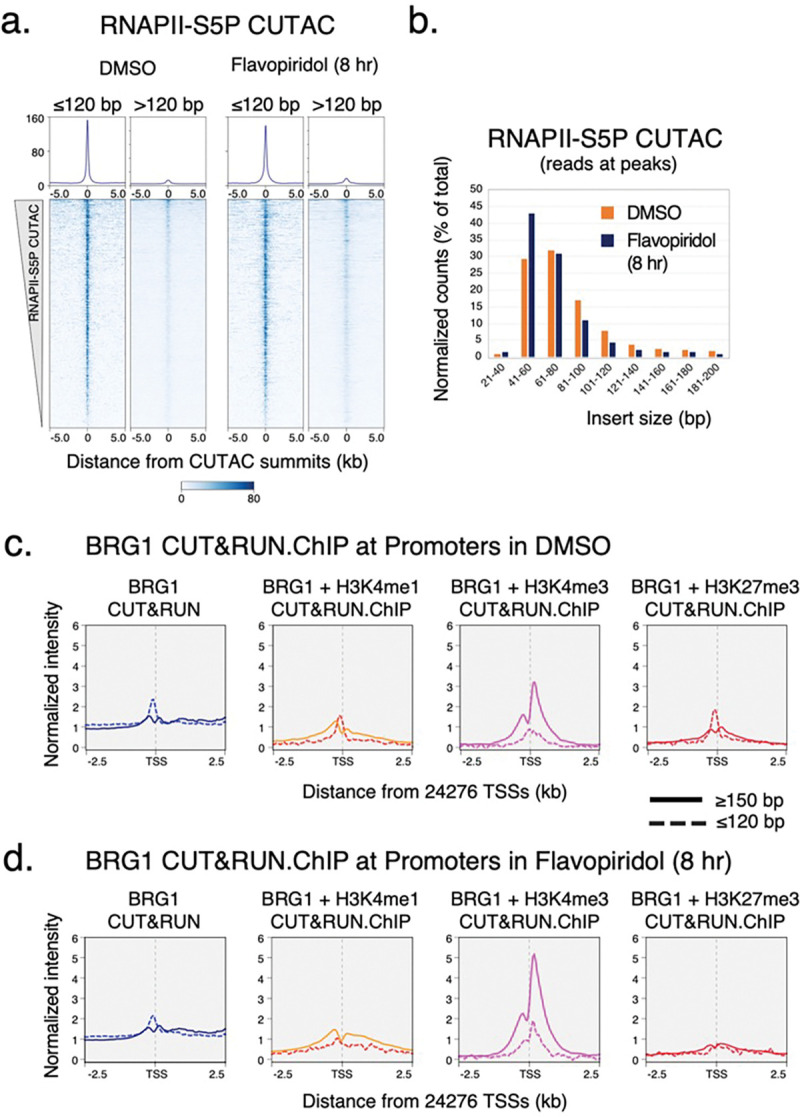
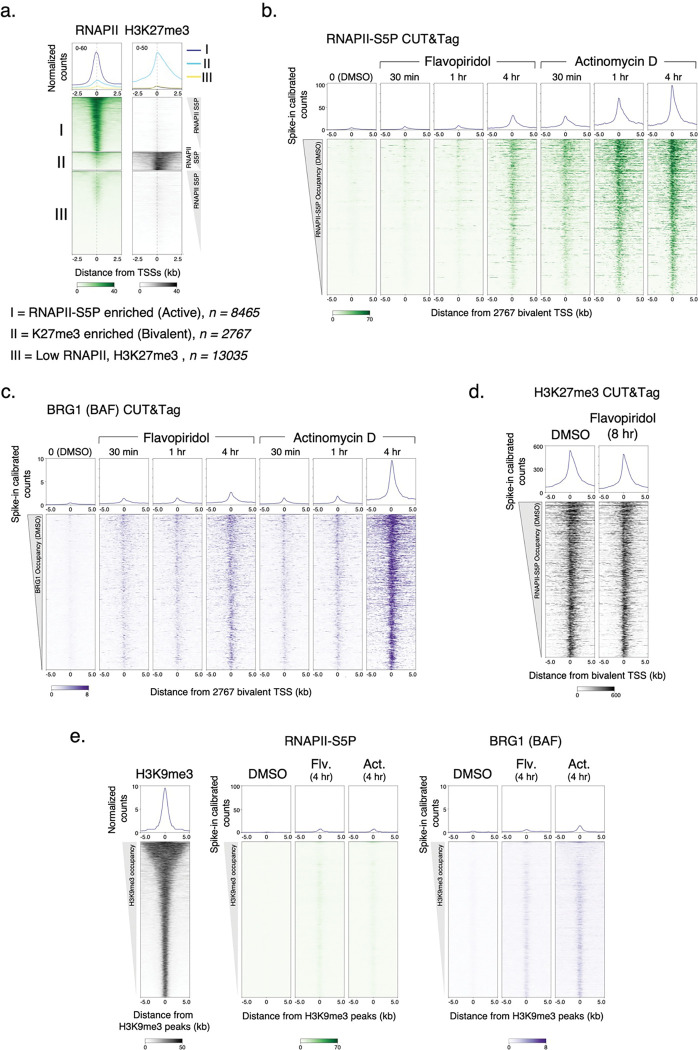
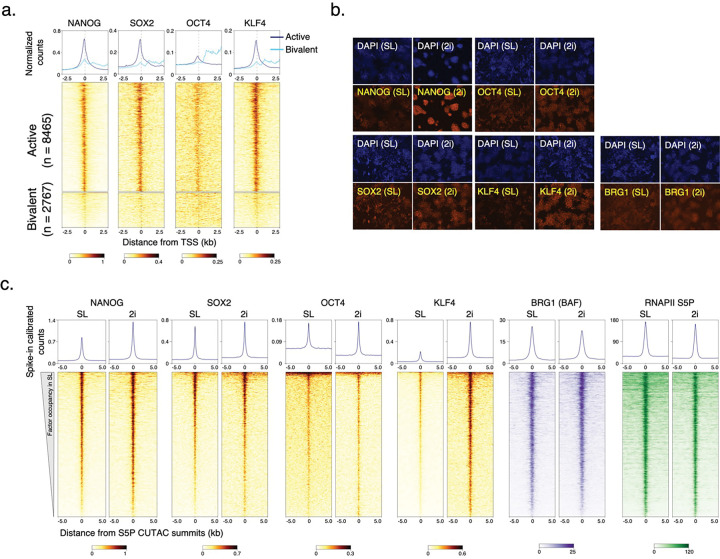
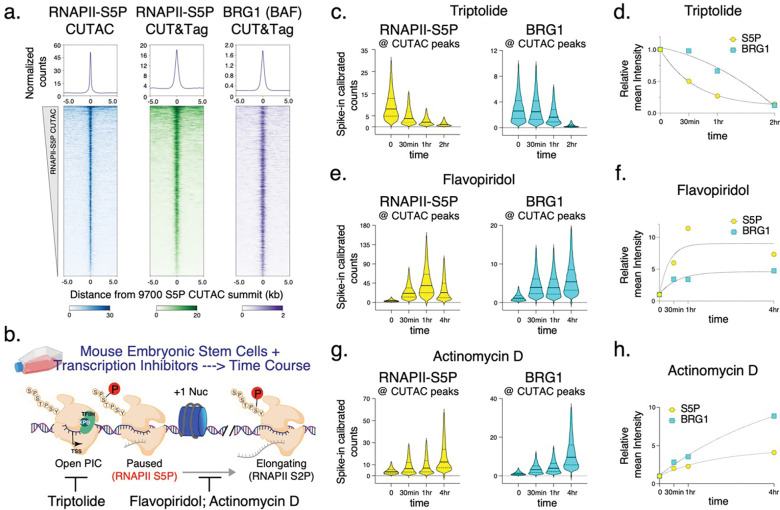
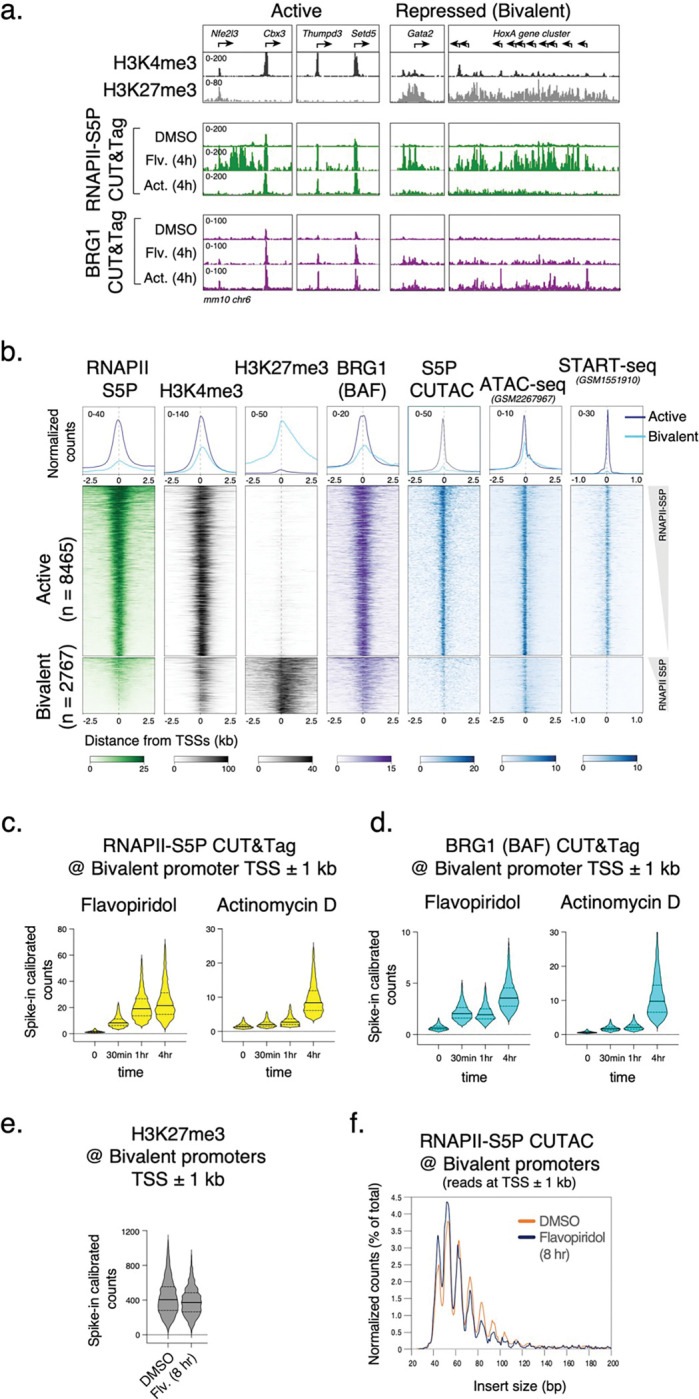
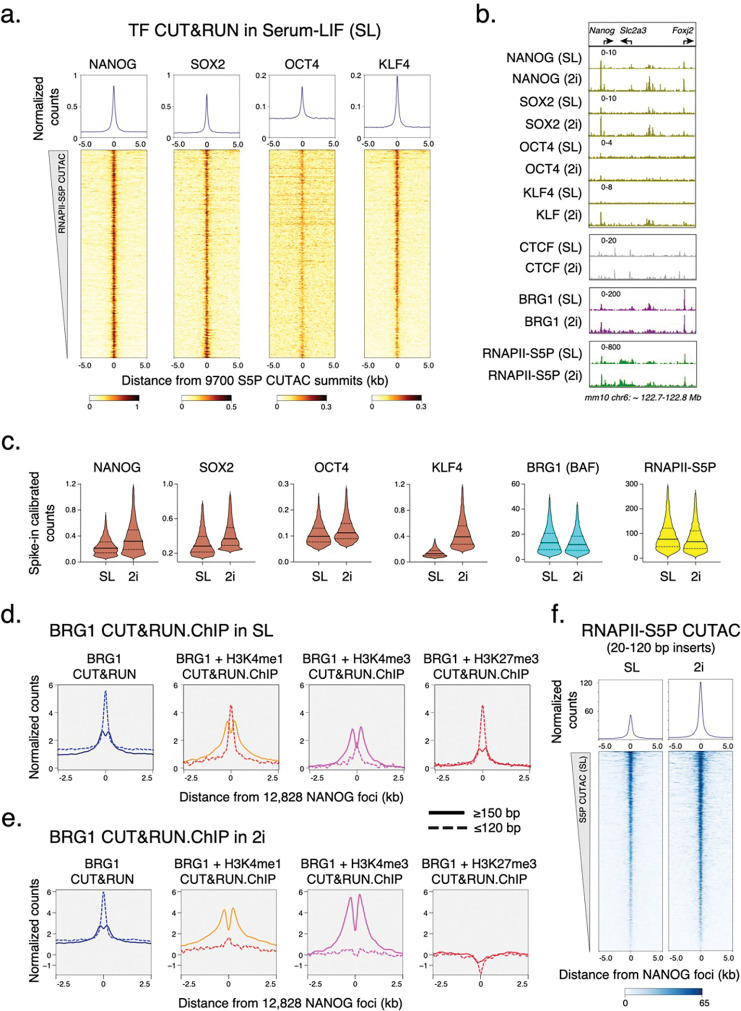
Chromatin accessibility is a hallmark of active transcription and requires ATP-dependent nucleosome remodeling by Brahma-Associated Factor (BAF). However, the mechanistic link between transcription, nucleosome remodeling, and chromatin accessibility is unclear. Here, we used a chemical-genetic approach to dissect the interplay between RNA Polymerase II (RNAPII), BAF, and DNA-sequence-specific transcription factors (TFs) in mouse embryonic stem cells. By time-resolved chromatin profiling with acute transcription block at distinct stages, we show that RNAPII promoter-proximal pausing stabilizes BAF chromatin occupancy and enhances nucleosome eviction by BAF. We find that RNAPII and BAF probe both transcriptionally active and Polycomb-repressed genomic regions and provide evidence that TFs capture transient site exposure due to nucleosome unwrapping by BAF to confer locus specificity for persistent chromatin remodeling. Our study reveals the mechanistic basis of cell-type-specific chromatin accessibility. We propose a new paradigm for how functional synergy between dynamically acting chromatin factors regulates nucleosome organization.


Conflict of interest statement

Declaration of interest The authors declare no competing interests.

Figures

Extended Data Fig. 1 |
Extended Data Fig. 1 |. CUT&Tag of chromatin epitopes and RNAPII-S5P CUTAC in mESCs.
a, Representative genomic tracks showing RNAPII, BRG1, histone PTM occupancy by CUT&Tag, chromatin accessibility (RNAPII-S5P CUTAC), and transcriptional activity (START-seq) at the Nanog promoter and enhancer cluster and flanking genes. Previously annotated enhancer regions are shown on top. b, c, Heatmaps (bottom) and average plots (top) comparing RNAPII, BRG1, and histone PTM occupancy by CUT&Tag, relative to the primary peaks (summits) of RNAPII-S5P CUTAC (b) and RefSeq annotated gene TSSs (c), sorted by decreasing RNAPII-S5P occupancy. d, Violin plots of CUT&Tag signal distribution comparing RNAPII-S5P and BRG1 occupancy at gene promoters (TSS) versus promoter-distal S5P CUTAC peaks (Distal). Median value (solid line), upper and lower quartiles (broken lines) and outliers were calculated using the Tukey method. e, Scatterplots comparing BRG1 and RNAPII S5P, S2P, and RPB3 CUT&Tag reads in 1000 bp genome-wide consecutive non-overlapping bins. f, Heatmaps (bottom) and average plots (top) comparing chromatin accessibility (RNAPII-S5P CUTAC and ATAC-seq), nucleosome positions (MNase seq), and transcriptional activity (START-seq), relative to the primary peaks (summits) of RNAPII-S5P CUTAC; and RNAPII-S5P CUTAC signal relative to RefSeq annotated gene TSSs (extreme right). Datasets are representative of at least two biological replicates.
Extended Data Fig. 2 |
Extended Data Fig. 2 |. CUT&Tag of RNAPII-S5P and BRG1 after inhibitor treatment.
a, b, e, f, Heatmaps (bottom) and average plots (top) comparing RNAPII-S5P and BRG1 occupancy by spike-in calibrated CUT&Tag relative to the primary peaks (summits) of RNAPII-S5P CUTAC in untreated cells (DMSO) versus cells treated with Triptolide (a, b), Flavopiridol, and Actinomycin D (e, f) at indicated time points post drug treatment. c, d, g-j, Comparison of fold changes in mean RNAPII-S5P and BRG1 occupancy (spike-in calibrated CUT&Tag) at gene promoters (TSS, squares) and promoter-distal CUTAC peaks (Distal, circles) at time points after drug treatments. Datasets are representative of at least two biological replicates.
Extended Data Fig. 3 |
Extended Data Fig. 3 |. CUT&RUN.ChIP of BRG1 at promoters.
a, Heatmaps (bottom) and average plots (top) of RNAPII-S5P CUTAC separated by fragment size, relative to primary peaks (summits) of RNAPII-S5P CUTAC. b, Comparison of RNAPII-S5P CUTAC fragment size distribution over peaks (promoter and enhancer NDR spaces) in cells treated with DMSO (control) and Flavopiridol; same data as used for Fig. 2a. c, d, Enrichment of nucleosomal (≥150 bp, solid lines) and subnucleosomal (≤ 120 bp, broken lines) reads from BRG1 CUT&RUN and CUT&RUN.ChIP experiments, relative to gene promoter TSSs, in DMSO and Flavopiridol treated cells. CUT&RUN.ChIP data were plotted as enrichment in histone ChIP over IgG isotype control. Datasets are representative of at least two biological replicates.
Extended Data Fig. 4 |
Extended Data Fig. 4 |. CUT&Tag of RNAPIIS5P and BRG1 at bivalent promoters.
a, K-means clustering of RNAPII-S5P and H3K27me3 CUT&Tag reads relative to RefSeq annotated gene promoter TSSs to group promoters as active (I, RNAPII-S5P enriched) and bivalent (II, H3K27me3 enriched), and not enriched for either (III). b, c, Heatmaps (bottom) and average plots (top) comparing RNAPII-S5P and BRG1 occupancy by spike-in calibrated CUT&Tag relative to bivalent promoter TSSs in untreated cells (DMSO) versus cells treated with Flavopiridol or Actinomycin D at indicated time points post drug treatment. d, Heatmaps (bottom) and average plots (top) comparing H3K27me3 occupancy by spike-in calibrated CUT&Tag relative to bivalent promoter TSSs in untreated cells (DMSO) and cells treated with Flavopiridol. e, Heatmaps (bottom) and average plots (top) comparing H3K9me3 occupancy (CUT&Tag) with RNAPII-S5P and BRG1 relative to H3K9me3 peaks in untreated cells (DMSO) versus cells treated with Flavopiridol or Actinomycin D. RNAPII-S5P and BRG1 CUT&Tag reads were spike-in calibrated and plotted to the same scales as in panels b and c, respectively. Datasets are representative of at least two biological replicates.
Extended Data Fig. 5 |
Extended Data Fig. 5 |. CUT&RUN of pluripotency TFs in SL versus 2i culture conditions.
a, Heatmaps (bottom) and average plots (top) comparing pluripotency TF occupancy by CUT&RUN at RNAPII-enriched (active) and H3K27me3-enriched (bivalent) promoters. Promoters were grouped based on K-means clustering of RNAPII-S5P and H3K27me3 CUT&Tag reads mapping to a 5 kb window around the TSSs of RefSeq-annotated mESC genes, see Extended Data Fig. 4a. b, Immunofluorescent staining comparing pluripotency TF and BRG1 expression in SL versus 2i culture conditions. Cy5-conjugated secondary antibodies were used in all experiment except for KLF4, where Rhodamine red-conjugated antibody was used. DAPI (blue) was used to stain the nucleus in cells. c, Heatmaps (bottom) and average plots (top) comparing pluripotency TF occupancy by spike-in calibrated CUT&RUN in SL versus 2i culture conditions.
Fig. 1 |
Fig. 1 |. RNAPII promoter proximal pausing facilitates BAF chromatin binding.
a, Heatmaps (bottom) and average plots (top) comparing chromatin accessibility assayed by S5P CUTAC, with RNAPII-S5P and BRG1 occupancy (CUT&Tag), relative to the primary peaks (summits) of S5P CUTAC and sorted by decreasing accessibility (CUTAC signal). b, Schematic showing distinct stages in RNAPII transcription that are inhibited by drugs used in this study. c, e, g, Violin plots of spike-in calibrated CUT&Tag signal distribution comparing RNAPII-S5P and BRG1 occupancy over S5P CUTAC peaks at time points after drug treatments for transcription inhibition. Median value (solid line), upper- and lower quartiles (broken lines) and outliers were calculated using the Tukey method. d, f, h, Fold changes in mean RNAPII-S5P and BRG1 occupancy (spike-in calibrated CUT&Tag) over S5P CUTAC peaks at time points after drug treatments. Datasets are representative of at least two biological replicates.
Fig. 2 |
Fig. 2 |. Enrichment of BAF increases nucleosome eviction.
a, Comparison of promoter chromatin structure and chromatin accessibility by means of S5P CUTAC fragment size distribution over peaks (promoter and enhancer NDR spaces) in cells treated with DMSO (control) and Flavopiridol. Peaks were called with DMSO control. b, Heatmaps comparing nucleosomal (≥150 bp reads) and subnucleosomal (≤120 bp reads) protection by BAF (BRG1 CUT&RUN) and BAF-associated histones (BRG1 CUT&RUN.ChIP) in untreated (DMSO control) cells. Heatmaps were plotted relative to S5P CUTAC summits and sorted by decreasing accessibility (CUTAC signal). CUT&RUN.ChIP heatmaps show enrichment over IgG isotype control (for ChIP). c, d, Enrichment of nucleosomal (≥150 bp, solid lines) and subnucleosomal (≤ 120 bp, broken lines) reads from BRG1 CUT&RUN and CUT&RUN.ChIP experiments, relative to S5P CUTAC summits, in DMSO (c) and Flavopiridol treated (d) cells. e, Flavopiridol treatment causes eviction of partially unwrapped nucleosomes through enrichment of BAF at promoters and enhancers, leading to NDR persistence. Datasets are representative of at least two biological replicates.
Fig. 3 |
Fig. 3 |. Transcription inhibition show RNAPII and BAF occupancy at Polycomb-repressed gene promoters.
a, Representative genomic tracks comparing enrichment of histone modifications, RNAPII-S5P, and BRG1 by CUT&Tag at transcriptionally active and Polycomb-repressed bivalent genes, and changes in RNAPII-S5P and BRG1 occupancy upon Flavopiridol (Flv.) and Actinomycin D (Act.) treatment. RNAPII-S5P and BRG1 CUT&Tag read counts were spike-in calibrated. b, Heatmaps (bottom) and average plots (top) comparing histone modifications (CUT&Tag), chromatin structure (RNAPII-S5P CUTAC and ATAC-seq), and transcriptional activity (START-seq) at RNAPII-enriched (active) and H3K27me3-enriched (bivalent) promoters. Promoters were grouped based on K-means clustering of RNAPII-S5P and H3K27me3 CUT&Tag reads mapping to a 5 kb window around the TSSs of RefSeq-annotated mESC genes, see Extended Data Fig. 4a. c, d, Violin plots of spike-in calibrated CUT&Tag signal distribution comparing RNAPII-S5P and BRG1 occupancy over bivalent promoter TSSs ± 1 kb at time points after drug treatments. Median value (solid line), upper- and lower quartiles (broken lines) and outliers were calculated using the Tukey method. e, Violin plot comparing spike-in calibrated H3K27me3 CUT&Tag at bivalent promoter TSSs ± 1 kb in cells treated with DMSO and Flavopiridol. f, S5P CUTAC fragment size distribution to compare chromatin accessibility at bivalent promoter TSSs ± 1 kb in cells treated with DMSO and Flavopiridol. Datasets are representative of at least two biological replicates.
Fig. 4 |
Fig. 4 |. Pluripotency TF binding drives NDR establishment in mESCs.
a, Heatmaps (bottom) and average plots (top) of pluripotency TF CUT&RUN reads relative to RNAPII-S5P CUTAC summits, showing TF binding at sites of DNA accessibility. Heatmaps were sorted by decreasing accessibility (CUTAC signal). b, Representative genomic tracks comparing occupancy of TFs (CUT&RUN), BRG1 (CUT&Tag), and RNAPII-S5P (CUT&Tag) in SL and 2i conditions. All datasets were spike-in calibrated. c, Violin plots of spike-in calibrated CUT&RUN (TF) and CUT&Tag (BRG1 and RNAPII-S5P) signal distribution comparing factor occupancy over RNAPII-S5P CUTAC peaks in 2i versus SL. Median value (solid line), upper- and lower quartiles (broken lines) and outliers were calculated using the Tukey method. d, e, Enrichment of nucleosomal (≥150 bp, solid lines) and subnucleosomal (≤ 120 bp, broken lines) reads from BRG1 CUT&RUN and CUT&RUN.ChIP experiments, relative to NANOG foci (smallest fragment within primary peaks called in SL condition), in SL (d) and 2i (e). f, Heatmaps (bottom) and average plots (top) of RNAPII S5P CUTAC (20–120 bp reads only) relative to NANOG foci, comparing chromatin accessibility in 2i versus SL. Datasets are representative of at least two biological replicates.
Fig. 5 |
Fig. 5 |. RNAPII, BAF and DNA-sequence-specific TFs synergize to dynamically generate NDRs.
Model showing that RNAPII and BAF dynamically engage chromatin in an abortive manner (steps 1a-c) and require chromatin binding by DNA-sequence-specific TFs for productive chromatin remodeling and histone eviction to form an NDR (steps 2–4). Productive remodeling is essential to establish and maintain an active chromatin structure. Steady state promoter and enhancer chromatin structure is highly dynamic and constitutes a cycle of nucleosome deposition and eviction as well as factor binding and unbinding. In this cycle, RNAPII promoter proximal pausing facilitates BAF binding (step 1b). BAF translocates along nucleosomal DNA using the energy of ATP and partially unwraps nucleosomes occluding TF motifs, but BAF turns over rapidly (step 1c). TFs capture transient site exposure to bind to partially unwrapped nucleosomes (step 2), and synergize with BAF to evict histones and create an NDR (step 3), which is essential for subsequent loading of new RNAPII and transcription initiation. TFs also have seconds residence times on chromatin and turn over rapidly (step 4), such that a nucleosome can be deposited or moved into the NDR space, resuming the cycle. Increased expression of TFs (as in 2i compared to SL mESC culture condition) or higher TF DNA binding affinity drives steps 2 and 3 towards a more nucleosome-depleted state by making step 2 irreversible.

References

    1. Kornberg R. D. & Lorch Y. Primary Role of the Nucleosome. Molecular cell 79, 371–375 (2020). 10.1016/j.molcel.2020.07.020 - DOI - PubMed
    1. Zhu F. et al. The interaction landscape between transcription factors and the nucleosome. Nature 562, 76–81 (2018). 10.1038/s41586-018-0549-5 - DOI - PMC - PubMed
    1. Lee C. K., Shibata Y., Rao B., Strahl B. D. & Lieb J. D. Evidence for nucleosome depletion at active regulatory regions genome-wide. Nat Genet 36, 900–905 (2004). 10.1038/ng1400 - DOI - PubMed
    1. Thurman R. E. et al. The accessible chromatin landscape of the human genome. Nature 489, 75–82 (2012). 10.1038/nature11232 - DOI - PMC - PubMed
    1. Brahma S. & Henikoff S. RSC-Associated Subnucleosomes Define MNase-Sensitive Promoters in Yeast. Molecular cell 73, 238–249 e233 (2019). 10.1016/j.molcel.2018.10.046 - DOI - PMC - PubMed

Publication types