[Preprint]. 2023 Jan 10:2023.01.06.522944.
doi: 10.1101/2023.01.06.522944.

A hierarchical pathway for assembly of the distal appendages that organize primary cilia

Affiliations

A hierarchical pathway for assembly of the distal appendages that organize primary cilia

Tomoharu Kanie et al. bioRxiv. .

Update in

Abstract

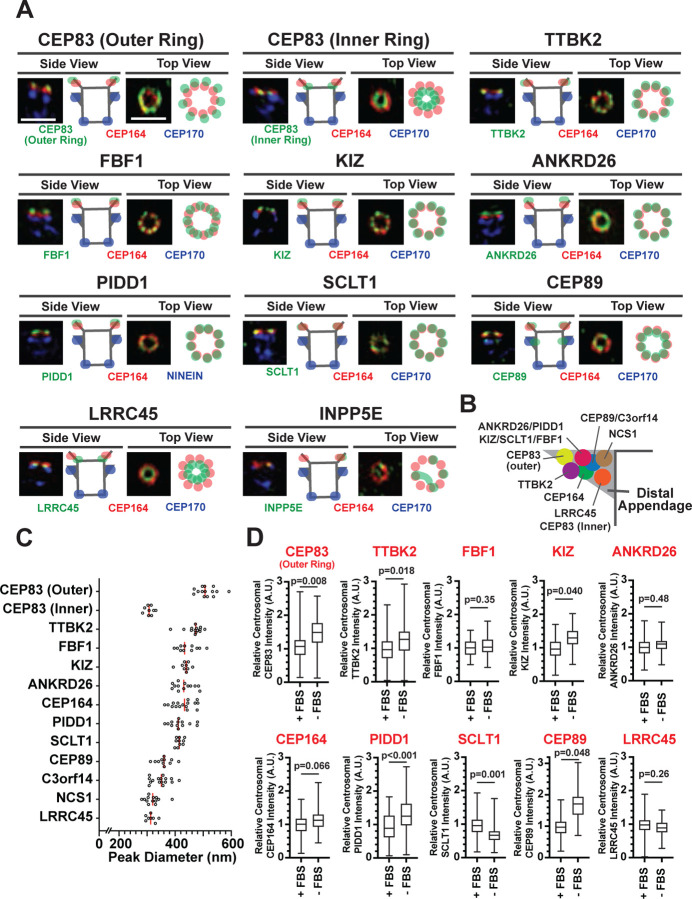
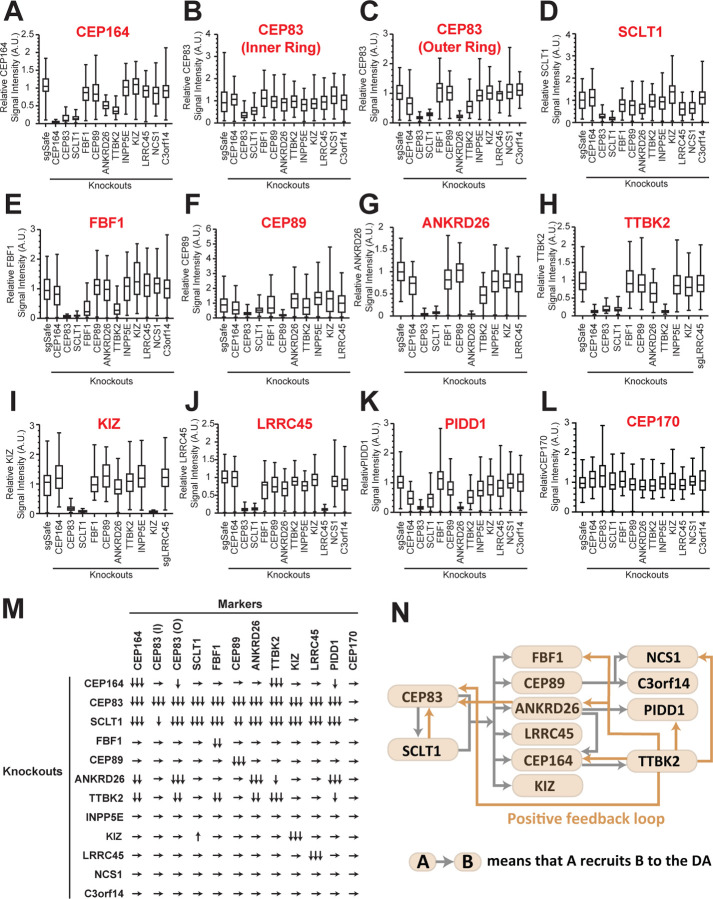
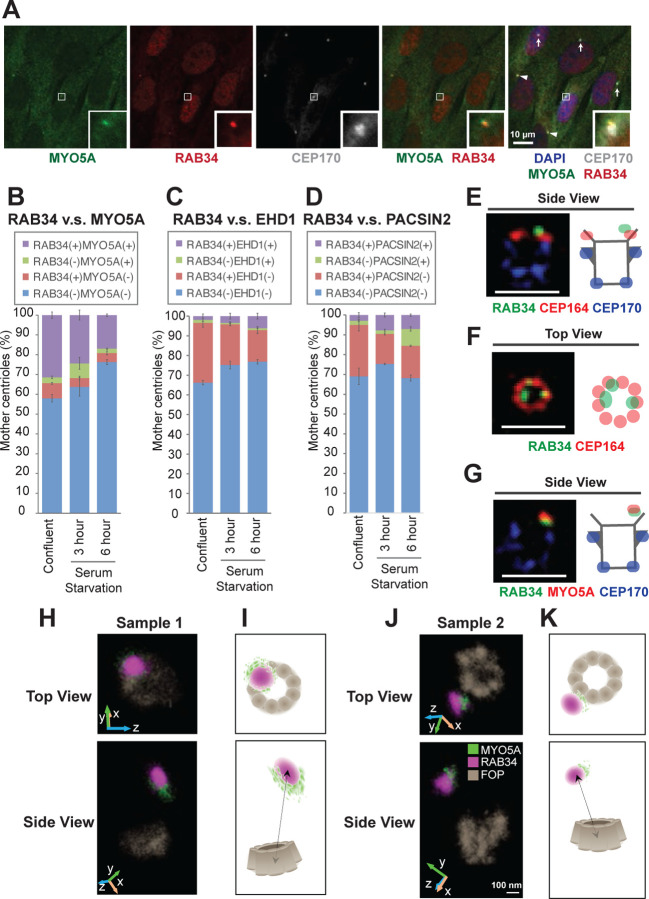
Distal appendages are nine-fold symmetric blade-like structures attached to the distal end of the mother centriole. These structures are critical for formation of the primary cilium, by regulating at least four critical steps: ciliary vesicle recruitment, recruitment and initiation of intraflagellar transport (IFT), and removal of CP110. While specific proteins that localize to the distal appendages have been identified, how exactly each protein functions to achieve the multiple roles of the distal appendages is poorly understood. Here we comprehensively analyze known and newly discovered distal appendage proteins (CEP83, SCLT1, CEP164, TTBK2, FBF1, CEP89, KIZ, ANKRD26, PIDD1, LRRC45, NCS1, C3ORF14) for their precise localization, order of recruitment, and their roles in each step of cilia formation. Using CRISPR-Cas9 knockouts, we show that the order of the recruitment of the distal appendage proteins is highly interconnected and a more complex hierarchy. Our analysis highlights two protein modules, CEP83-SCLT1 and CEP164-TTBK2, as critical for structural assembly of distal appendages. Functional assay revealed that CEP89 selectively functions in RAB34+ ciliary vesicle recruitment, while deletion of the integral components, CEP83-SCLT1-CEP164-TTBK2, severely compromised all four steps of cilium formation. Collectively, our analyses provide a more comprehensive view of the organization and the function of the distal appendage, paving the way for molecular understanding of ciliary assembly.


Figures

Figure 1
Figure 1. Mapping the localization of the distal appendage proteins.
A. RPE cells grown to confluent in fetal bovine serum (FBS)-containing media were fixed without serum starvation (for INPP5E), or after serum starvation for 30 hours (CEP83) or 24 hours (all others). The fixed cells were stained with indicated antibodies and imaged via 3D structured illumination microscopy. Top or Side view pictures of the mother centriole are shown. The individual image is from a representative z-slice. The detailed staining and fixation condition is available in Figure1A-Source Data. Scale bar: 1 µm. B. The location of each distal appendage protein on the side view of the distal appendage. The model was created from each side view shown in (A). C. The peak-to-peak diameter of each distal appendage protein. Each circle represents a measurement from each image. Red bar indicates median diameter. The raw data is available in Figure 1C-Source Data. D. Box plots showing the centrosomal signal intensity of indicated distal appendage proteins in the presence and the absence of serum. RPE cells were grown in FBS-containing media for 24 hours, and then grown in either FBS-containing media or serum free media for additional 24 hours (as shown in Figure 1-figure supplement 4A). Cells were fixed and stained with indicated antibodies. Centrosomal signal intensity of each marker was measured from fluorescent image with the method described in Materials and Methods. The relative fluorescence signal intensity compared with the average of the control is shown. A.U., arbitrary units. The data combined from three independent experiments. Statistical significance was calculated from nested T test. The raw data, sample size, experimental conditions, and detailed statistics are available in Figure 1D-Source Data.
Figure 2
Figure 2. The updated hierarchy of the distal appendage proteins.
A-L. Box plots showing centrosomal signal intensity of indicated distal appendage proteins (A-K) and the subdistal appendage protein, CEP170 (L) in RPE cells (control or indicated knockouts) serum-starved for 24 hours. The relative fluorescence signal intensity compared with the average of the control is shown. The data from a representative experiment. Note that FBF1 signal remains in FBF1 knockout cells, and this issue is discussed in the main text. The raw data and experimental condition are available in Figure 2A-L-Source Data. M. The summary of the signal change in each marker in indicated knockout cells compared with a control. The summary concluded from at least two independent experiments. ↓, weakly reduced; ↓↓, moderately decreased; ↓↓↓, greatly decreased or absent; ↑, weakly increased; →, unaffected. The detailed relationship between CEP89-NCS1-C3ORF14 as well as localization of each distal appendage protein in NCS1 knockout cells are available in an accompanying paper (Tomoharu Kanie, Ng, Abbott, Pongs, & Jackson, 2023). N. The updated hierarchy of the distal appendage proteins. A→B indicates that A is required for the centrosomal localization of B. CEP83 and SCLT1 is required for each other’s localization and are upstream of all the other distal appendage proteins. The outer ring, but not the inner ring, localization of CEP83 was affected in knockouts of several distal appendage proteins (ANKRD26, TTBK2, and CEP164).
Figure 3
Figure 3. RAB34 is a marker for the ciliary vesicle.
A. RPE cells were grown in 10% FBS containing media (serum-fed), fixed, stained with indicated antibodies, and imaged via wide-field microscopy. Arrows and arrowheads indicate RAB34/MYO5A negative or positive centrioles, respectively. Insets at the bottom right corner of each channel are the enlarged images of the smaller insets of each channel. Scale bar: 10 µm. B-D. Quantification of the percentage of the centrioles positive for indicated markers in RPE cells grown in FBS containing media (B) or in serum-free media for 3 (C) or 6 (D) hours. Data are averaged from 3 experiments. Error bars represent ± SEM. Key statistics are available in Figure 3- figure supplement 2. The raw data, sample numbers, experimental conditions, detailed statistics are available in Figure 3B-Source data, Figure 3C-Source data and Figure 3D-Source Data. E-G. RPE cells were grown to confluent in 10% FBS containing media (serum-fed), fixed, stained with indicated antibodies, and imaged via 3D structured illumination microscopy. Scale bar: 1 µm. H-K. 3D super-resolution reconstructions and illustrations of RAB34 (magenta), MYO5A (green), and FOP (gray). (H) and (J) Experimental data shown for top and side views relative to the FOP ring-structure. Orientations in the microscope 3D space are indicated by the inset axes. (I) and (K) Corresponding schematics illustrating the data and highlighting the manner in which MYO5A is located at the edge of the RAB34 distribution. FOP is here visualized with nine-fold symmetry. Arrows in the bottom panels indicate measurements of the distance of the RAB34 distribution from the mother centriole FOP structure. The schematics are not drawn to scale. Scale bar: 100 nm.
Figure 4
Figure 4. The distal appendage plays a role in ciliary vesicle recruitment, IFT recruitment, and CEP19 recruitment independently.
A. Cilium formation assay in control (sgGFP), RAB34 knockout, or MYO5A knockout RPE cells serum starved for 24 hours. Data are averaged from three independent experiments, and each black dot indicates the value from an individual experiment. Error bars represent ± SEM. Statistics obtained through comparing between each knockout and control by Welch’s t-test. The raw data, experimental conditions, and detailed statistics are available in Figure 4A-Source Data. B. Transmission electron microscopy analysis of the mother centriole in control (sgGFP) or RAB34 knockout RPE cells serum starved for 3 hours. The representative images of the mother centrioles without (left) or with (right) ciliary vesicle at the distal appendages are shown. C. Quantification of the data shown in (B). The raw data and detailed statistics are available in Figure 4C-Source data. D. CP110 removal assay in control (sgGFP), RAB34 knockout, or MYO5A knockout RPE cells serum starved for 24 hours. Data are averaged from three independent experiments, and each black dot indicates the value from an individual experiment. Error bars represent ± SEM. Statistics obtained through comparing between each knockout and control by Welch’s t-test. The raw data, experimental conditions, and detailed statistics are available in Figure 4D-Source Data. E-J. Box plots showing centrosomal signal intensity of IFT88 (E, G, and J), CEP19 (F and I), or IFT57 (H) in sgGFP control (E, F, I, and J), parental RPE-BFP-Cas9 control (G and H), indicated knockouts (E, F, I, and J), or RPE cells expressing sgIFT52 (G and H) serum starved for 24 hours. At least 40 cells were analyzed per each sample. The relative fluorescence signal intensity compared with the average of the control is shown. Data from a representative experiment are shown. The raw data and experimental conditions are available in Figure 4E-J-Source Data. K. Ciliary vesicle recruitment assay in control (sgSafe) or indicated knockout RPE cells grown to confluent (without serum starvation). At least 90 cells were analyzed per each sample. The data is averaged from five independent experiments. Error bars represent ± SEM. Statistics obtained through comparing between each knockout and control by Welch’s t-test. The raw data, experimental conditions, and detailed statistics are available in Figure 4K-Source Data. L. Summary of the role of the distal appendage. The distal appendage independently regulates IFT/CEP19 recruitment and ciliary vesicle recruitment, whereas CP110 removal is partially downstream of ciliary vesicle recruitment. A.U., arbitrary units; n.s., not significant; *p < 0.05, **p < 0.01, ***p < 0.001
Figure 5
Figure 5. Functional analysis of distal appendage proteins reveals CEP89 as a protein important for ciliary vesicle recruitment.
A-B. Cilium formation assay in control (sgGFP) and indicated knockout RPE cells serum starved for 24 hours (A) or 48 hours (B). Data are averaged from five (A) or three (B) independent experiments, and each black dot indicates the value from an individual experiment. Error bars represent ± SEM. Statistics obtained through comparing between each knockout and control by Welch’s t-test. The raw data, experimental conditions, and detailed statistics are available in Figure 5A-B-Source Data. C. Ciliary vesicle recruitment assay in control (sgSafe) or indicated knockout RPE cells grown to confluent (without serum starvation). The data are averaged from eight independent experiments. Error bars represent ± SEM. Statistics obtained through comparing between each knockout and control by Welch’s t-test. The raw data, experimental conditions, and detailed statistics are available in Figure 5C-Source Data. D. CP110 removal assay in control (sgGFP) and indicated knockout RPE cells serum starved for 24 hours. Data are averaged from three independent experiments, and each black dot indicates the value from an individual experiment. Error bars represent ± SEM. Statistics obtained through comparing between each knockout and control by Welch’s t-test. The raw data, experimental conditions, and detailed statistics are available in Figure 5D-Source Data. E-F. Box plots showing centrosomal signal intensity of IFT88 (E) or CEP19 (F) in control (sgSafe) and indicated knockout RPE cells serum starved for 24 hours. The relative fluorescence signal intensity compared with the average of the control is shown. The data from a representative experiment are shown. The raw data and experimental conditions are available in Figure 5E-F-Source Data. A.U., arbitrary units; n.s., not significant; *p < 0.05, **p < 0.01, ***p < 0.001
Figure 6
Figure 6. Model of the function of the distal appendage proteins.
A. The CEP83-SCLT1 module serves as a structural complex, which is indispensable for the localization of all the other distal appendage proteins. TTBK2 together with its upstream protein, CEP164, is critical for proper localization of many distal appendage proteins, including the most upstream CEP83, suggesting that CEP164-TTBK2 serves as a positive feedback module. These four proteins are necessary for structural integrity of the distal appendage, thus, the lack of each protein results in severe defects in virtually all the functions of the distal appendage (IFT/CEP19/ciliary vesicle recruitment). In contrast, CEP89 is primarily important for ciliary vesicle recruitment.

References

    1. Acs P., Bauer P. O., Mayer B., Bera T., Macallister R., Mezey E., & Pastan I. (2015). A novel form of ciliopathy underlies hyperphagia and obesity in Ankrd26 knockout mice. Brain Struct Funct, 220(3), 1511–1528. doi: 10.1007/s00429-014-0741-9 - DOI - PMC - PubMed
    1. Ainavarapu S. R., Brujic J., Huang H. H., Wiita A. P., Lu H., Li L., . . . Fernandez, J. M. (2007). Contour length and refolding rate of a small protein controlled by engineered disulfide bonds. Biophys J, 92(1), 225–233. doi: 10.1529/biophysj.106.091561 - DOI - PMC - PubMed
    1. Anderson R. G. (1972). The three-dimensional structure of the basal body from the rhesus monkey oviduct. J Cell Biol, 54(2), 246–265. doi: 10.1083/jcb.54.2.246 - DOI - PMC - PubMed
    1. Anderson R. G., & Brenner R. M. (1971). The formation of basal bodies (centrioles) in the Rhesus monkey oviduct. J Cell Biol, 50(1), 10–34. doi: 10.1083/jcb.50.1.10 - DOI - PMC - PubMed
    1. Bayas C., Diezmann A. v., Gustavsson A.-K., & Moerner W. E. (2019). Easy-DHPSF 2.0: open-source software for three-dimensional localization and two-color registration of single molecules with nanoscale accuracy (Publication no. 10.21203/rs.2.9151/v2). - DOI

Publication types