[Preprint]. 2023 Jan 9:2023.01.09.523268.
doi: 10.1101/2023.01.09.523268.

A comparative analysis of microglial inducible Cre lines

Affiliations

A comparative analysis of microglial inducible Cre lines

Travis E Faust et al. bioRxiv. .

Update in

  • A comparative analysis of microglial inducible Cre lines.
    Faust TE, Feinberg PA, O'Connor C, Kawaguchi R, Chan A, Strasburger H, Frosch M, Boyle MA, Masuda T, Amann L, Knobeloch KP, Prinz M, Schaefer A, Schafer DP. Faust TE, et al. Cell Rep. 2023 Sep 26;42(9):113031. doi: 10.1016/j.celrep.2023.113031. Epub 2023 Aug 26. Cell Rep. 2023. PMID: 37635351 Free PMC article.

Abstract

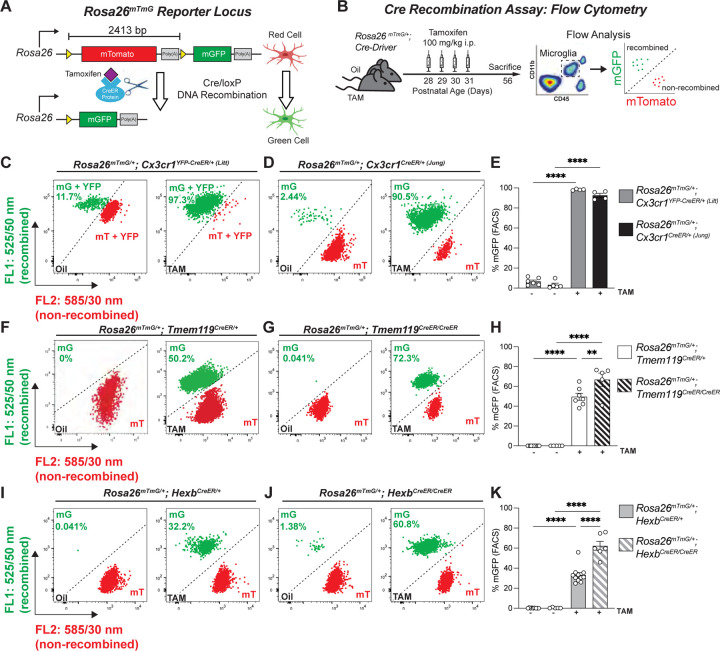
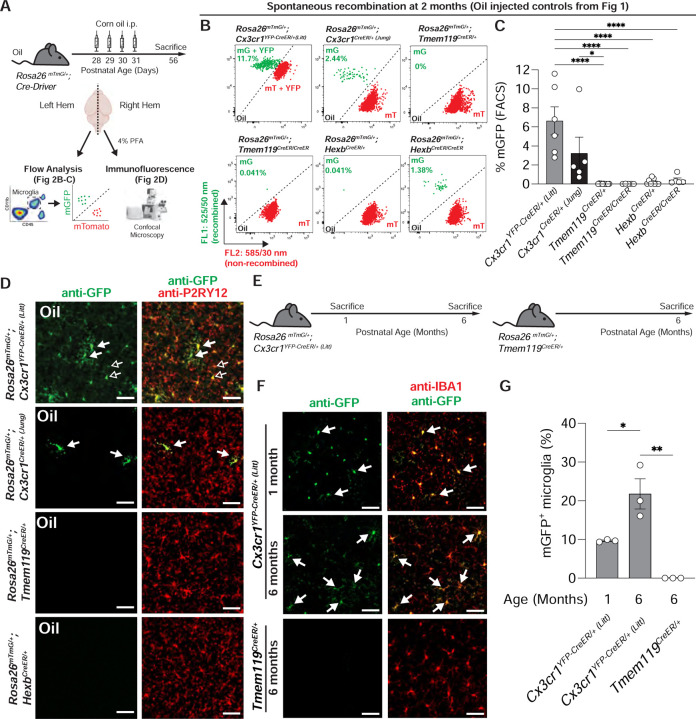
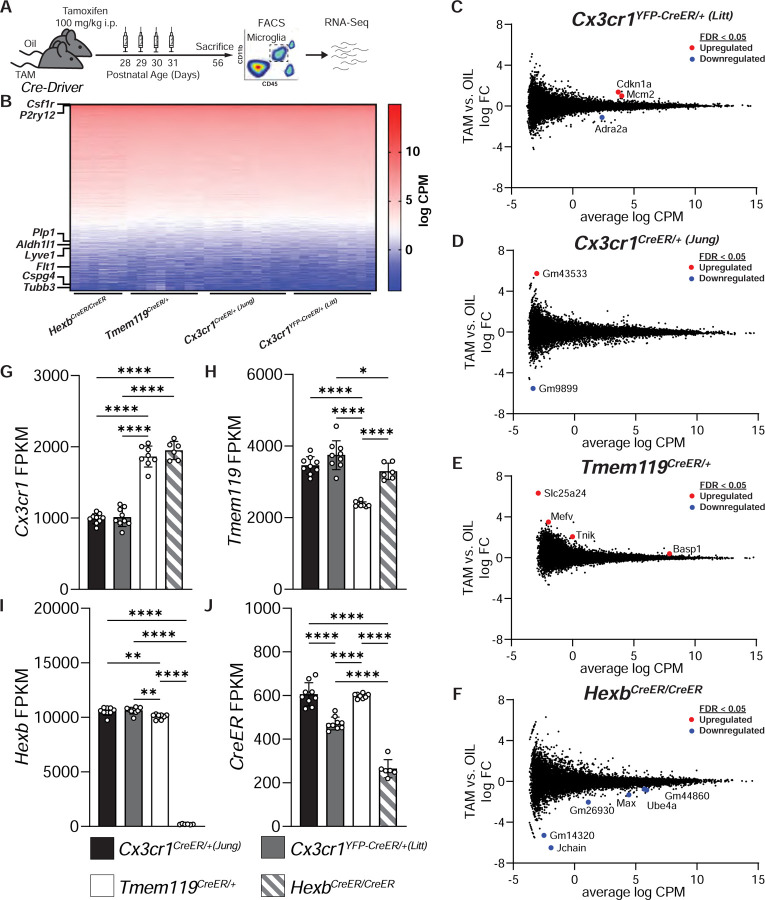
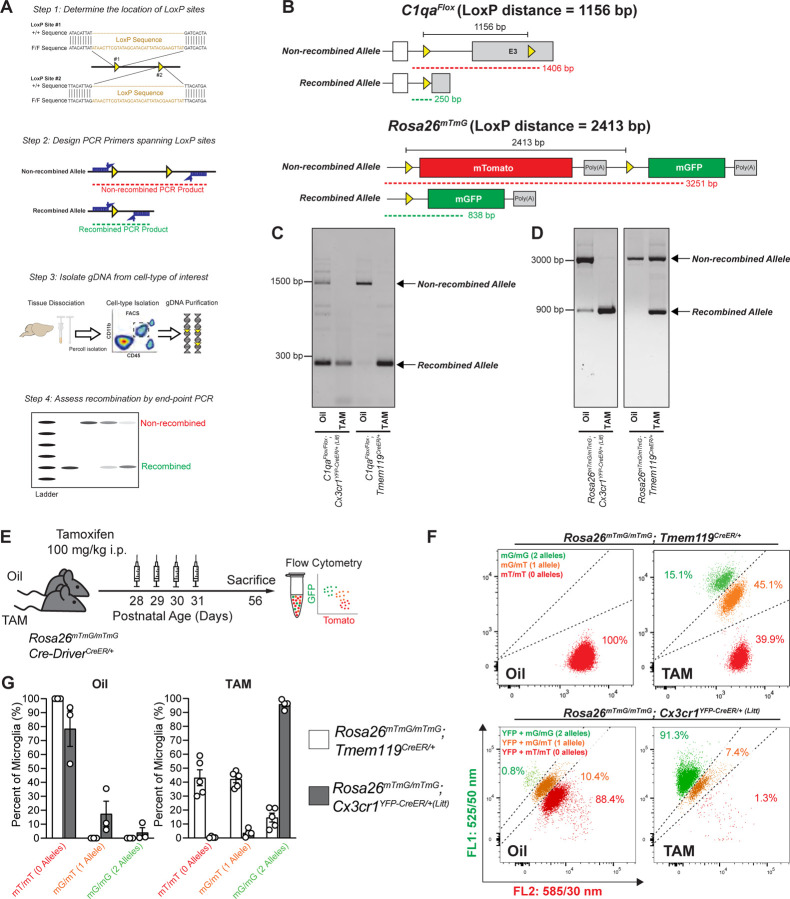
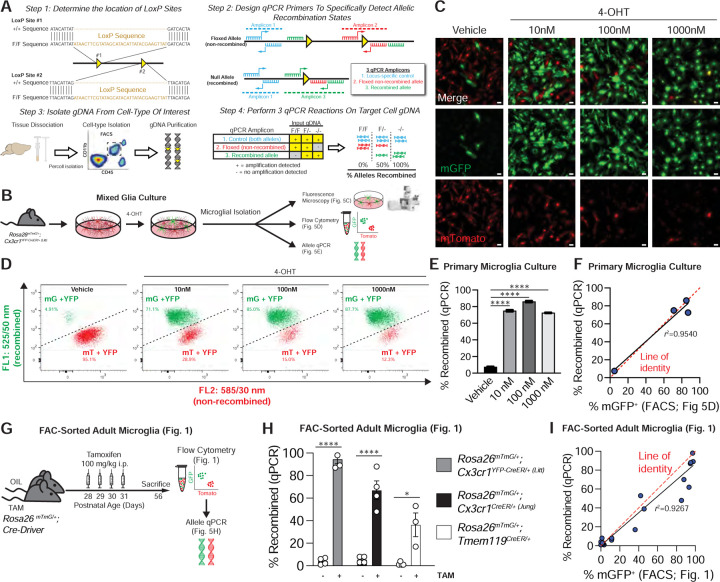
Cre/LoxP technology has revolutionized genetic studies and allowed for spatial and temporal control of gene expression in specific cell types. The field of microglial biology has particularly benefited from this technology as microglia have historically been difficult to transduce with virus or electroporation methods for gene delivery. Here, we interrogate four of the most widely available microglial inducible Cre lines. We demonstrate varying degrees of recombination efficiency and spontaneous recombination, depending on the Cre line and loxP distance. We also establish best practice guidelines and protocols to measure recombination efficiency in microglia, which could be extended to other cell types. There is increasing evidence that microglia are key regulators of neural circuit structure and function. Microglia are also major drivers of a broad range of neurological diseases. Thus, reliable manipulation of their function in vivo is of utmost importance. Identifying caveats and benefits of all tools and implementing the most rigorous protocols are crucial to the growth of the field of microglial biology and the development of microglia-based therapeutics.


Conflict of interest statement

Declaration of interests

The authors declare no competing interests.

Figures

Figure 1.
Figure 1.. Recombination efficiency varies across microglial CreER lines.
A Diagram of the Rosa26mTmG allele and corresponding cellular fluorescence before and after Cre/loxP DNA recombination. LoxP sites are indicated by yellow triangles. B Diagram of experimental protocol used to assess tamoxifen (TAM) induced Cre/loxP recombination of Rosa26mTmG/+ in microglia by flow cytometry. C,D,F,G,I,J Representative flow cytometry results show the percentage of mGFP+ (mG+) and mTomato+ (mT+) microglia from individual animals from each group. E,H,K Quantification of the percentage of recombined mGFP+ microglia in Cx3cr1CreER lines (E), TMEM119CreER lines (H), and HexbCreER lines (K). 2-way ANOVA with Sidak’s post hoc. (E, Cx3cr1YFP-CreER/+ (Litt) oil vs TAM, n = 6 oil, 4 TAM mice, P < 0.0001, t = 41.37, df = 15; Cx3cr1CreER/+ (Jung) oil vs TAM, n = 5 oil, 4 TAM mice, P < 0.0001, t = 38.77, df = 15) (H, Tmem119CreER/+ oil vs TAM, n = 11 oil, 7 TAM mice, P < 0.0001, t = 13.39, df = 24; Tmem119CreER/CreER oil vs TAM, n = 5 oil, 5 TAM mice, P < 0.0001, t = 16.2, df = 24; Tmem119CreER/+ TAM vs Tmem119CreER/CreER TAM, n = 7 CreER/+, 5 CreER/CreER mice, P < 0.0001, t = 3.869, df = 24) (K, HexbCreER/+ oil vs TAM, n = 9 oil, 11 TAM mice, P < 0.0001, t = 10.36, df = 27; HexbCreER/CreER oil vs TAM, n = 5 oil, 6 TAM mice, P < 0.0001, t = 14.40, df = 27; HexbCreER/+ TAM vs HexbCreER/CreER TAM, n = 11 CreER/+, 6 CreER/CreER, P < 0.0001, t = 8.063, df = 27.) All data are presented as mean ± SEM. See also Figures S1 and S2.
Figure 2.
Figure 2.. Spontaneous recombination occurs in the Cx3cr1CreER lines.
A Diagram of experimental protocol used to assess spontaneous Cre/loxP recombination of Rosa26mTmG/+ in microglia by flow cytometry and immunofluorescence. B Representative flow cytometry results show the percentage of recombined mGFP+ (mG) and mTomato+ (mT) microglia from individual animals from each group from Fig 1. C Quantification of the percentage of recombined mGFP+ microglia shows increased spontaneous recombination of the Rosa26mTmG allele in the Cx3cr1CreER lines compared to the Tmem119CreER and HexbCreER lines (1-way ANOVA with Tukey’s post hoc; Cx3cr1YFP-CreER/+ (Litt) vs. Tmem119CreER/+, n = 6, 11 mice, P < 0.0001, q = 9.749, df = 35; Cx3cr1YFP-CreER/+ (Litt) vs. Tmem119CreER/CreER, n = 6, 5 mice, P < 0.0001, q = 8.171, df = 35; Cx3cr1YFP-CreER/+ (Litt) vs. HexbCreER/+, n = 6, 9 mice, P < 0.0001, q = 9.114, df = 35; Cx3cr1YFP-CreER/+ (Litt) vs. HexbCreER/CreER, n = 6, 5 mice, P < 0.0001, q = 7.675, df = 35; Cx3cr1CreER/+ (Jung) vs. Tmem119CreER/+, n = 5, 11 mice, P < 0.0368, q = 4.444, df = 35). D Representative immunofluorescent images of brain sections from right hemispheres of oil injected mice used for flow cytometry analysis in B-C. Sections were immunolabeled for anti-P2RY12 (red) to identify microglia and anti-GFP (green) to identify recombined cells. The number of recombined mGFP+ microglia (white arrows) matches the results observed by flow cytometry. In the Cx3cr1YFP-CreER/+ (Litt) line, the soma of unrecombined microglia are also immunolabeled by anti-GFP due to the constitutive expression YFP (open arrows), but can be distinguished from recombined mGFP+ microglia by fluorescence intensity and membrane labeling. Scale bars 50 µm. E Diagram of genotypes and ages used for assessment of spontaneous Cre/loxP recombination of Rosa26mTmG/+ mice with no injection. F Representative immunofluorescent images of brain sections immunolabeled for anti-GFP (green) and anti-IBA1 (red) to identify recombined mGFP+ microglia (white arrows). G Quantification of the percentage of recombined mGFP+ microglia in the cortex shows increased recombination of Rosa26mTmG/+ in 6 month old Cx3cr1YFP-CreER/+ (Litt) mice vs. 1 month old Cx3cr1YFP-CreER/+ (Litt) mice and 6 month old Tmem119CreER/+ mice (1-way ANOVA with Tukey’s post hoc; Cx3cr1YFP-CreER/+ (Litt) 6 mo vs. 1 mo, n = 3 mice, P = 0.0012, q = 5.39, df = 6; Cx3cr1YFP-CreER/+ (Litt) 6 mo vs. Tmem119CreER/+ 6 mo, n = 3 mice, q = 9.696, df = 6). Scale bars 50 µm. All data are presented as mean ± SEM.
Figure 3.
Figure 3.. Subtle differences in gene expression exist across microglial CreER lines
A Diagram of experimental protocol used to perform RNA sequencing on microglia from CreER lines injected with tamoxifen (TAM) or oil. B Heatmap of gene expression values (log counts per million (CPM)) across all samples. Rows corresponding to cell-type specific genes markers for microglia (Csf1r, P2ry12), oligodendrocytes (Plp1), astrocytes (Aldh1l1), border-associated macrophages (Lyve1), endothelial cells (Flt1), oligodendrocyte precursor cells (Cspg4), and neurons (Tubb3) are annotated. C-F Smear plots of TAM vs. oil injected Cx3cr1YFP-CreER/+ (Litt) (C), Cx3cr1CreER/+ (Jung) (D), Tmem119CreER/+ (E), and HexbCreER/CreER (F) mice depicting log fold change (FC) on the y-axis against log CPM on the x-axis. Differentially expressed genes with false discovery rate (FDR) < 0.05 are annotated in red (upregulated by TAM) or blue (downregulated by TAM). G-I Quantification of genes whose promoters are used to drive CreER expression show that Cx3cr1 is reduced in Cx3cr1YFP-CreER/+ (Litt) and Cx3cr1CreER/+ (Jung) mice. 1-way ANOVA with Tukey’s post hoc. (G, Cx3cr1YFP-CreER/+ (Litt) vs. Tmem119CreER/+, n = 9, 8 mice, P < 0.0001, q = 21.02, df = 28; Cx3cr1YFP-CreER/+ (Litt) vs. HexbCreER/CreER, n = 9, 6 mice, P < 0.0001, q = 21.29, df = 28; Cx3cr1CreER/+ (Jung) vs. Tmem119CreER/+, n = 9, 8 mice, P < 0.0001, q = 20.54, df = 28; Cx3cr1CreER/+ (Jung) vs. HexbCreER/CreER; n = 9, 6 mice, P < 0.0001, q = 20.85, df = 28) (H, Tmem119CreER/+ vs. Cx3cr1YFP-CreER/+ (Litt), n = 8, 9 mice, P < 0.0001, q = 11.64, df = 28; Tmem119CreER/+ vs. Cx3cr1CreER/+ (Jung), n = 8, 9 mice, P < 0.0001, q = 14.71, df = 28; Tmem119CreER/+ vs. HexbCreER/CreER, n = 8, 6 mice, P < 0.0001, q = 8.876, df = 28; Cx3cr1CreER/+ (Jung) vs. HexbCreER/CreER, n = 9, 6 mice, P < 0.0186, q = 4.468, df = 28) and (I, Tmem119CreER/+ vs. Cx3cr1YFP-CreER/+ (Litt), n = 8, 9 mice, P < 0.0067, q = 5.053, df = 28; Tmem119CreER/+ vs. Cx3cr1CreER/+ (Jung), n = 8, 9 mice, P < 0.0019, q = 5.741, df = 28; Tmem119CreER/+ vs. HexbCreER/CreER, n = 8, 6 mice, P < 0.0001, q = 94.04, df = 28; Cx3cr1CreER/+ (Jung) vs. HexbCreER/CreER, n = 9, 6 mice, P < 0.0001, q = 101.7, df = 28; Cx3cr1YFP-CreER/+ (Litt) vs. HexbCreER/CreER, n = 9, 6 mice, P < 0.0001, q = 101.0, df = 28). J Quantification of CreER expression shows significant differences between CreER lines. 1-way ANOVA with Tukey’s post hoc. (Cx3cr1CreER/+ (Jung) vs. Cx3cr1YFP-CreER/+ (Litt), n = 9, 9 mice, P < 0.0001, q = 10.68, df = 28; Tmem119CreER/+ vs. Cx3cr1CreER/+ (Jung), n = 8, 9 mice, P < 0.0001, q = 9.830, df = 28; Tmem119CreER/+ vs. HexbCreER/CreER, n = 8, 6 mice, P < 0.0001, q = 23.43, df = 28; Cx3cr1CreER/+ (Jung) vs. HexbCreER/CreER, n = 9, 6 mice, P < 0.0001, q = 14.95, df = 28; Cx3cr1YFP-CreER/+ (Litt) vs. HexbCreER/CreER, n = 9, 6 mice, P < 0.0001, q = 24.51, df = 28). Data in G-J are presented as mean ± SEM. See also Figure S3.
Figure 4.
Figure 4.. LoxP distance is a determinant of recombination efficiency in microglial CreER lines
A Diagram of protocol to assess Cre/LoxP recombination in microglia by end-point PCR of genomic DNA (gDNA). B Diagrams of C1qaFlox allele and the Rosa26mTmG allele before and after Cre/LoxP recombination show the locations of the LoxP sites (yellow triangles), the LoxP distance, and the end-point PCR products for non-recombined (red) and recombined (green) gDNA. C-D End-point PCR of microglial gDNA isolated by florescence-activated cell sorting (FACS) from oil and tamoxifen (TAM) injected Cx3cr1YFP-CreER/+ (Litt) and Tmem119CreER/+ mice homozygous for (C) C1qaFlox/Flox or (D) Rosa26mTmG/mTmG. Gel images of TAM-injected samples from Cx3cr1YFP-CreER/+ (Litt) mice only show the recombined product for both C1qaFlox and Rosa26mTmG, indicating efficient recombination of both alleles. Gel images of TAM-injected samples from Tmem119CreER mice show only the recombined product for C1qaFlox, but both recombined and non-recombined products for Rosa26mTmG, indicating that Tmem119CreER more efficiently recombines C1qaFlox, the allele with the shorter LoxP distance. Oil-injected Cx3cr1YFP-CreER/+ (Litt) mice, but not oil-injected Tmem119CreER mice, show both non-recombined and recombined products for C1qaFlox and Rosa26mTmG, indicating spontaneous recombination. The relative band intensities indicate that C1qaFlox, the allele with the shorter LoxP distance, undergoes more spontaneous recombination than Rosa26mTmG in Cx3cr1YFP-CreER/+ (Litt) mice. E Diagram of protocol to assess Cre/LoxP recombination of homozygous Rosa26mTmG/mTmG microglia isolated by flow cytometry from mice injected with oil or TAM. F Flow cytometry analysis of doubly recombined mGFP+/mGFP+ (mG/mG) vs. singly recombined mGFP+/mTomato+ (mG/mT) microglia vs. non-recombined mTomato+/mTomato+ (mT/mT) microglia in Rosa26mTmG/mTmG; Tmem119CreER/+ mice with no YFP and Rosa26mTmG/mTmG; Cx3cr1YFP-CreER/+ (Litt) mice expressing YFP. G Bar graph of the number of non-recombined mT/mT, singly recombined mG/mT, and doubly recombined mG/mG microglia per animal after injection with oil or TAM. Datapoints represent individual mice. Data is represented as mean ± SEM. See also Figures S4 and S5.
Figure 5.
Figure 5.. A qPCR protocol to quantitatively assess recombination in microglia
A Diagram of protocol used to quantify Cre/LoxP recombination of microglial genomic DNA (gDNA) by quantitative PCR (qPCR). B Diagram of experiment to assess Cre/LoxP recombination in primary microglia cultures from Rosa26mTmG/+; Cx3cr1YFP-CreER/+ (Litt) mice after exposure to 4-hydroxytamoxifen (4-OHT). C Fluorescent images of endogenous mGFP (green) and endogenous mTomato (red) in primary microglia cultures from Rosa26mTmG/+; Cx3cr1YFP-CreER/+ (Litt) mice after exposure to 4-OHT. Scale bars=25 µm. D Flow cytometry analysis of recombined mGFP+ (mG) vs. non-recombined mTomato+ (mT) microglia in primary microglia cultures from Rosa26mTmG/+; Cx3cr1YFP-CreER/+ (Litt) mice after exposure to 4-OHT. E Quantification of the percentage of recombined gDNA by qPCR shows increased recombination in primary microglia exposured to 10 nM, 100 nM, or 1000 nM of 4-OHT (1-way ANOVA with Dunnett’s post-hoc; vehicle vs. 10 nM, n = 2 independent cultures, P < 0.0001, q = 60.37, df = 4; vehicle vs. 100 nM, n = 2 independent cultures, P < 0.0001, q = 70.21, df = 4; vehicle vs. 1000 nM, n = 2 independent cultures, P < 0.0001, q = 58.14, df = 4). F Graph of percent recombination of Rosa26mTmG in primary microglia from Rosa26mTmG/mTmG; Cx3cr1YFP-CreER/+ (Litt) mice after exposure to 4OH tamoxifen as measured by flow cytometry analysis vs. the recombination rate as measured by qPCR of microglial gDNA isolated by fluorescence-activated cell sorting (FACS). Data points fit to a linear curve (black line; r2 = 0.9540), closely aligned with the line of identity (red dashed line), indicating that qPCR provides a linear, quantitative measurement of Rosa26mTmG recombination in in vitro samples. G Diagram of experiment to assess Cre/LoxP recombination in mice injected with tamoxifen (TAM) or oil. H Quantification of the percentage of recombined gDNA by qPCR shows increased recombination in TAM vs. oil for all three CreER lines (Rosa26mTmG/+; Cx3cr1YFP-CreER/+ (Litt): Student’s t-test, n = 4 mice, P < 0.0001, t = 21.38, d f= 6; Rosa26mTmG/+; Cx3cr1CreER/+ (Jung): Student’s t-test, n = 4 mice, P = 0.0003, t = 7.26, df = 6; Rosa26mTmG/+; Tmem119CreER/+: Student’s t-test, n = 4 oil, 3 TAM mice, P = 0.0111, t = 3.925, df = 5). I Graph of percent recombination of Rosa26mTmG in microglia in mice injected with TAM or oil as measured by flow cytometry analysis (see also Fig. 1) vs. the recombination rate as measured by qPCR of microglial gDNA isolated by FACS. Data points fit to a linear curve (black line; r2 = 0.9267), closely aligned with the line of identity (red dashed line), indicating that qPCR provides a linear, quantitative measurement of Rosa26mTmG recombination in in vivo samples. Data in e and h are presented as mean ± SEM.

References

    1. Absinta M., Maric D., Gharagozloo M., Garton T., Smith M.D., Jin J., Fitzgerald K.C., Song A., Liu P., Lin J.P., et al. (2021). A lymphocyte-microglia-astrocyte axis in chronic active multiple sclerosis. Nature 597, 709–714. - PMC - PubMed
    1. Biber K., Moller T., Boddeke E., and Prinz M. (2016). Central nervous system myeloid cells as drug targets: current status and translational challenges. Nature reviews Drug discovery 15, 110–124. - PubMed
    1. Chappell-Maor L., Kolesnikov M., Kim J.S., Shemer A., Haimon Z., Grozovski J., Boura-Halfon S., Masuda T., Prinz M., and Jung S. (2020). Comparative analysis of CreER transgenic mice for the study of brain macrophages: A case study. Eur J Immunol 50, 353–362. - PubMed
    1. Cox B.C., Liu Z., Lagarde M.M., and Zuo J. (2012). Conditional gene expression in the mouse inner ear using Cre-loxP. J Assoc Res Otolaryngol 13, 295–322. - PMC - PubMed
    1. Donocoff R.S., Teteloshvili N., Chung H., Shoulson R., and Creusot R.J. (2020). Optimization of tamoxifen-induced Cre activity and its effect on immune cell populations. Sci Rep 10, 15244. - PMC - PubMed

Publication types