[Preprint]. 2023 Jan 20:2023.01.19.524841.
doi: 10.1101/2023.01.19.524841.

Antimicrobial mitochondrial reactive oxygen species induction by lung epithelial metabolic reprogramming

Affiliations

Antimicrobial mitochondrial reactive oxygen species induction by lung epithelial metabolic reprogramming

Yongxing Wang et al. bioRxiv. .

Update in

Abstract

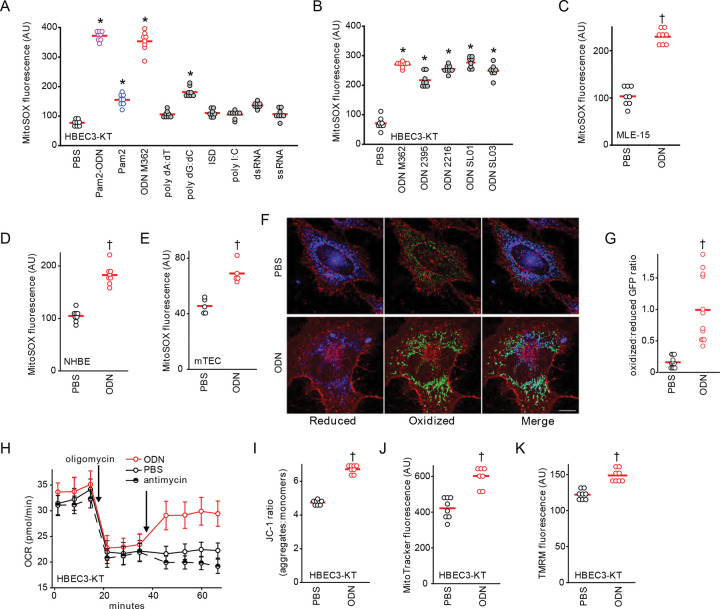
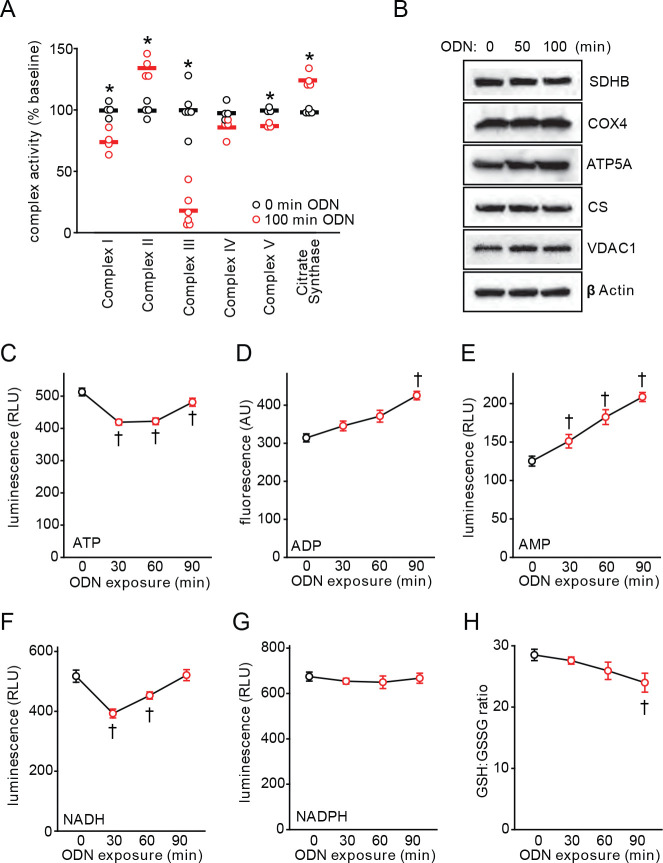
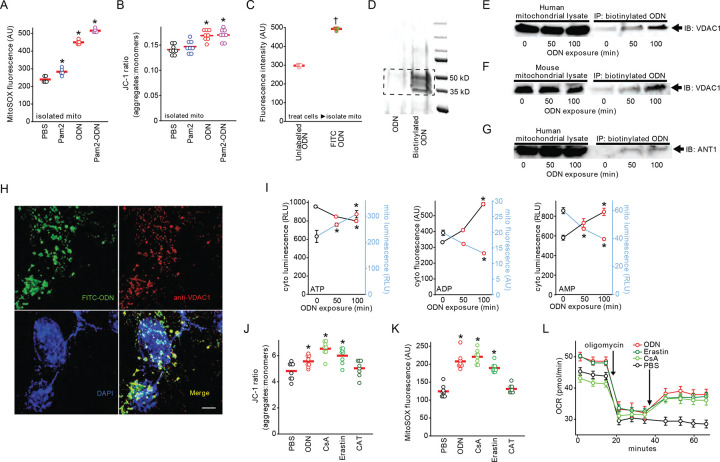
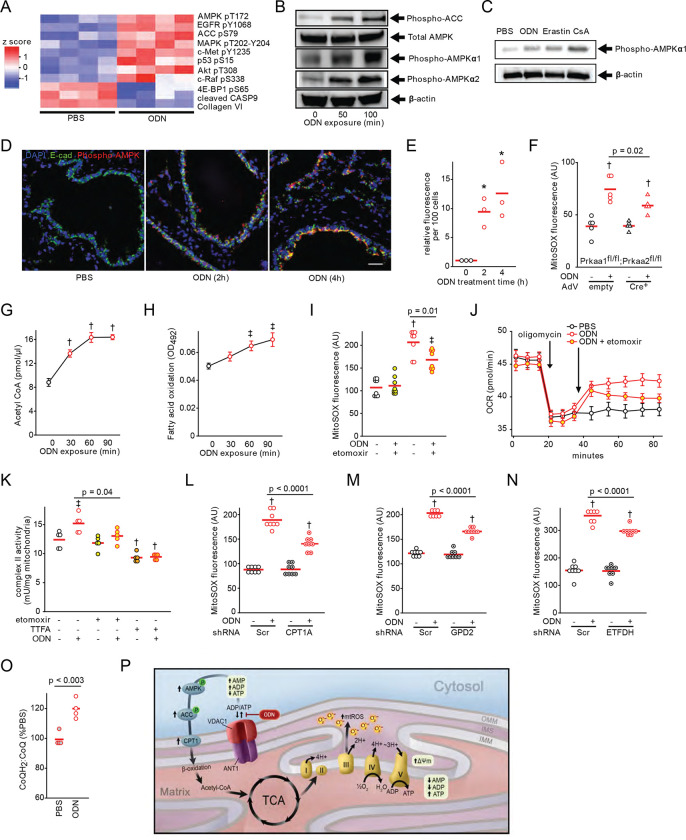
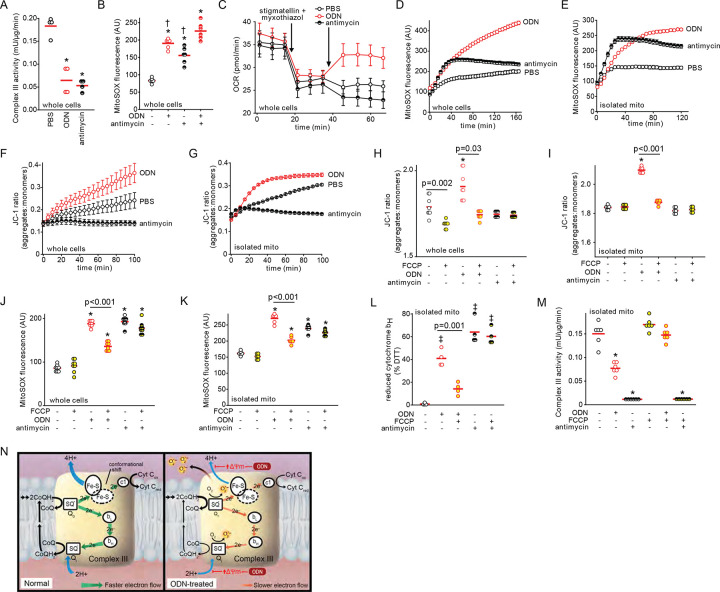
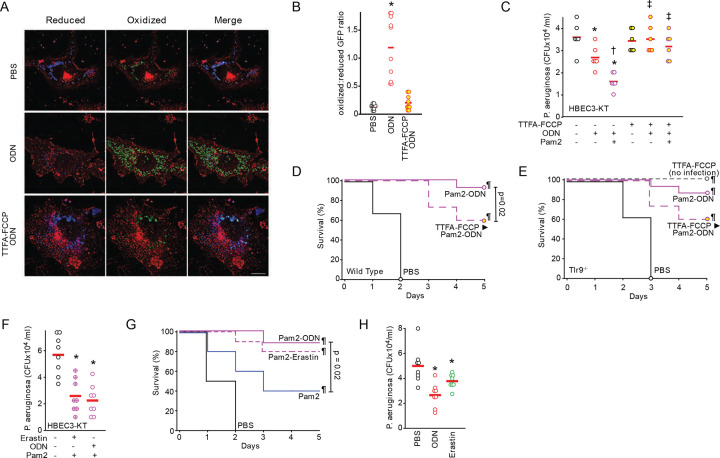
Pneumonia is a worldwide threat, making discovery of novel means to combat lower respiratory tract infections an urgent need. We have previously shown that manipulating the lungs' intrinsic host defenses by therapeutic delivery of a unique dyad of pathogen-associated molecular patterns protects mice against pneumonia in a reactive oxygen species (ROS)-dependent manner. Here we show that antimicrobial ROS are induced from lung epithelial cells by interactions of CpG oligodeoxynucleotides (ODNs) with mitochondrial voltage-dependent anion channel 1 (VDAC1) without dependence on Toll-like receptor 9 (TLR9). The ODN-VDAC1 interaction alters cellular ATP/ADP/AMP localization, increases delivery of electrons to the electron transport chain (ETC), enhances mitochondrial membrane potential (Δ Ψm ), and differentially modulates ETC complex activities. These combined effects promote leak of electrons from ETC complex III, resulting in superoxide formation. The ODN-induced mitochondrial ROS yield protective antibacterial effects. Together, these studies identify a therapeutic metabolic manipulation strategy that has the potential to broadly protect patients against pneumonia during periods of peak vulnerability without reliance on currently available antibiotics.

Author summary: Pneumonia is a major cause of death worldwide. Increasing antibiotic resistance and expanding immunocompromised populations continue to enhance the clinical urgency to find new strategies to prevent and treat pneumonia. We have identified a novel inhaled therapeutic that stimulates lung epithelial defenses to protect mice against pneumonia in a manner that depends on production of reactive oxygen species (ROS). Here, we report that the induction of protective ROS from lung epithelial mitochondria occurs following the interaction of one component of the treatment, an oligodeoxynucleotide, with the mitochondrial voltage-dependent anion channel 1. This interaction alters energy transfer between the mitochondria and the cytosol, resulting in metabolic reprogramming that drives more electrons into the electron transport chain, then causes electrons to leak from the electron transport chain to form protective ROS. While antioxidant therapies are endorsed in many other disease states, we present here an example of therapeutic induction of ROS that is associated with broad protection against pneumonia without reliance on administration of antibiotics.


Conflict of interest statement

Competing interests: MJT and SEE are authors on U.S. patent 8,883,174, “Stimulation of Innate Resistance of the Lungs to Infection with Synthetic Ligands.” MJT and SEE own stock in Pulmotect, Inc.

Figures

Fig. 1.
Fig. 1.. Induction of epithelial mtROS by CpG ODN.
(A) mtROS production from HBEC3-KT cells after treatment with pathogen associated molecular patterns. (B) mtROS production from HBEC3-KT cells after treatment with the indicated ODNs. mtROS production after treatment with ODN from mouse lung epithelial cell lines (C) and primary human (D) and primary mouse (E) lung epithelial cells. (F) Representative fluorescence images primary tracheal epithelial cells harvested from mt-roGFP mice treated with PBS or ODN. Images shown as gradient of color intensity from the reduced (blue) form to the oxidized (green) form of roGFP. Scale bar, 50 μm. (G) Ratio of the fluorescence intensity of the oxidized:reduced roGFP from F, quantified at 488 nm and 405 nm, respectively. (H) Oxygen consumption following the indicated treatment by Seahorse XFe96 Flux Analyzer, shown as mean ± SEM. (I) Mitochondrial membrane potential ΔΨm measurement in HBEC3-KT cells after ODN treatment. * p<0.001 vs. PBS by one-way ANOVA using Holm-Sidak method, except A which use Tukey method due to failed normality testing; † p<0.001 vs PBS by two-way Student’s t test. ODN, oligodeoxynucleotide; ISD, immune stimulating DNA; mTEC, primary mouse tracheal epithelial cells; NHBE, primary normal human bronchial epithelial cells; GFP, green fluorescent protein; OCR, oxygen consumption rate; TMRM, tetramethylrhodamine.
Fig. 2.
Fig. 2.. Mitochondrial energy metabolism altered by CpG ODN.
(A) Summary electron transport chain complex enzyme activity with ODN treatment of HBEC3-KT cells. (B) Mitochondrial protein immunoblots from lysates of cells treated with ODN. Relative abundance ATP (C), ADP (D), and AMP (E) in whole cell lysates at the indicated time points after ODN treatment. Relative abundance of NADH (F) an NADPH (G) in whole cells after ODN treatment. (H) Ratio of reduced:oxidized glutathione in HBEC3-KT cells treated with ODN. * p<0.003 vs PBS; † p<0.001 vs PBS. SDHB, succinate dehydrogenase subunit B; COX4, cytochrome c oxidase subunit IV; ATP5A, ATP synthase subunit alpha; CS, citrate synthase; VDAC1, voltage dependent anion channel 1; GSH, reduced glutathione; GSSG, oxidized glutathione.
Fig. 3.
Fig. 3.. Blocking mitochondrial nucleotide transition by CpG ODN leads to generation of antimicrobial mtROS.
(A) mtROS production and (B) ΔΨm increase in isolated mitochondria that were treated with Pam2, ODN or both. (C) Fluorescence intensity of mitochondria isolated from HBEC3-KT cells treated with FITC-labeled or unlabeled ODN. (D) Mitochondria were isolated from the biotinylated ODN-treated HBEC3-KT cells, and streptavidin precipitants from mitochondrial lysates were resolved by polyacrylamide gel electrophoresis and silver stained. Dashed line indicates bands excised for mass spectrometry analysis. As in D, streptavidin precipitants were probed for VDAC1 in mitochondrial lysates from (E) human or (F) mouse cells following treatment with ODN for the indicated time. Mitochondrial lysates from human cells were precipitated and probed for ANT1 (G) following treatment with ODN for the indicated time. (H) Representative images of HBEC3-KT cells treated with FITC-labeled ODN then stained with Alexa Fluor 555-labeled anti-VDAC1 antibody. Scale bar, 100 μm. (I) Measurements of cytosolic and mitochondrial levels of ATP, ADP & AMP in ODN-treated HBEC3-KT cells at the indicated times. Mitochondrial membrane potential ΔΨm (J) and mtROS (K) 100 min after HBEC3-KT treatment with the indicated mitochondrial permeability modulators. (L) Seahorse analysis of oxygen consumption following the indicated mitochondrial permeability modulators in oligomycin-inhibited HBEC3-KT cells, shown as mean ± SEM. * p<0.001 vs PBS by ANOVA; † p<0.001 vs unlabeled ODN by two-way Student’s t test. Mito, mitochondria; VDAC1, voltage dependent anion channel 1; ANT1, adenine nucleotide translocator 1; CsA, cyclosporin A; CAT, carboxyatractyloside; OCR, oxygen consumption rate.
Fig. 4.
Fig. 4.. AMPK-regulated metabolic reprogram increases electron delivery to complex II.
(A) RPPA heatmap from HBEC3-KT cells treated with PBS or ODN. (B) Immunoblot of AMPK and ACC proteins after ODN treatment. (C) Immunoblot for phospho-AMPKα1 following treatment with the indicated mitochondrial permeability modulators in HBEC3-KT cells. (D) Phospho-AMPK immunofluorescence in mouse lungs after treatment with ODN. Scale bar, 50 μm. (E) Quantification of fluorescence in D. (F) mtROS production in primary Prkaa1fl/fl;Prkka2fl/fl mouse tracheal epithelial cells infected with empty or Cre+ adenovirus, then treated with PBS or ODN. (G) Acetyl-CoA levels in ODN-treated HBEC3-KT cells. (H) Fatty acid oxidation after ODN treatment. (I) mtROS production following treatment with ODN and/or β-oxidation inhibitor etomoxir. (J) Oxygen consumption following the indicated treatments, shown as mean ± SEM. (K) HBEC3-KT cell complex II activity following treatment with the indicated agents.ODN-induced mtROS production in cells with knockdowns of gene CPT1A (L) and the genes for electron shuttles GPD2 (M) or ETFDH (N). (O) Ratio of reduced:oxidized CoQ in mitochondria isolated from HBEC3-KT cells treated with PBS or ODN. (P) Schematic model of mtROS formation induced by ODN via metabolic reprogramming. * p <0.01 vs 0 min; † p <0.001 vs. (syngeneic) PBS treated; ǂ p < 0.02 vs (syngeneic) PBS treated. RPPA, reverse phase protein array; AMPK, AMP-activating protein kinase; ACC, acetyl-CoA carboxylase; AdV, adenovirus; OCR, oxygen consumption rate; Scr, scrambled shRNA control; CPT1A, carnitine palmitoyltransferase 1A; GPD2, glycerol-3-phosphate dehydrogenase 2; ETFDH, electron transfer flavoprotein-ubiquinone dehydrogenase.
Fig. 5.
Fig. 5.. mtROS formation at complex III is ΔΨm-dependent.
(A) Electron transport chain complex III activity in HBEC3-KT cells 100 min after ODN or antimycin treatment. (B) mtROS production 100 min after the indicated treatments. (C) Oxygen consumption following the indicated treatments in stigmatellin and myxothiazol-inhibited HBEC3-KT cells, shown as mean ± SEM. Time course of mtROS generation following PBS, ODN or antimycin treatment in (D) HBEC3-KT cells or (E) isolated mitochondria. Time-dependent mitochondrial membrane potential in (F) HBEC3-KT cells or (G) isolated mitochondria. Mitochondrial membrane potential ΔΨm 100 min after ODN or antimycin treatments in (H) HBEC3-KT cells or (I) isolated mitochondria with or without FCCP pre-treatment. mtROS generation 100 min after ODN or antimycin treatments in (J) HBEC3-KT cells or (K) isolated mitochondria with or without FCCP pre-treatment. (L) Reduced mitochondrial complex III cytochrome bH levels following ODN or antimycin treatment with or without FCCP pre-treatment, expressed relative to DTT-treated mitochondria (DTT-treated presumed 100% reduced). (M) Complex III activity in isolated mitochondria 15 min after the indicated treatments. (N) Schematic model of ΔΨm-dependent mtROS formation at complex III. * p<0.001 vs PBS by ANOVA; † p<0.008 vs ODN + antimycin treated by ANOVA; ǂ p<0.02 vs PBS by ANOVA. mito, mitochondria; DTT, dithiothreitol.
Fig. 6.
Fig. 6.. mtROS induction stimulates antimicrobial responses.
(A) Representative fluorescence images primary tracheal epithelial cells harvested from mt-roGFP mice, pre-treated (or not) with TTFA and FCCP, then treated with PBS or ODN. Images shown as gradient of color intensity from the reduced (blue) form to the oxidized (green) form of roGFP. Scale bar, 50 μm. (B) Ratio of the fluorescence intensity of the oxidized:reduced roGFP from A, quantified at 488 nm and 405 nm, respectively. (C) Bacterial burden of HBEC3-KT cells treated with the indicated ligands with or without TTFA-FCCP treatment. (D) Survival of wild type mice challenged with P. aeruginosa one day after nebulized treatment with PBS or Pam2 and ODN with or without TTFA-FCCP (n=15 mice/group). (E) Survival of Tlr9−/− mice challenged with P. aeruginosa one day after nebulized treatment with PBS or Pam2 and ODN with or without TTFA-FCCP (n=15 mice/group). (F) Bacterial burden of HBEC3-KT cells treated with Pam2 and erastin or ODN. (G) Mouse survival of P. aeruginosa challenge given one day after nebulized treatment with the indicated agents (n=15 mice/group). (H) Mouse lung bacterial burden immediately after P. aeruginosa challenge following treatment with the indicated agents (n=4 mice/group). * p <0.02 vs PBS, † p< 0.05 vs ODN, ‡ p < 0.05 vs same ligand without TTFA-FCCP, ¶ P <0.0001 vs. PBS.

Similar articles

References

    1. Mizgerd JP. Lung infection--a public health priority. PLoS Med. 2006;3(2):e76. - PMC - PubMed
    1. File TM. Community-acquired pneumonia. Lancet. 2003;362(9400):1991–2001. - PMC - PubMed
    1. DALYs GBD, Collaborators H. Global, regional, and national disability-adjusted life-years (DALYs) for 333 diseases and injuries and healthy life expectancy (HALE) for 195 countries and territories, 1990–2016: a systematic analysis for the Global Burden of Disease Study 2016. Lancet. 2017;390(10100):1260–344. - PMC - PubMed
    1. Bjerre LM, Verheij TJ, Kochen MM. Antibiotics for community acquired pneumonia in adult outpatients. Cochrane Database Syst Rev. 2009(4):CD002109. - PubMed
    1. Niederman MS, Mandell LA, Anzueto A, Bass JB, Broughton WA, Campbell GD, et al. Guidelines for the management of adults with community-acquired pneumonia. Diagnosis, assessment of severity, antimicrobial therapy, and prevention. Am J Respir Crit Care Med. 2001;163(7):1730–54. - PubMed

Publication types