[Preprint]. 2023 Jan 13:2023.01.12.523776.
doi: 10.1101/2023.01.12.523776.

The psychosis risk factor RBM12 encodes a novel repressor of GPCR/cAMP signal transduction

Affiliations

The psychosis risk factor RBM12 encodes a novel repressor of GPCR/cAMP signal transduction

Khairunnisa M Semesta et al. bioRxiv. .

Update in

Abstract

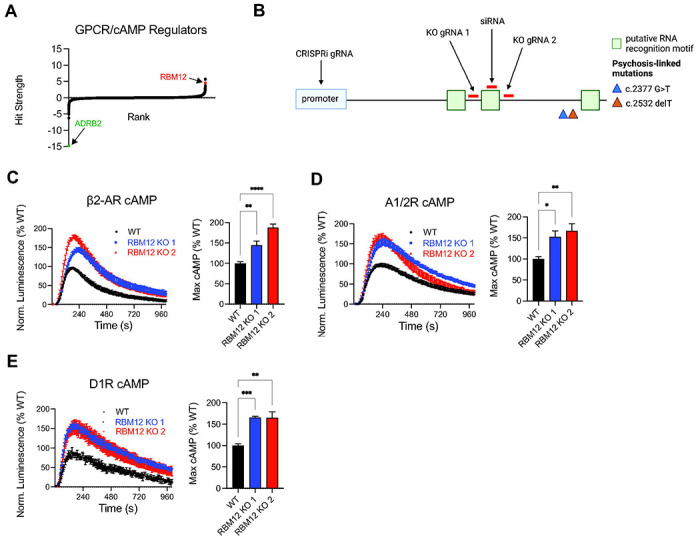
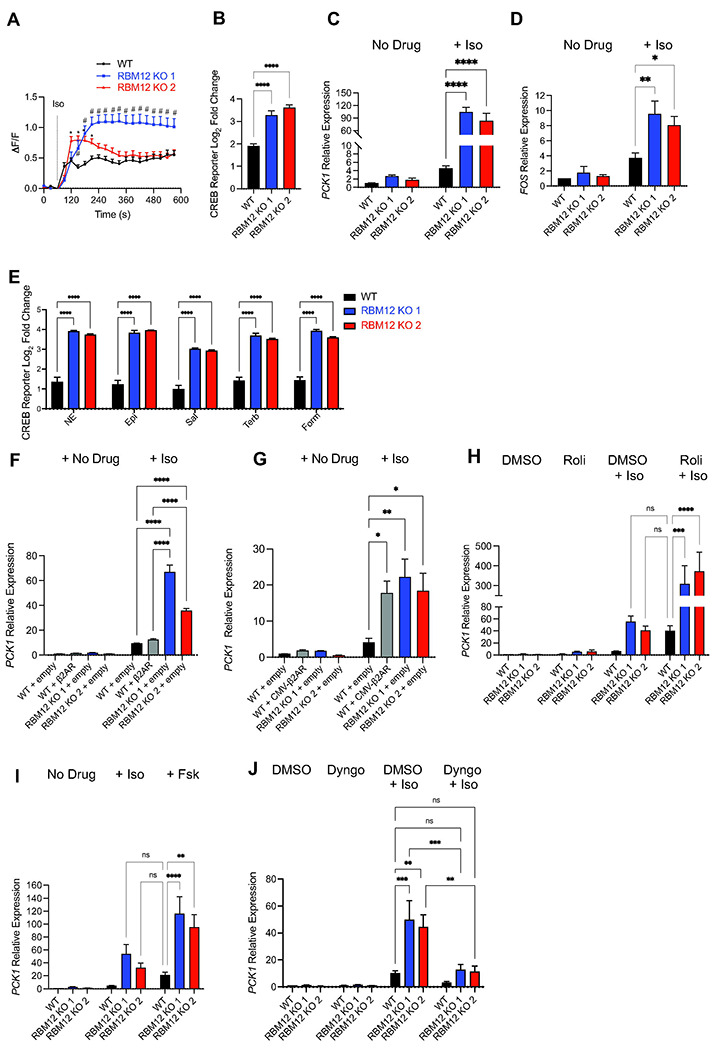
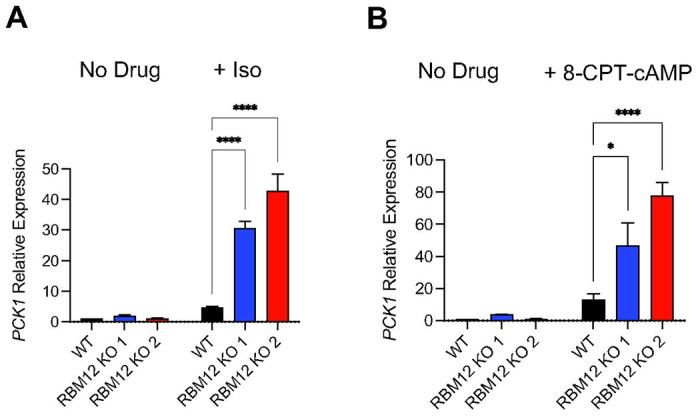
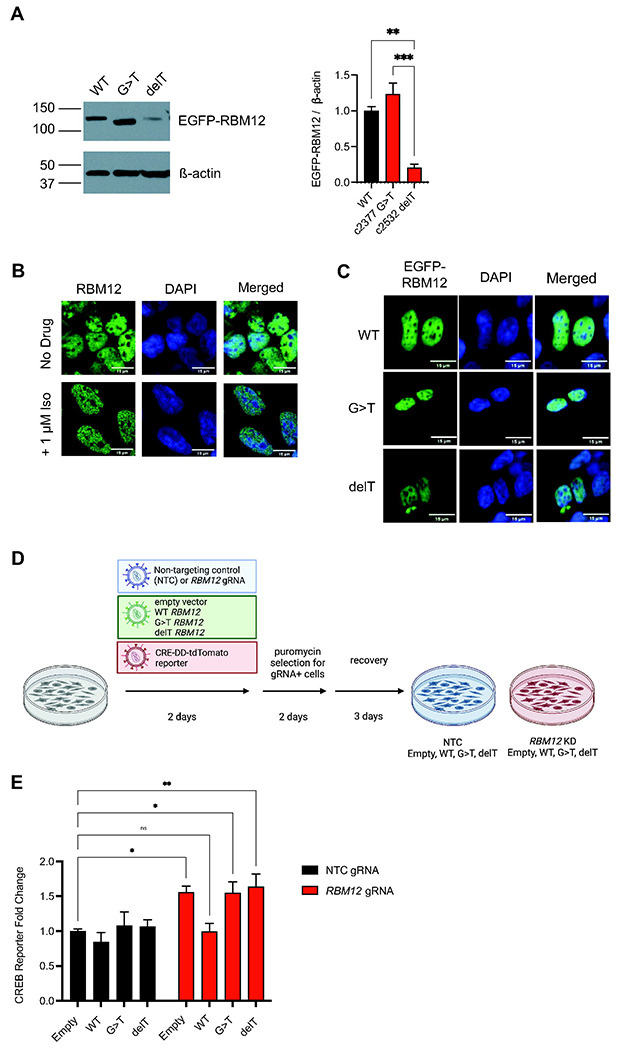
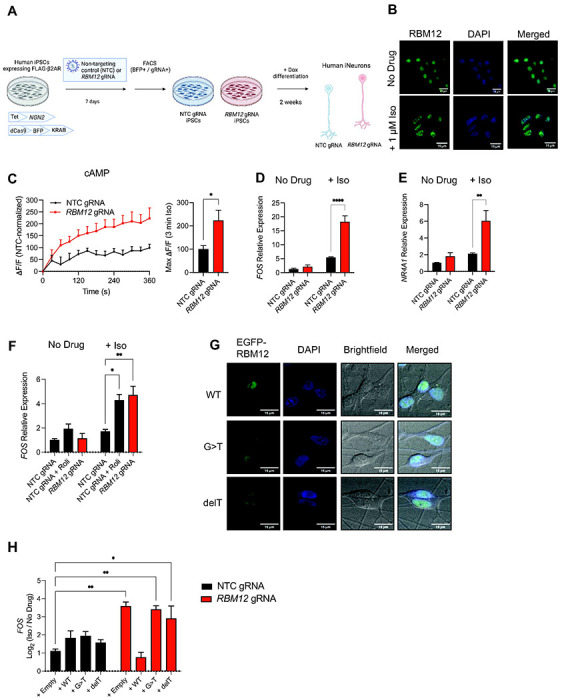
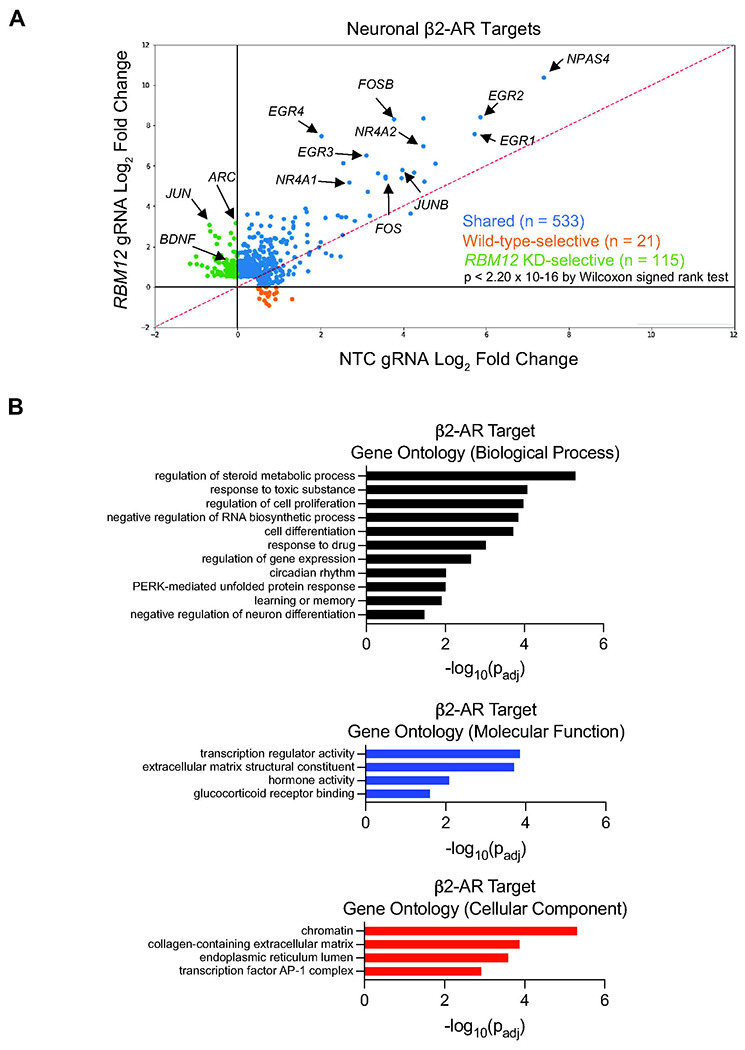
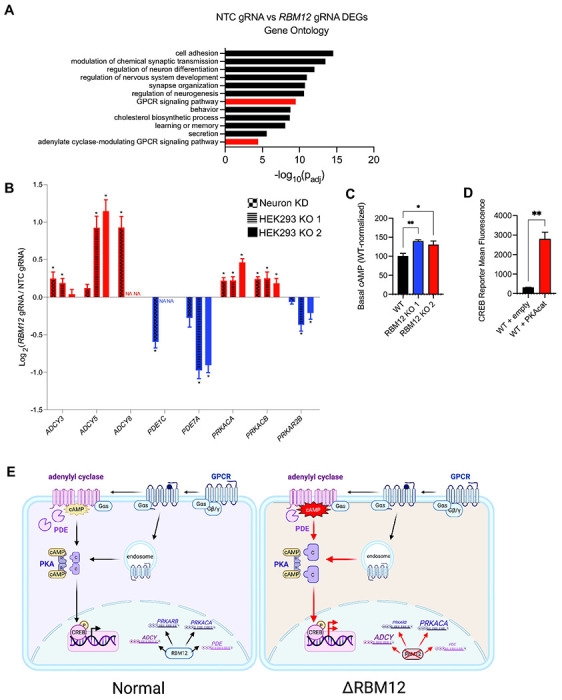
RBM12 is a high-penetrance risk factor for familial schizophrenia and psychosis, yet its precise cellular functions and the pathways to which it belongs are not known. We utilize two complementary models, HEK293 cells and human iPSC-derived neurons, and delineate RBM12 as a novel repressor of the G protein-coupled receptor/cyclic AMP/protein kinase A (GPCR/cAMP/PKA) signaling axis. We establish that loss of RBM12 leads to hyperactive cAMP production and increased PKA activity as well as altered neuronal transcriptional responses to GPCR stimulation. Notably, the cAMP and transcriptional signaling steps are subject to discrete RBM12-dependent regulation. We further demonstrate that the two RBM12 truncating variants linked to familial psychosis impact this interplay, as the mutants fail to rescue GPCR/cAMP signaling hyperactivity in cells depleted of RBM12. Lastly, we present a mechanism underlying the impaired signaling phenotypes. In agreement with its activity as an RNA-binding protein, loss of RBM12 leads to altered gene expression, including that of multiple effectors of established significance within the receptor pathway. Specifically, the abundance of adenylyl cyclases, phosphodiesterase isoforms, and PKA regulatory and catalytic subunits is impacted by RBM12 depletion. We note that these expression changes are fully consistent with the entire gamut of hyperactive signaling outputs. In summary, the current study identifies a previously unappreciated role for RBM12 in the context of the GPCR/cAMP pathway that could be explored further as a tentative molecular mechanism underlying the functions of this factor in neuronal physiology and pathophysiology.


Conflict of interest statement

Declaration of Interests

The authors declare no competing interests.

Figures

Figure 1.
Figure 1.. RBM12 loss leads to hyperactive GPCR/cAMP signaling.
(A) Genes (20,528) ordered by hit strength (product of phenotype score and -log1o(p-value)). Candidate repressors exhibit hit strength > 0, and candidate activators exhibit hit strength < 0 in a genome-wide CRISPR screen for GPCR/cAMP regulators. (B) Schematic of multiple strategies to deplete RBM12 in HEK293 using CRISPRi, RNAi, and CRISPR knockout, depicting positions of guide RNAs, siRNA, and RBM12 SNPs (c.2377G>T and c.2532delT) implicated in psychosis. (C) Luminescent GloSensor measurement of cAMP accumulation in response to (β2-AR agonist isoproterenol (Iso), 100 nM (n = 8). (D) Luminescent GloSensor measurement of cAMP accumulation in response to activation of A1/2R with 10 μM NECA (n = 8). (E) Luminescent GloSensor measurement of cAMP accumulation in response to D1R-selective agonist SKF-81297, 10 nM (n = 4). All data are mean ± SEM. Statistical significance was determined using one-way ANOVA with Dunnett’s correction. See also Figure S1.
Figure 2.
Figure 2.. RBM12 loss leads to increased PKA activity and supraphysiological CREB-dependent transcriptional responses.
(A) PKA sensor (ExRai-AKAR2) activity in response to 10 nM Iso (n = 24-47 cells from 3-4 independent transfections per cell line). # and * denote statistically significant timepoints between RBM12 KO1 vs. wild-type (WT) and K02 vs. wild-type (WT), respectively. (B) Flow cytometry measurement of fluorescent CREB transcriptional reporter (CRE-DD-zsGreen) in response to 1 μM Iso and 1 μM Shield, 4 hours (n = 17). (C) RT-qPCR analysis of the endogenous β2-AR transcriptional target mRNAs, PCK1 (n = 15) and (D) FOS (n = 9) in untreated cells or in cells treated with 1 μM Iso for 1 hour. (E) Flow cytometry measurement of the fluorescent CREB transcriptional reporter (CRE-DD-zsGreen) in response to a panel of endogenous (10 μM norepinephrine/NE, 10 μM epinephrine/Epi) or synthetic (10 μM salbutamol/Sal, 10 μM terbutaline/Terb, 50 nM formoterol/Form) β2-M agonists and 1 μM Shield for 4 hours (n = 5). (F-G) PCK1 mRNA expression in untreated or 1 μM Iso-treated cells transfected with empty plasmid (n = 3), (F) plasmid construct expressing lower levels of β2AR (n = 3), or (G) plasmid expressing β2AR from a CMV promoter (n = 3). (H) PCK1 mRNA expression in untreated or 1 μM Iso-treated cells for 1 hour in the presence of either vehicle (DMSO) or 10 μM of the PDE4 inhibitor Rolipram (n = 4-5). (I) RT-qPCR of PCK1 mRNA in untreated cells or cells treated with 1 μM Iso-treated cells or 10 μM forskolin for 1 hour (n = 12-13). (J) PCK1 mRNA expression in cells pretreated with either vehicle (DMSO) or 30 μM Dyngo-4A for 20 min, then treated with 1 μM Iso for 1 hour (n = 5). All data are mean ± SEM. Statistical significance was determined using multiple unpaired t-tests with Benjamini, Krieger and Yekutieli false discovery rate correction (A), one-way ANOVA with Dunnett’s correction (B) or two-way ANOVA with Tukey’s correction (C-J). See also Figure S2.
Figure 3.
Figure 3.. RBM12 independently impacts the cAMP and transcriptional signaling steps.
(A) PCK1 mRNA expression in untreated cells or in cells treated with either 1 μM isoproterenol (wild-type cells) or 10 nM isoproterenol (RBM12 knockout cells) for 1 hour (n = 3). (B) PCK1 mRNA expression in untreated cells or in cells treated with 150 μM 8-CPT-cAMP for 1 hour (n = 4). All data are mean ± SEM. Statistical significance was determined using two-way ANOVA with Tukey’s correction (A-B). See also Figure S3.
Figure 4.
Figure 4.. Expression of disease-associated variants in RBM12 knockdown cells does not rescue the hyperactive GPCR-dependent transcriptional signaling.
(A) Western blot analysis of EGFP-tagged wild-type, c.2377G>T and c.2532delT RBM12 (n = 3) probed with antibody recognizing EGFP. All data are normalized relative to wild-type. (B) Fixed cell fluorescence microscopy analysis of endogenous RBM12 in untreated and stimulated (1 μM Iso for 20 minutes) HEK293 cells. (C) Localization of EGFP-tagged wild-type, c.2377G>T or c.2532delT RBM12 by fluorescence microscopy. (D) Schematic of the flow cytometry-based rescue experiment. (E) Flow cytometry measurement of the fluorescent CREB transcriptional reporter (CRE-DD-tdTomato) in response to 1 μM Iso and 1 μM Shield for 6 hours (n = 8-11). Data are normalized relative to the “NTC + empty vector” sample values. All data are mean ± SEM. Statistical significance was determined using one-way ANOVA (A) or two-way ANOVA with Dunnett’s correction (E). See also Figure S4.
Figure 5.
Figure 5.. Signaling hyperactivity upon loss of RBM12 in human iPSC-derived neurons.
(A) Schematic of the CRISPRi-mediated RBM12 depletion in human iPSC-derived neurons. (B) Fixed cell fluorescence microscopy imaging of native RBM12 in untreated and stimulated (1 μM Iso for 30 minutes) iNeurons. (C) Accumulation of the fluorescent cADDis sensor in NTC- and RBM12 gRNA-expressing neurons in response to 1 μM Iso (n = 6). (D) Expression of FOS and (E) NR4A1 mRNAs in response to treatment with 1 μM Iso for 1 hour by RT-qPCR (n = 6). (F) Expression of FOS mRNA in response to 1 μM Iso in the presence of either vehicle (DMSO) or 10 μM Rolipram in neurons treated for 1 hour (n = 3). (G) Expression of EGFP-tagged wild-type, c.2377G>T or c.2532delT RBM12 by fluorescence microscopy. (H) Expression of FOS mRNA in response to stimulation with 1 μM Iso for 1 hour in neurons transduced with empty plasmid or plasmid encoding WT, G>T, or delT EGFP-RBM12 (n = 2-3). All data are mean ± SEM. Statistical significance was determined using unpaired t-test (C) or two-way ANOVA with Tukey’s correction (D-F, H). See also Figure S5.
Figure 6.
Figure 6.. RBM12 loss impacts the β2-AR neuronal transcriptional responses.
(A) Scatter plot showing gene fold induction (log2 Iso/No Drug) of neuronal β2-AR targets (n = 669) identified by RNA-seq analysis (n = 3 per cell line per drug condition). Blue dots represent genes that were induced by a 1-hour treatment with 1 μM Iso in both wild-type (NTC gRNA) and RBM12 KD (RBM12 gRNA) neurons. Orange dots represent genes that were induced only in wild-type and unchanged or downregulated in RBM12 KD neurons. Green dots represent genes that were induced only in RBM12 KD neurons and unchanged or downregulated in wild-type. Indicated by arrows are a subset of genes with established roles in neuronal activity. The underlying information is summarized in Table 1. (B) Gene Ontology categories enriched among the neuronal β2-AR targets from (A). The underlying information is presented in Table 2. See also Figure S6.
Figure 7.
Figure 7.. RBM12 regulates the expression of multiple GPCR/cAMP effectors.
(A) Gene ontology analysis of differentially expressed genes between wild-type and RBM12 KD neurons (n = 2,645 genes). (B) Graph summarizing abundance changes (log2 fold change RBM12 gRNA/NTC gRNA) of known GPCR/cAMP regulators in wild-type and RBM12 KD neurons (n = 3 per cell line) and HEK293 (n = 7 in wild-type cells and n = 3 per knockout cell line). Asterisks denote statistical significance (padj < 5.0 x 10⁻² by Wald test). “NA” denotes genes not expressed in HEK293. (C) Basal cAMP levels in wild-type and HEK293 RBM12 knockouts measured using ELISA assay (n = 5). All values are normalized relative to wild-type. (D) Flow cytometry measurement of the fluorescent CREB transcriptional reporter (CRE-DD-zsGreen) in wild-type cells expressing either empty plasmid or plasmid encoding PKAcat following stimulation with 1 μM Iso and 1 μM Shield for 4 hours (n = 3). (E) Model of RBM12-dependent regulation of the GPCR/cAMP signaling pathway. All data are mean ± SEM. Statistical significance was determined using adjusted p-value corrected for multiple testing by Wald test (B), one-way ANOVA with Dunnett’s correction (C), or unpaired t-test (D).

References

    1. Hauser A. S., Attwood M. M., Rask-Andersen M., Schiöth H. B. & Gloriam D. E., Trends in GPCR drug discovery: new agents, targets and indications. Nat Rev Drug Discov 16, 829–842, doi: 10.1038/nrd.2017.178 (2017). - DOI - PMC - PubMed
    1. Moore C. A., Milano S. K., & Benovic J. L., Regulation of receptor trafficking by GRKs and arrestins. Annu Rev Physiol 69, 451–482, doi: 10.1146/annurev.physiol.69.022405.154712 (2007). - DOI - PubMed
    1. Weis W. I., & Kobilka B. K., The Molecular Basis of G Protein-Coupled Receptor Activation. Annual Review of Biochemistry 87, 897–919, doi: 10.1146/annurev-biochem-060614-033910 (2018). - DOI - PMC - PubMed
    1. Plouffe B., Thomsen A. R. B. & Irannejad R., Emerging Role of Compartmentalized G Protein-Coupled Receptor Signaling in the Cardiovascular Field. ACS Pharmacology & Translational Science 3, 221–236, doi: 10.1021/acsptsci.0c00006 (2020). - DOI - PMC - PubMed
    1. Jong Y. I., Harmon S. K. & O’Malley K. L., GPCR signalling from within the cell. Br J Pharmacol 175, 4026–4035, doi: 10.1111/bph.14023 (2018). - DOI - PMC - PubMed

Publication types