[Preprint]. 2023 Jan 14:2023.01.13.523097.
doi: 10.1101/2023.01.13.523097.

Conserved Roles for the Dynein Intermediate Chain and Ndel1 in Assembly and Activation of Dynein

Affiliations

Conserved Roles for the Dynein Intermediate Chain and Ndel1 in Assembly and Activation of Dynein

Kyoko Okada et al. bioRxiv. .

Update in

Abstract

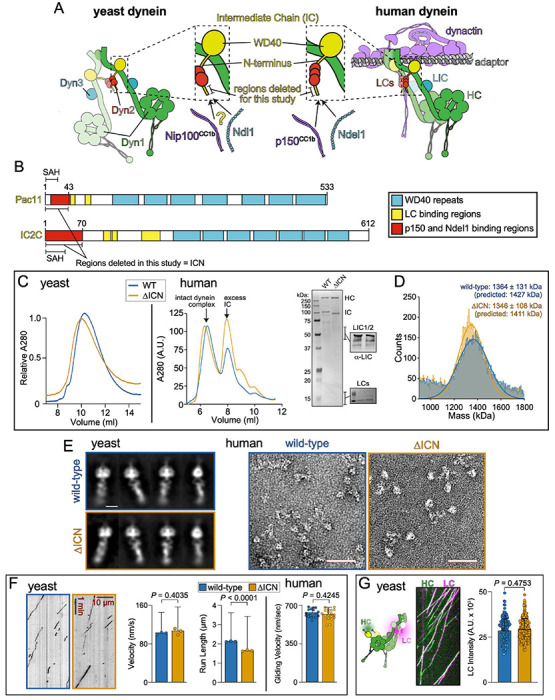
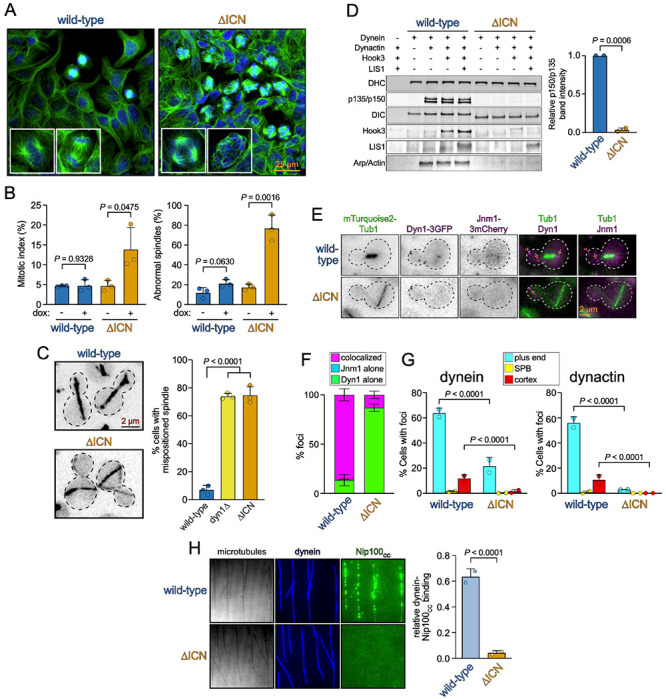
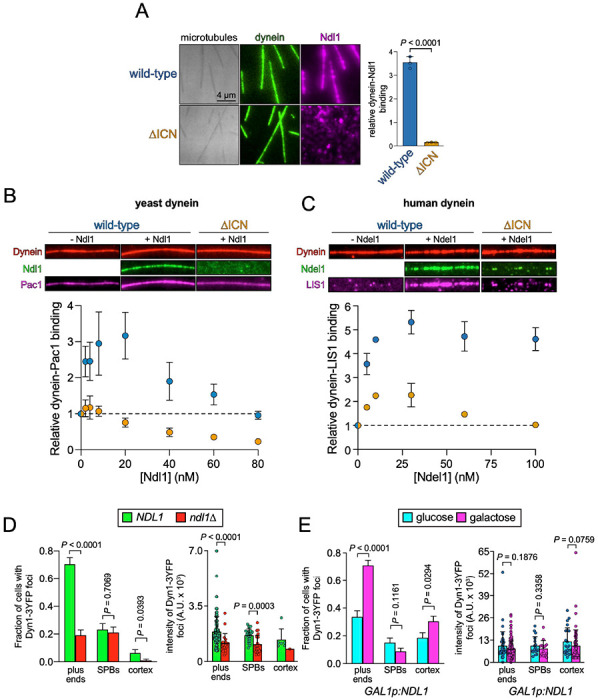
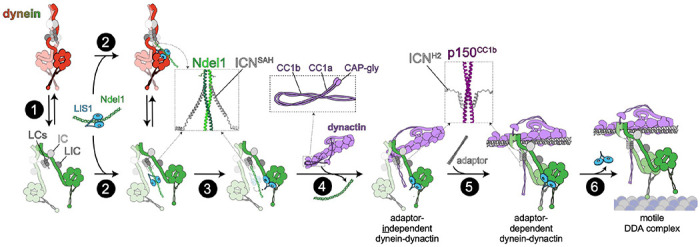
Cytoplasmic dynein, the primary retrograde microtubule transport motor within cells, must be activated for processive motility through the regulated assembly of a dynein-dynactin-adapter (DDA) complex. The interaction between dynein and dynactin was initially ascribed to the N-terminus of the dynein intermediate chain (IC) and a coiled-coil of the dynactin subunit p150 Glued . However, cryo-EM structures of DDA complexes have not resolve these regions of the IC and p150 Glued , raising questions about the importance of this interaction. The IC N-terminus (ICN) also interacts with the dynein regulators Nde1/Ndel1, which compete with p150 Glued for binding to ICN. Using a combination of approaches, we reveal that the ICN plays critical, evolutionarily conserved roles in DDA assembly by interacting with dynactin and Ndel1, the latter of which recruits the DDA assembly factor LIS1 to the dynein complex. In contrast to prior models, we find that LIS1 cannot simultaneously bind to Ndel1 and dynein, indicating that LIS1 must be handed off from Ndel1 to dynein in temporally discrete steps. Whereas exogenous Ndel1 or p150 Glued disrupts DDA complex assembly in vitro , neither perturbs preassembled DDA complexes, indicating that the IC is stably bound to p150 Glued within activated DDA complexes. Our study reveals previously unknown regulatory steps in the dynein activation pathway, and provides a more complete model for how the activities of LIS1/Ndel1 and dynactin/cargo-adapters are integrated to regulate dynein motor activity.


Conflict of interest statement

Competing interest statement

The authors have no competing interests to declare.

Figures

Figure 1.
Figure 1.. Deletion of the intermediate chain N-terminus has no effect on dynein complex integrity or function.
A Cartoon depicting the yeast and metazoan dynein complexes with (right) and without (left) the activating cargo adaptor and dynactin. Inset depicts heavy chain- (HC) and light chain (LC)-bound intermediate chain (IC) with N-terminus (ICN) highlighted. Previous studies suggested that the ICN is an interaction site for both coiled-coil 1b (CC1b) of p150 (Nip100 in yeast) and Ndel1 (Ndl1 in yeast). B Schematic of ICs from budding yeast (Pac11) and humans (Dync1I2/IC2C) with domains indicated. SAH, single alpha-helix identified by NMR studies (Morgan et al., 2011).C Analytical size exclusion chromatography of wild-type (WT) and dyneinΔICN complexes purified from yeast and human cells, along with coomassie-stained gel and immunoblots of human dynein depicting the presence of HC, IC, LIC, and LCs. Data are representative of five independent replicates. D Mass photometric analysis of purified human dynein complexes indicate masses correspond to those expected. E Negative stain electron micrographs reveal intact dynein complexes from yeast (2D class averages shown; scale bar, 10 nm) and human (raw images shown; scale bars, 50 nm). F Representative kymographs, and plots (mean ± SD, along with mean values from individual replicates for single molecule data, with circles representing all data points for gliding velocity; mean value for run length was determined by fitting raw data to one phase decay) depicting motility parameters for purified yeast (using single molecule assays; n = 183/177/174 WT, and 183/177/208 ΔICN motors from 3 independent replicates; P values were calculated using a Mann-Whitney test) and human (via microtubule-gliding assays) dynein reveal similar motility parameters between WT and dyneinΔICN complexes (n = 20/20 microtubules for either WT or dyneinΔICN from 2 replicates; P value calculated using two-tailed t-test). G Representative kymograph depicting two-color single molecule motility assay in which yeast dynein HC (HaloTagJFX49-Dyn1) and LC (Dyn2-S6LD650) are visualized together. Plot (mean ± SD, along with all data points) depicts fluorescence intensity values for single molecules of Dyn2 bound to either WT or dyneinΔICN, indicating the mutant binds to the same number of LCs as the WT complex (n = 101/100 and 101/100 Dyn2 foci from WT and dyneinΔICN motors, respectively, from 2 independent replicates, represented by different shades of blue and orange). P value was calculated using a Mann-Whitney test.
Figure 2.
Figure 2.. The dynein intermediate chain N-terminus is required for in-cell dynein function and DDA assembly.
A Representative fluorescence images of Flp-In T-REx 293 cells inducibly expressing either WT or IC2CΔICN after being fixed and processed for immunofluorescence. B Plots (mean ± SD, along with mean values for individual replicates) depicting fractions of cells in mitosis (mitotic index, left), or those with abnormal spindles (right) for uninduced cells (minus doxycycline), or those induced to express WT or IC2CΔICN (plus doxycycline; n = 717/16/25 uninduced WT cells, 802/50/27 induced WT cells, 1243/29/27 uninduced IC2CΔICN cells, and 1150/45/33 induced IC2CΔICN cells, from 3 independent replicates; P values were calculated using two-tailed t-test). C Representative inverse fluorescence images of cells expressing fluorescent tubulin (mRuby2-Tub1 for WT and mTurquoise2-Tub1 for dyneinΔICN), and plot (mean ± SD, along with values from individual replicates) depicting fractions of cells exhibiting mispositioned anaphase spindles (n = 53/56/49 WT cells, 38/56/61 dyn1Δ cells, and 49/66/69 pac11ΔICN cells from 3 independent replicates). P values were generated by calculating Z score (see Materials and Methods). D Immunoblots and plot (mean ± SD, n = 2) depicting relative degree of dynein-dynactin-Hook3 (DDH) assembly as a consequence of mutation (i.e., WT vs ΔICN) or addition of factors (i.e., Hook3, LIS1). P value was calculated using a two-tailed t-test. E Representative fluorescence images of cells expressing fluorescent tubulin (mTurquoise2-Tub1), Jnm1-3mCherry (homolog of human p50/dynamitin), and either WT or dyneinΔICN-3GFP (arrows, plus end foci; arrowhead, cortical focus). F Plot depicting degree of colocalization for indicated foci in WT or Pac11ΔICN cells (mean ± SD; n = 221/193 foci in WT cells, and 57/38 foci in pac11ΔICN cells from 2 independent replicates). G Plots (mean ± SD, along with mean values from individual replicates) depicting fractions of cells exhibiting indicated foci (Dyn1-3GFP, dynein; Jnm1-3mCherry, dynactin) at indicated subcellular locale (plus end, SPB, or cortex) in WT or pac11ΔICN cells (Dyn1: n = 266/265 WT cells and 208/200 pac11ΔICN cells from 2 independent replicates; Jnm1: n = 266/265 WT cells and 208/200 pac11ΔICN cells from 2 independent replicates). P values were generated from calculating Z scores. H Representative images (interference reflection microscopy for microtubules, fluorescence for dynein and Nip100CC1) and quantitation depicting degree to which Nip100CC1 binds WT and dyneinΔICN (mean ± SD, along with mean values from individual replicates; n = 20 microtubules for each, from 2 independent replicates). P value was calculated using an unpaired two-tailed Welch’s t-test.
Figure 3.
Figure 3.. ICN-bound Ndel1/Ndl1 recruits LIS1/Pac1 to promote in-cell dynein localization.
A Representative images (interference reflection microscopy for microtubules, fluorescence for dynein and Ndl1) and quantitation (mean ± SD, along with mean values from individual replicates) depicting role of ICN in dynein-Ndl1 binding (n = 30 microtubules for each, from 3 independent replicates). P value was calculated using an unpaired two-tailed Welch’s t-test. B and C Representative fluorescence images and quantitation (mean ± SD; dashed line indicates relative dynein-Pac1/LIS1 binding in the absence of Ndl1/Ndel1) depicting relative dynein-Pac1 (B) or LIS1 (C) binding. Binding was determined from relative intensity values for microtubule-associated Pac1 or LIS1 with respect to dynein. Note that buffer conditions were used such that neither Pac1, LIS1, Ndl1, nor Ndel1 was recruited to microtubules in the absence of dynein. Thus, the degree of microtubule localization for Pac1, LIS1, Ndl1 and Ndel1 is directly proportional to the extent of their dynein binding (B: n = 10/10/10 microtubules for WT, and 10/10/10 microtubules for dyneinΔICN, from 3 independent replicates; C: n = 53/50, 52/45, 56/56, 56/56, 52/72, 56/61 microtubules for WT, and 52/56, 58/53, 51/59, 54/71, 52/52, 55/57 microtubules for dyneinΔICN, mean ± SD from 2 independent replicates). D and E Plots (mean ± SD, as well as all data points for intensity values) depicting the extent of dynein localization (i.e., Dyn1-3GFP) in cells with and without Ndl1 (D: n = 95 NDL1 and 105 ndl1Δ cells, and 119 and 48 foci from NDL1 and ndl1Δ cells, respectively, all from 2 independent replicates), or with and without overexpressed Ndl1 (E: n = 113 uninduced, and 148 induced cells, and 82 and 245 foci from uninduced and induced cells, respectively, all from 2 independent replicates). P values were calculated using a Mann-Whitney test, or by calculating Z scores. For cells in panel E, which were engineered to possess a GAL1 promoter upstream of the NDL1 locus, Ndl1 overexpression was controlled by the exclusion or inclusion of galactose in the media for 3 hours immediately prior to imaging.
Figure 4.
Figure 4.. Dynein and Ndel1/Ndl1 compete for binding to LIS1/Pac1.
A and B Alphafold2-Multimer models of 2 Ndl1CC:2 Pac1WD40 (A) or 2 Ndel1CC:2 LIS1WD40 (B) complexes (DBD, dynein-binding domain, as determined by mutagenesis (Wang and Zheng, 2011), see Fig. S3). Insets highlight residues on each protein mutated in this study or others (Gutierrez et al., 2017; Toropova et al., 2014; Wang and Zheng, 2011)). C and D Mass photometric analysis of individual proteins, or mixtures of proteins. Fits of mean mass values for each species, and relative fraction of particles (indicated on all plots for complexes) with indicated mass, are shown. Although the majority of species were comprised of 1:1 complexes, a minor but reproducible population of 2 Pac1:1 Ndl1 were apparent in all experiments with yeast proteins only (also see Fig. S3E and F). E Mass photometry of the human GST-dimerized dynein motor domain (depicted in cartoon schematic) with and without LIS1 and NdelCC. F Representative fluorescence images and quantitation depicting relative binding between microtubule-bound dynein-dynactin-BicD2 complexes (DDB) and LIS1 ± Ndel1CC in the presence of AMPPNP (n = 88/71 microtubules for chambers without Ndel1CC, and 57/68 microtubules for those with Ndel1CC, from 2 independent replicates. P value calculated using one-way ANOVA test). G and H Plots depicting the extent of dyneinMOTOR localization in cells with and without Ndl1 (G; n = 129 NDL1 and 127 ndl1Δ cells, and 113 and 130 foci from NDL1 and ndl1Δ cells, respectively, all from 2 independent replicates), or with and without overexpressed Ndl1 (E; n = 60 uninduced, and 69 induced cells, and 116 and 114 foci from uninduced and induced cells, respectively, all from 2 independent replicates). P values were calculated using a Mann-Whitney test, or by calculating Z scores. For cells in panel H, which were engineered to possess a GAL1 promoter upstream of the NDL1 locus, Ndl1 overexpression was controlled by the exclusion or inclusion of galactose in the media for 3 hours immediately prior to imaging. Cartoon schematic in H depicts the proposed manner by which Ndl1 competes Pac1 away from dyneinMOTOR.
Figure 5.
Figure 5.. Excess p150CC1 and Ndel1 competitively inhibit DDA assembly but do not perturb preassembled complexes.
A The fraction of cells with a mispositioned spindle are plotted (mean ± SD, along with values from individual replicates; n = 53/64/44 WT + galactose cells, 26/62/31 + glucose Gal1p:Nip100CC1cells, and 50/60/43 + galactose Gal1p:Nip100CC1 cells, all from 3 independent replicates). P values were generated by calculating Z scores. B Representative fluorescence images of Nip100CC1-overexpressing cells (after growth in galactose-containing media) depicting localization of Nip100CC1 within cells (arrows, plus end foci; arrowheads, SPB foci). C Cartoon schematic depicting experimental strategy to assess DDA complex formation in the absence or presence of indicated recombinant proteins, added either prior to addition of Hook3 to lysates, or 60 minutes thereafter. D - F Immunoblots and plots depicting relative degree of DDH assembly as a consequence of addition of indicated wild-type factors (D and E), or indicated mutant Ndel1CC (F). G Representative kymographs from two-color movies depicting motility of 30 nM DDH complexes (assembled as indicated in panel C) in the presence of indicated concentration of fluorescent p150CC1 or Ndel1. Note the low frequency of comigration of p150CC1 and Ndel1 with DDH. H Plot (mean ± SD, along with values from independent replicates) depicting frequency of comigration of p150CC1 or Ndel1 with DDH complexes (n = 646/837/698/539/542/243, 512/1020/449/646/670/558, 775/664/978/486/412/516, 2188/860/770/328/537/349 processively migrating DDH particles for 30 nM and 150 nM p150CC1, 30 nM and 150 nM Ndel1, respectively. P values were calculated using one-way ANOVA).
Figure 6.
Figure 6.. Model for dynein activation.
1 Dynein stochastically switches between the autoinhibited ‘phi’ and open states. 2 Ndel1 binding to the ICN SAH (Nyarko et al., 2012), which binds equally well to the phi and open states (Fig. S4A), recruits LIS1 to dynein. 3 An unknown mechanism leads to LIS1 unbinding from Ndel1, and binding to open dynein, thus stabilizing this conformation. 4 Interactions between H2 of the ICN and p150CC1b (Morgan et al., 2011; Nyarko et al., 2012) competitively inhibit ICN-Ndel1 binding (McKenney et al., 2011), initiate dynein-dynactin binding (independent of a cargo adaptor), and potentially relieves dynactin autoinhibition (the latter of which is due to interactions between p150CC1 and the pointed end complex) (Lau et al., 2021). 5 Binding of a cargo adaptor to the adaptor-independent dynein-dynactin complex, which requires ICN-p150 binding, leads to assembly of the active dynein-dynactin-adaptor (DDA) complex. Insets show AF2 models of human ICN with either Ndel1 or p150CC1. Note that data suggests that the ICN-p150 interaction involves both the SAH and H2 of ICN (Nyarko et al., 2012), but only the AF2 predicted H2-p150 interaction is shown here. 6 Coincident with microtubule binding, LIS1 dissociates (Ton et al., 2022), and the active DDA complex processively transports cargoes along microtubules.

Similar articles

References

    1. Alkuraya F.S., Cai X., Emery C., Mochida G.H., Al-Dosari M.S., Felie J.M., Hill R.S., Barry B.J., Partlow J.N., Gascon G.G., et al. (2011). Human mutations in NDE1 cause extreme microcephaly with lissencephaly [corrected]. Am J Hum Genet 88, 536–547. - PMC - PubMed
    1. Amos L.A. (1989). Brain dynein crossbridges microtubles into bundles. J Cell Sci 93, 19–28. - PubMed
    1. Bakircioglu M., Carvalho O.P., Khurshid M., Cox J.J., Tuysuz B., Barak T., Yilmaz S., Caglayan O., Dincer A., Nicholas A.K., et al. (2011). The essential role of centrosomal NDE1 in human cerebral cortex neurogenesis. Am J Hum Genet 88, 523–535. - PMC - PubMed
    1. Baumbach J., Murthy A., McClintock M.A., Dix C.I., Zalyte R., Hoang H.T., and Bullock S.L. (2017). Lissencephaly-1 is a context-dependent regulator of the human dynein complex. eLife 6. - PMC - PubMed
    1. Bradshaw N.J., Soares D.C., Carlyle B.C., Ogawa F., Davidson-Smith H., Christie S., Mackie S., Thomson P.A., Porteous D.J., and Millar J.K. (2011). PKA phosphorylation of NDE1 is DISC1/PDE4 dependent and modulates its interaction with LIS1 and NDEL1. J Neurosci 31, 9043–9054. - PMC - PubMed

Publication types