[Preprint]. 2023 Jan 12:rs.3.rs-2318750.
doi: 10.21203/rs.3.rs-2318750/v1.

Statin prevents cancer development in chronic inflammation by blocking interleukin 33 expression

Affiliations

Statin prevents cancer development in chronic inflammation by blocking interleukin 33 expression

Jong Ho Park et al. Res Sq. .

Update in

Abstract

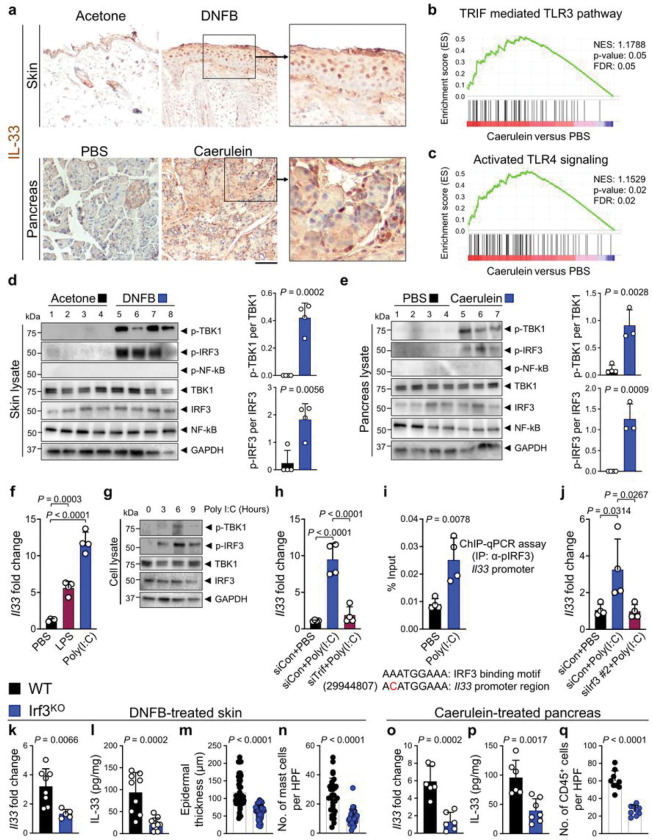
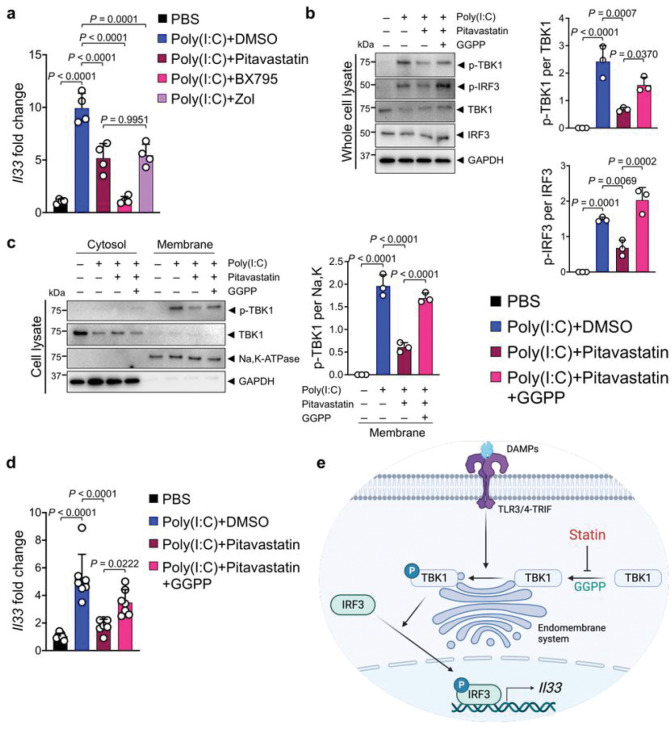
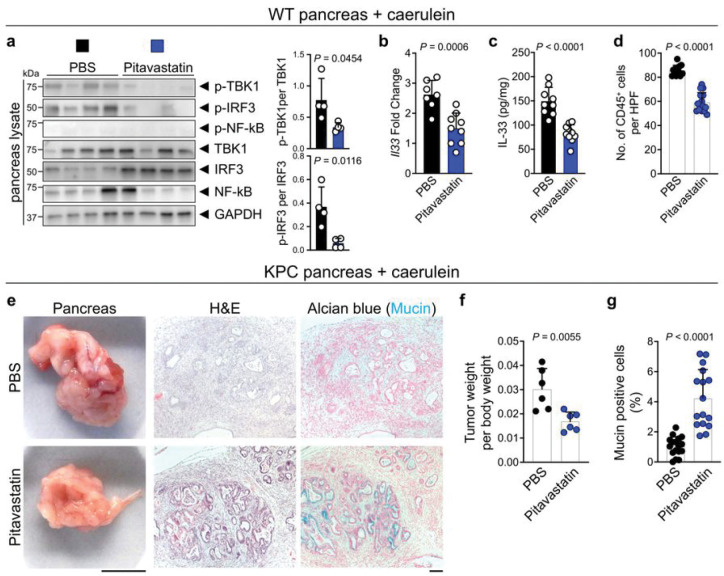
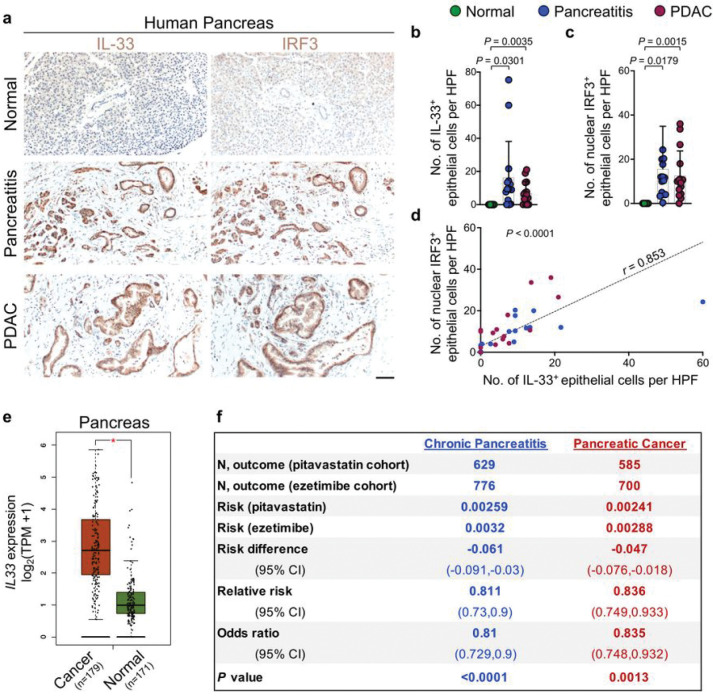
Chronic inflammation is a major cause of cancer worldwide. Interleukin 33 (IL-33) is a critical initiator of cancer-prone chronic inflammation; however, its induction mechanism by the environmental causes of chronic inflammation is unknown. Herein, we demonstrate that Toll-like receptor (TLR)3/4-TBK1-IRF3 pathway activation links environmental insults to IL-33 induction in the skin and pancreas. FDA-approved drug library screen identified pitavastatin as an effective IL-33 inhibitor by blocking TBK1 membrane recruitment/activation through the mevalonate pathway inhibition. Accordingly, pitavastatin prevented chronic pancreatitis and its cancer sequela in an IL-33-dependent manner. IRF3-IL-33 axis was highly active in chronic pancreatitis and its associated pancreatic cancer in humans. Interestingly, pitavastatin use correlated with a significantly reduced risk of chronic pancreatitis and pancreatic cancer in patients. Our findings demonstrate that blocking the TBK1-IRF3 signaling pathway suppresses IL-33 expression and cancer-prone chronic inflammation. Statins present a safe and effective therapeutic strategy to prevent chronic inflammation and its cancer sequela.

Keywords: Interleukin-33; TBK1-IRF3 pathway; cancer prevention; chronic inflammation; chronic pancreatitis; pancreatic cancer; pitavastatin.


Conflict of interest statement

COMPETING OF INTEREST JHP and SD are coinventors on a filed patent for the use of IL-33 inhibition in the treatment of cancer, fibrosis, and inflammation (PCT/US21/40725), which is licensed to DermBiont Inc. AM is an equity holder of DermBiont Inc. The remaining authors state no conflict of interest.

Figures

Figure 1
Figure 1. TBK1-IRF3 signaling induces IL-33 expression in chronic inflammation.
a, Representative images of IL-33 immunostaining on DNFB-treated skin and caerulein-treated pancreas compared with the acetone and PBS-treated controls, respectively. Note the nuclear IL-33 stains in the epithelial cells of the inflamed organs. b, The enrichment plot of TRIF mediated TLR3 signaling gene set in caerulein-treated compared with PBS-treated pancreas. c, The enrichment plot of activated TLR4 signaling gene set in caerulein-treated compared with PBS-treated pancreas. d, (Left) Immunoblot of p-TBK1, p-IRF3, p-NF-κB, TBK1, IRF3, NF-κB and GAPDH proteins in DNFB- versus acetone-treated WT skin (n=4 in each group). (Right) The ratio of p-TBK1/TBK1 and p-IRF3/IRF3 protein band intensity quantified from the immunoblot shown on the left. e, (Left) Immunoblot of p-TBK1, p-IRF3, p-NF-κB, TBK1, IRF3, NF-κB and GAPDH proteins in caerulein-versus PBS-treated WT pancreas (n=3 in caerulein and n=4 in PBS group). (Right) The ratio of p-TBK1/TBK1 and p-IRF3/IRF3 protein band intensity quantified from the immunoblot shown on the left. f, Il33 expression in Pam212 cells at 6 hours after treatment with poly(I:C), LPS and PBS (n=4 in each group). g, Time course of p-TBK1, p-IRF3, TBK1, IRF3 and GAPDH protein expression in Pam212 cells after poly(I:C) treatment. h, Il33 expression in Trif siRNA (siTrif)- versus siRNA control (siCon)-treated Pam212 cells in response to poly(I:C) versus PBS treatment (n=4 in each group). i, Chromatin Immunoprecipitation (ChIP)-qPCR assay for p-IRF3 binding to Il33 promoter region after the treatment of Pam212 cells with poly(I:C) versus PBS (n=4 in each group). Note the presence of a sequence very similar to the IRF3 binding motif in the Il33 promoter region. j, Il33 expression in siIrf3- versus siCon-treated Pam212 cells in response to poly(I:C) versus PBS treatment (n=4 in each group). k, Il33 expression levels in DNFB-treated WT versus Irf3KO skin (n=8 in WT and n=5 in Irf3KO group). l, IL-33 protein levels in DNFB-treated WT versus Irf3KO skin (n=9 in WT and n=10 in Irf3KO group). m, Epidermal thickness in DNFB-treated WT versus Irf3KO skin. Each dot represents the average of three measurements in an HPF image. Ten random HPF images per skin sample are included (n=6 in each group). n, Mast cell counts in DNFB-treated WT versus Irf3KO skin. Each dot represents cell counts from an HPF image. Three randomly selected HPF images are included per sample (n=10 in each group). o, Il33 expression levels in caerulein-treated WT versus Irf3KO pancreas (n=6 in each group). p, IL-33 protein levels in caerulein-treated WT versus Irf3KO pancreas (n=6 in WT and n=7 in Irf3KO group). q, CD45+ immune cell counts in caerulein-treated WT versus Irf3KO pancreas. Each dot represents cell counts from an HPF image. Three randomly selected HPF images are included per sample (n=3 in each group). Graphs show mean + SD, Fig. 1d, e, i, k-q: unpaired t test, Fig 1f, h, j: one-way ANOVA, scale bar: 100 μm
Figure 2
Figure 2. Pitavastatin inhibits IL-33 expression by blocking GGPP-dependent TBK1 activation.
a, Il33 expression in poly(I:C)-treated Pam212 cells that received pitavastatin, BX795, Zoliadic acid (Zol) or PBS (n=4 in each group). b, (Left) Immunoblot of p-TBK1, p-IRF3, TBK1, IRF3, and GAPDH proteins in whole cell lysates of poly(I:C)-treated Pam212 cells that received pitavastatin alone or in combination with GGPP. (Right) The ratio of p-TBK1/TBK1 and p-IRF3/IRF3 protein band intensity from immunoblots (n=3 in each group). c, (Left) Immunoblot of p-TBK1, TBK1, Na-K-ATPase, and GAPDH proteins in membrane and cytosol fraction of poly(I:C)-treated Pam212 cells that received pitavastatin alone or in combination with GGPP. (Right) The ratio of membrane-bound p-TBK1/Na,K-ATPase protein band intensity from the immunoblots (n=3 in each group). d, Il33 expression in poly(I:C)-treated Pam212 cells that received pitavastatin alone or in combination with GGPP (n=7 in each group). e, Schematic diagram of pitavastatin mechanism of action in blocking mevalonate pathway-GGPP mediated TBK1-IRF3 signaling activation. Graphs show mean + SD, one-way ANOVA.
Figure 3
Figure 3. Pitavastatin blocks chronic pancreatitis and its cancer sequela.
a, (Left) Immunoblot of p-TBK1, p-IRF3, p-NF-kB, TBK1, IRF3, NF-kB and GAPDH proteins in pitavastatin-versus PBS-treated WT pancreas at the completion of caerulein treatment protocol (n=4 in each group). (Right) The ratio of p-TBK1/TBK1 and p-IRF3/IRF3 protein band intensity quanti ed from the immunoblot shown on the left. b, Il33 expression in pitavastatin- versus PBS-treated WT pancreas at the completion of caerulein treatment protocol (n=9 in pitavastatin and n=7 in PBS group). c, IL-33 protein levels in pitavastatin- versus PBS-treated WT pancreas at the completion of caerulein treatment protocol (n=10 in pitavastatin and n=9 in PBS group). d, CD45+ immune cell counts in pitavastatin- versus PBS-treated WT pancreas at the completion of the caerulein treatment protocol. Each dot represents cell counts from an HPF image. Three randomly selected HPF images are included per sample (n=5 in pitavastatin and n=4 in PBS group). e, Representative images of macroscopic, hematoxylin and eosin (H&E), and Alcian blue-stained pancreatic tumors from pitavastatin- versus PBS-treated KPC mice that underwent caerulein-induced pancreatic cancer protocol. f, Ratio of pancreatic tumor per body weight in pitavastatin- versus PBS-treated KPC mice at the completion of caerulein-induced pancreatic cancer protocol (n=6 in each group). g, Percent mucin-positive cells in pitavastatin- versus PBS-treated KPC tumors at the completion of caerulein-induced pancreatic cancer protocol. Each dot represents % mucin-positive cells in an HPF image. Two to three randomly selected HPF images are included per sample (n=6 in each group). Graphs show mean + SD, unpaired t test, scale bars: 1cm (macroscopic images), 100 μm (microscopic images).
Figure 4
Figure 4. IRF3-IL-33 signaling axis is highly active in human chronic pancreatitis-associated pancreatic cancer, and pitavastatin reduces the risk of chronic pancreatitis and pancreatic cancer in patients.
a, Representative images of IL-33 and IRF3 immunostaining on adjacent sections of matched normal pancreas, chronic pancreatitis, and PDAC collected from pancreatic cancer patients. b, IL-33+ epithelial cell counts per HPF in the matched samples from human pancreatic tissues. Each dot represents the average cell counts across three randomly selected HPF images per sample (n=15 patients, paired t-test). c, IRF3+ epithelial cell counts per HPF in the matched samples from human pancreatic tissues. Each dot represents the average cell counts across three randomly selected HPF images per sample (n=15 patients, paired t-test). d, The correlation between IL-33+ and IRF3+ cell counts across normal pancreas, chronic pancreatitis, and PDAC samples (n=45 matched samples from 15 patients, t-test for the Pearson correlation coefficient). e, Box plot of IL33 expression in pancreatic cancer versus normal pancreas across TCGA/GTEx datasets (* P < 0.01, one-way ANOVA, Gene Expression Pro ling Interactive Analysis database). f, A retrospective cohort analysis of chronic pancreatitis and pancreatic cancer risk in matched cohorts of patients treated with pitavastatin (test) versus ezetimibe (control). Graphs show mean + SD, scale bar: 100 μm

References

    1. Chen L. et al. Inflammatory responses and inflammation-associated diseases in organs. Oncotarget 9, 7204–7218, doi:10.18632/oncotarget.23208 (2018). - DOI - PMC - PubMed
    1. Grivennikov S. I., Greten F. R. & Karin M. Immunity, inflammation, and cancer. Cell 140, 883–899, doi:10.1016/j.cell.2010.01.025 (2010). - DOI - PMC - PubMed
    1. Greten F. R. & Grivennikov S. I. Inflammation and Cancer: Triggers, Mechanisms, and Consequences. Immunity 51, 27–41, doi:10.1016/j.immuni.2019.06.025 (2019). - DOI - PMC - PubMed
    1. McGuigan A. et al. Pancreatic cancer: A review of clinical diagnosis, epidemiology, treatment and outcomes. World J Gastroenterol 24, 4846–4861, doi:10.3748/wjg.v24.i43.4846 (2018). - DOI - PMC - PubMed
    1. Axelrad J. E., Lichtiger S. & Yajnik V. Inflammatory bowel disease and cancer: The role of inflammation, immunosuppression, and cancer treatment. World J Gastroenterol 22, 4794–4801, doi:10.3748/wjg.v22.i20.4794 (2016). - DOI - PMC - PubMed

Publication types

LinkOut - more resources