

This is a preprint.
Learning fast and fine-grained detection of amyloid neuropathologies from coarse-grained expert labels
- PMID: 36711704
- PMCID: PMC9882138
- DOI: 10.1101/2023.01.13.524019
Learning fast and fine-grained detection of amyloid neuropathologies from coarse-grained expert labels
Update in
-
Learning fast and fine-grained detection of amyloid neuropathologies from coarse-grained expert labels.Commun Biol. 2023 Jun 24;6(1):668. doi: 10.1038/s42003-023-05031-6. Commun Biol. 2023. PMID: 37355729 Free PMC article.
Abstract
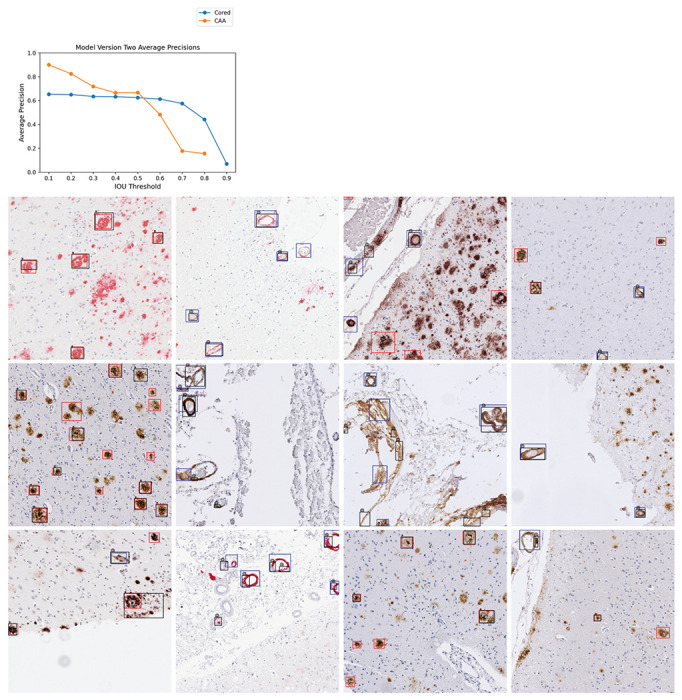
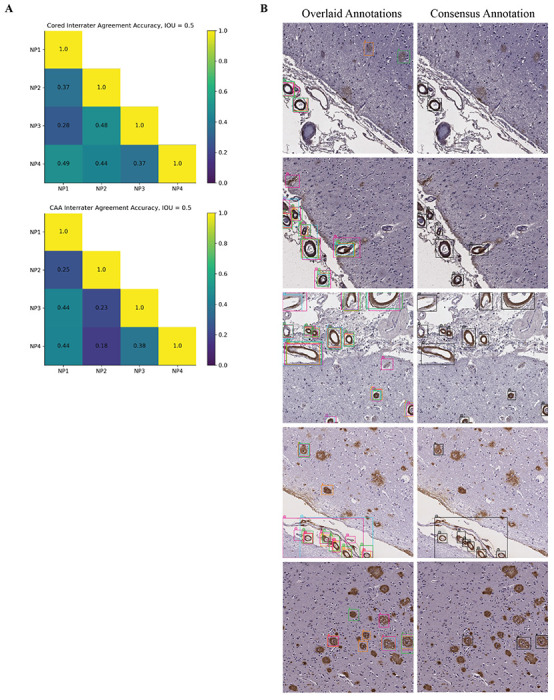
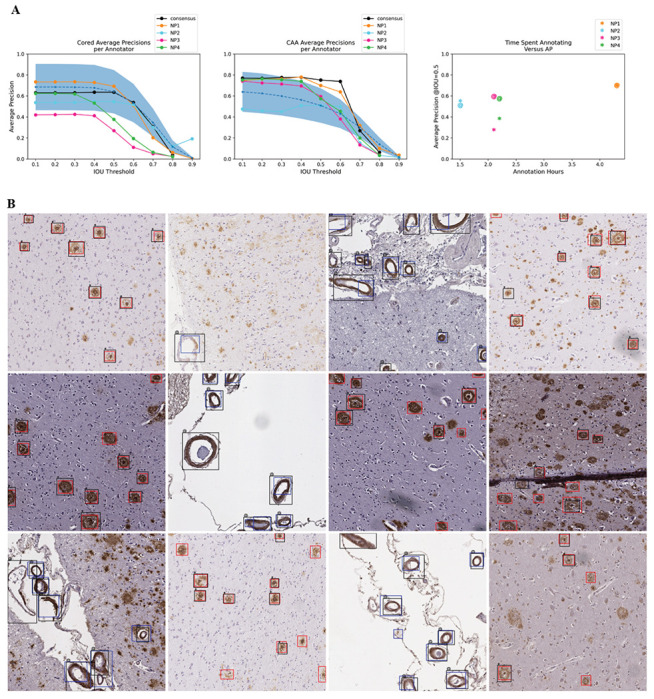
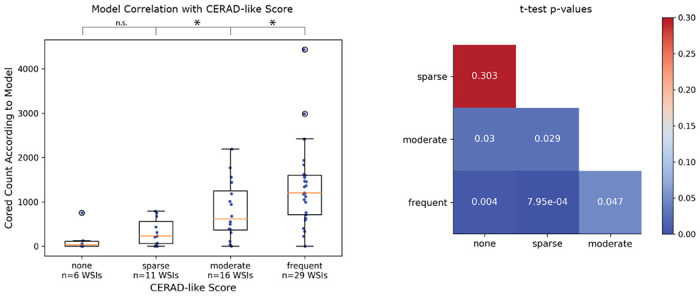
Precise, scalable, and quantitative evaluation of whole slide images is crucial in neuropathology. We release a deep learning model for rapid object detection and precise information on the identification, locality, and counts of cored plaques and cerebral amyloid angiopathies (CAAs). We trained this object detector using a repurposed image-tile dataset without any human-drawn bounding boxes. We evaluated the detector on a new manually-annotated dataset of whole slide images (WSIs) from three institutions, four staining procedures, and four human experts. The detector matched the cohort of neuropathology experts, achieving 0.64 (model) vs. 0.64 (cohort) average precision (AP) for cored plaques and 0.75 vs. 0.51 AP for CAAs at a 0.5 IOU threshold. It provided count and locality predictions that correlated with gold-standard CERAD-like WSI scoring (p=0.07± 0.10). The openly-available model can quickly score WSIs in minutes without a GPU on a standard workstation.
Conflict of interest statement
Declaration of Interests
The authors declare no competing interests.
Figures
Similar articles
-
Learning fast and fine-grained detection of amyloid neuropathologies from coarse-grained expert labels.Commun Biol. 2023 Jun 24;6(1):668. doi: 10.1038/s42003-023-05031-6. Commun Biol. 2023. PMID: 37355729 Free PMC article.
-
Deep learning from multiple experts improves identification of amyloid neuropathologies.Acta Neuropathol Commun. 2022 Apr 28;10(1):66. doi: 10.1186/s40478-022-01365-0. Acta Neuropathol Commun. 2022. PMID: 35484610 Free PMC article.
-
Validation of machine learning models to detect amyloid pathologies across institutions.Acta Neuropathol Commun. 2020 Apr 28;8(1):59. doi: 10.1186/s40478-020-00927-4. Acta Neuropathol Commun. 2020. PMID: 32345363 Free PMC article.
-
From WSI-level to patch-level: Structure prior-guided binuclear cell fine-grained detection.Med Image Anal. 2023 Oct;89:102931. doi: 10.1016/j.media.2023.102931. Epub 2023 Aug 12. Med Image Anal. 2023. PMID: 37586290
-
Learning precise segmentation of neurofibrillary tangles from rapid manual point annotations.bioRxiv [Preprint]. 2024 Sep 24:2024.05.15.594372. doi: 10.1101/2024.05.15.594372. bioRxiv. 2024. PMID: 39386601 Free PMC article. Preprint.
References
-
- Tiraboschi P., Hansen L. A., Thal L. J. & Corey-Bloom J. The importance of neuritic plaques and tangles to the development and evolution of AD. Neurology 62, 1984–1989 (2004). - PubMed
Publication types
Grants and funding
LinkOut - more resources
Full Text Sources