[Preprint]. 2023 Oct 27:2023.01.11.23284450.
doi: 10.1101/2023.01.11.23284450.

Magnetic seizure therapy and electroconvulsive therapy increase aperiodic activity

Affiliations

Magnetic seizure therapy and electroconvulsive therapy increase aperiodic activity

Sydney E Smith et al. medRxiv. .

Update in

Abstract

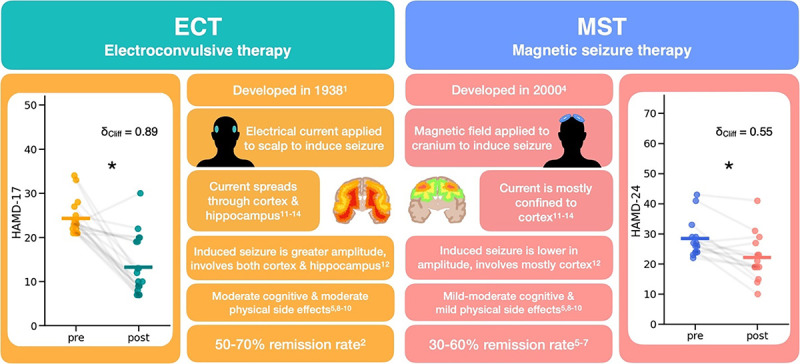
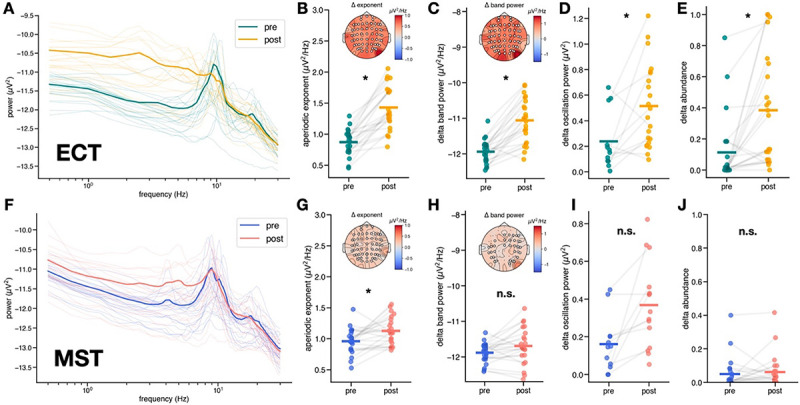
Major depressive disorder (MDD) is a leading cause of disability worldwide. One of the most efficacious treatments for treatment-resistant MDD is electroconvulsive therapy (ECT). Recently, magnetic seizure therapy (MST) was developed as an alternative to ECT due to its more favorable side effect profile. While these approaches have been very successful clinically, the neural mechanisms underlying their therapeutic effects are unknown. For example, clinical "slowing" of the electroencephalogram beginning in the postictal state and extending days to weeks post-treatment has been observed in both treatment modalities. However, a recent longitudinal study of a small cohort of ECT patients revealed that, rather than delta oscillations, clinical slowing was better explained by increases in aperiodic activity, an emerging EEG signal linked to neural inhibition. Here we investigate the role of aperiodic activity in a cohort of patients who received ECT and a cohort of patients who received MST treatment. We find that aperiodic neural activity increases significantly in patients receiving either ECT or MST. Although not directly related to clinical efficacy in this dataset, increased aperiodic activity is linked to greater amounts of neural inhibition, which is suggestive of a potential shared neural mechanism of action across ECT and MST.


Conflict of interest statement

Competing interests A.T.H. was supported by an Alfred Deakin Postdoctoral Research Fellowship. D.M.B. receives research support from the Canadian Institutes of Health Research (CIHR), National Institutes of Health – US (NIH), Brain Canada Foundation and the Temerty Family through the CAMH Foundation and the Campbell Family Research Institute. He received research support and in-kind equipment support for an investigator-initiated study from Brainsway Ltd. and he was the site principal investigator for three sponsor-initiated studies for Brainsway Ltd. He received in-kind equipment support from Magventure for investigator-initiated studies. He received medication supplies for an investigator-initiated trial from Indivior. He has participated in an advisory board for Janssen. He has participated in an advisory board for Welcony Inc. Z.J.D. has received research and equipment in-kind support for an investigator-initiated study through Brainsway Inc and Magventure Inc and industry-initiated trials through Magnus Inc. He also currently serves on the scientific advisory board for Brainsway Inc. His work has been supported by the National Institutes of Mental Health (NIMH), the Canadian Institutes of Health Research (CIHR), Brain Canada and the Temerty Family, Grant and Kreutzcamp Family Foundations.

Figures

Fig. 1|
Fig. 1|. Overview of ECT and MST.
This describes important details of both treatment types, electroconvulsive therapy (ECT), and magnetic seizure therapy (MST). Both treatments are typically only used on patients with treatment-resistant depression and involve inducing a seizure, either with an electrical current or a magnetic field. The main difference is that ECT has a more global spread to subcortical structures and hippocampus, whereas MST affects more local cortical structures. However, both treatment types significantly reduce depression ratings, with MST having a comparable but more modest therapeutic effect than ECT. We can see this clinical improvement in the datasets analyzed here,, as measured by the HAMD-17 for ECT (pre median(IQR) = 23.0 (22, 24.5), post median(IQR) = 10 (8.5, 19), W(18) = 6, δCliff = 0.89, p = 5.3 × 10⁻⁵) and the HAMD-24 for MST (pre-MST = 26.5 (24, 29), post-MST = 20 (19, 26), W(13) = 7, δCliff = 0.55, p = 2.3 × 10⁻³).
Fig. 2|
Fig. 2|. Using spectral parameterization to disambiguate periodic and aperiodic contributions to delta band power.
(A) Simulated power spectrum illustrating parameterized spectra. Unlike traditional band power measures that conflate periodic and aperiodic activity, spectral parameterization defines oscillation power as relative power above the aperiodic component (pink dashed line). (B) Increases in the aperiodic exponent can cause apparent increases in total (T) band power, while power relative (R) to the aperiodic component remains unchanged. We see this here in a simulated power spectrum depicting an increase in exponent with no delta oscillation changes after treatment. (C) True increases in oscillation power show increases in both total power and relative power. We see this here in a simulated power spectrum depicting an increase in delta oscillation power after treatment with no change in exponent. (D) Delta in the EEG trace vs. aperiodic activity. EEG with delta oscillations (where a delta peak is present in the spectra) is visibly different from EEG with only aperiodic activity in the delta band.
Fig. 3|
Fig. 3|. EEG results - Aperiodic vs. delta band power slowing
Spectral differences in aperiodic exponent and delta oscillations in ECT (top) and MST (bottom). (A) Raw power spectra averaged across channels for each patient pre- and post-ECT. Bolded spectra represent average across patients. (B) Increase in aperiodic exponent post-ECT (pre = 0.88 ± 0.21 μV2Hz−1, post = 1.25 ± 0.33 μV2Hz−1, t(21) = −9.07, dz = 2.00, ɑadj = 6.25 × 10⁻³, p = 1.05 × 10⁻⁸), inset shows scalp topography of median exponent change, with significant electrodes (p < 0.05) marked in white. (C) Increase in total power in the delta band post-ECT (pre = −11.88 ± 0.27 μV2Hz−1, post = −11.69 ± 0.51 μV2Hz−1, t(21) = −2.23, dz = 0.45, ɑadj = 1.25 × 10⁻², p = 0.036), inset shows scalp topography of median delta band power change, with significant electrodes (p < 0.05) marked in white. (D) Increase in aperiodic-adjusted oscillation power in the delta band – only 12 out of 22 patients exhibited a delta oscillation peak both pre- and post-ECT (pre = 0.16 (0.08, 0.66) μV2, post = 0.46 (0.23, 0.76) μV2, W(11) = 10, δCliff = −0.26, ɑadj = 5.00 × 10⁻², p = 0.02). Many patients exhibited an emergence of delta peaks post-ECT, hence the increased number of data points in post-ECT. No scalp topography is depicted because delta oscillation presence was not consistent across electrodes and patients. (E) Increase in the abundance of delta oscillations post-ECT (pre = 0.023 (0, 0.15), post = 0.36 (0.07, 0.67), W(21) = 20.5, δCliff = −0.67, ɑadj = 1.00 × 10⁻², p = 1.77 × 10⁻⁴). (F) Raw power spectra averaged across channels for each patient pre- and post-MST. Bolded spectra represent average across patients. (G) Increase in aperiodic exponent post-MST (pre = 0.98 ± 0.18 μV2Hz−1, post = 1.14 ± 0.21 μV2Hz−1, t(21) = −3.06, dz = 0.80, ɑadj = 7.14 × 10⁻³, p = 6.0 × 10⁻³), inset shows scalp topography of median exponent change, with significant electrodes (p > 0.05) marked in white. (H) No significant change in total power in the delta band post-MST (pre = −11.88 ± 0.27 μV2Hz−1, post = −11.69 ± 0.51 μV2Hz−1, t(21) = −2.23, dz = 0.45, ɑadj = 1.25 × 10⁻², p = 0.036), inset shows scalp topography of median delta band power change, with significant electrodes (p > 0.05) marked in white. (I) No significant change in aperiodic-adjusted oscillation power in the delta band–only 10 out of 22 patients exhibited a delta oscillation peak both pre- and post-MST (pre = 0.16 ± 0.14 μV2, post = 0.35 ± 0.21 μV2, t(9) = −3.26, dz = 1.14, ɑadj = 8.33 × 10⁻³, p = 9.8 × 10⁻³), with a few patients exhibiting emerging delta peaks post-MST, hence the increased number of data points post-MST. (J) No significant change in the abundance of delta oscillations post-MST (pre = 0.02 (0, 0.07), post = 0.03 (0, 0.05), W(21) = 62.5, δCliff = −0.15, ɑadj = 5.00 × 10⁻², p = 0.80).
Fig. 4|
Fig. 4|. EEG results – Changes in theta and alpha oscillations
Changes in theta (4–7 Hz) and alpha (7–12 Hz) oscillations in ECT (top) and MST (bottom). (A) Observed increase in theta oscillation power post-ECT (pre = 0.30 ± 0.15 μV2, post = 0.70 ± 0.32 μV2, t(19) = −5.65, dz = 1.55, ɑadj = 8.33 × 10⁻³, p = 1.90 × 10⁻⁵), inset shows scalp topography of median theta oscillation change. (B) Increase in theta abundance theta abundance post-ECT (pre = 0.23 (0.03, 0.63), post = 0.69 (0.34, 0.91), W(21) = 35, δCliff = −0.45, ɑadj = 1.67 × 10⁻², p = 5.40 × 10⁻³). (C) Power spectra from electrode F8 in a patient who received ECT showing the emergence of a theta oscillation and a decrease in alpha oscillation power post-ECT. (D) Increase in alpha oscillation power post-ECT (pre = 1.32 ± 0.49 μV2, post = 0.99 ± 0.39 μV2, t(21) = 3.33, dz = 0.78, ɑadj = 1.25 × 10⁻², p = 3.20 × 10⁻³), inset shows scalp topography of median alpha oscillation power change. (E) Decrease in alpha abundance post-ECT (pre = 1.0 (1, 1), post = 1.0 (0.94, 1), W(21) = 42 δCliff = 0.35, ɑadj = 2.50 × 10⁻², p = 0.020). (F) Increase in theta oscillation power post-MST (pre = 0.35 (0.14, 0.42) μV2, post = 0.53 (0.44, 0.82) μV2, W(17) = 3.0, δCliff = −0.97, ɑadj = 6.25 × 10⁻³, p = 3.80 × 10⁻⁵), inset shows scalp topography of median theta oscillation power change. (G) No significant change in theta abundance (pre = 0.39(0.07, 0.98), post = 0.68(0.21, 0.95), W(21) = 47, δCliff = −0.34, ɑadj = 1.00 × 10⁻², p = 0.02). (H) Power spectra from electrode F8 in a patient who received MST showing the emergence of a theta oscillation and a decrease in alpha oscillation power post-MST. (I) There is no significant change in alpha oscillation power post-MST (pre = 1.19 ± 0.44 μV2, post = 1.13 ± 0.37 μV2, t(21) = 0.88, dz = 0.15, ɑadj = 2.50 × 10⁻², p = 0.39), inset shows scallop topography of median change in alpha oscillation power. (J) No significant change in alpha abundance post-MST (pre = 1.0 (1.0, 1.0), post = 1.0 (1.0, 1.0), W(21) = 2.0, δCliff = 0.18, ɑadj = 1.67 × 10⁻², p = 0.18).
Fig. 5|
Fig. 5|. Partial regression analysis – baseline exponent and treatment outcome
Partial regression of combined ECT and MST datasets showing a positive trending relationship between patients’ aperiodic exponent at baseline and clinical outcome, as measured by normalized HAMD-D (β = 0.30, p = 0.091, 95% CI[−0.05, 0.657]). Here, patients whose baseline aperiodic exponent is lower, visible in a flatter pre-treatment power spectrum, show lower post-treatment symptom severity.

References

    1. The Practice of Electroconvulsive Therapy: Recommendations for Treatment, Training, and Privileging. (American Psychiatric Association, 2001).
    1. UK ECT Review Group. Efficacy and safety of electroconvulsive therapy in depressive disorders: a systematic review and meta-analysis. The Lancet 361, 799–808 (2003). - PubMed
    1. Wilkinson S. T., Agbese E., Leslie D. L. & Rosenheck R. A. Identifying Recipients of Electroconvulsive Therapy: Data From Privately Insured Americans. Psychiatr. Serv. 69, 542–548 (2018). - PMC - PubMed
    1. Lisanby S. H., Schlaepfer T. E., Fisch H.-U. & Sackeim H. A. Magnetic Seizure Therapy of Major Depression. Arch. Gen. Psychiatry 58, 303 (2001). - PubMed
    1. Daskalakis Z. J., Dimitrova J., McClinktock S. M., Sun Y., Voineskos D., Rajji T. K. et al. Magnetic seizure therapy (MST) for major depressive disorder. Neuropsychopharmacology 45, 276–282 (2020). - PMC - PubMed

Publication types