[Preprint]. 2023 Jan 10:rs.3.rs-2320717.
doi: 10.21203/rs.3.rs-2320717/v1.

Post-fast refeeding enhances intestinal stem cell-mediated regeneration and tumourigenesis through mTORC1-dependent polyamine synthesis

Affiliations

Post-fast refeeding enhances intestinal stem cell-mediated regeneration and tumourigenesis through mTORC1-dependent polyamine synthesis

Shinya Imada et al. Res Sq. .

Update in

  • Short-term post-fast refeeding enhances intestinal stemness via polyamines.
    Imada S, Khawaled S, Shin H, Meckelmann SW, Whittaker CA, Corrêa RO, Alquati C, Lu Y, Tie G, Pradhan D, Calibasi-Kocal G, Nascentes Melo LM, Allies G, Rösler J, Wittenhofer P, Krystkiewicz J, Schmitz OJ, Roper J, Vinolo MAR, Ricciardiello L, Lien EC, Vander Heiden MG, Shivdasani RA, Cheng CW, Tasdogan A, Yilmaz ÖH. Imada S, et al. Nature. 2024 Sep;633(8031):895-904. doi: 10.1038/s41586-024-07840-z. Epub 2024 Aug 21. Nature. 2024. PMID: 39169180 Free PMC article.

Abstract

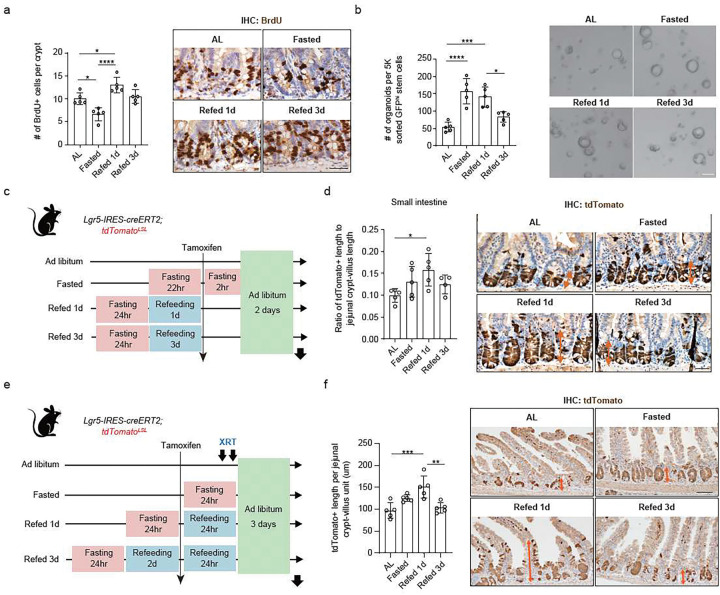
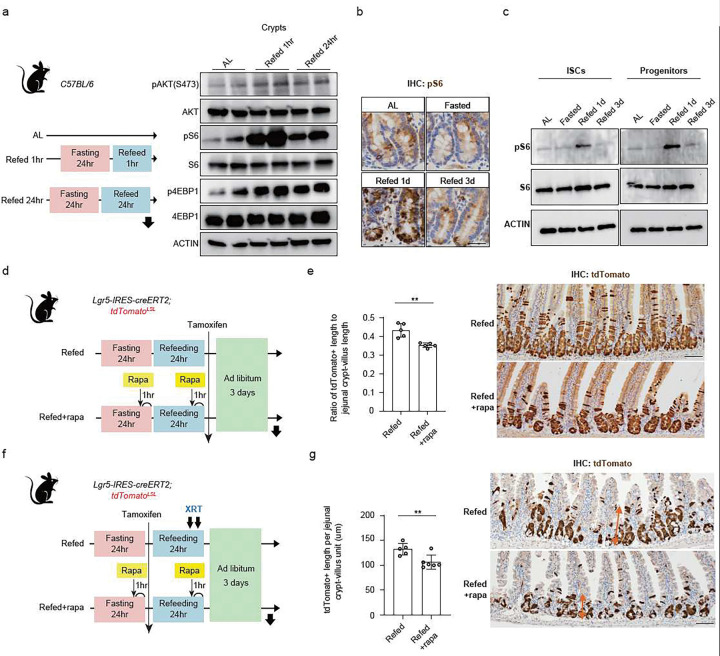
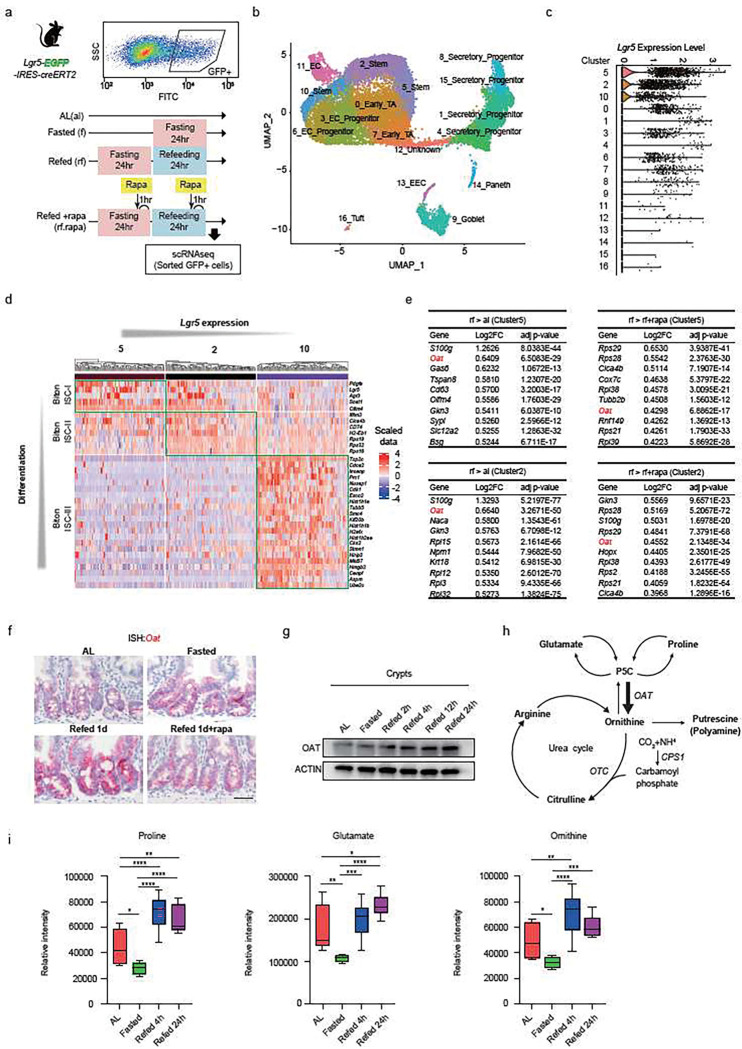
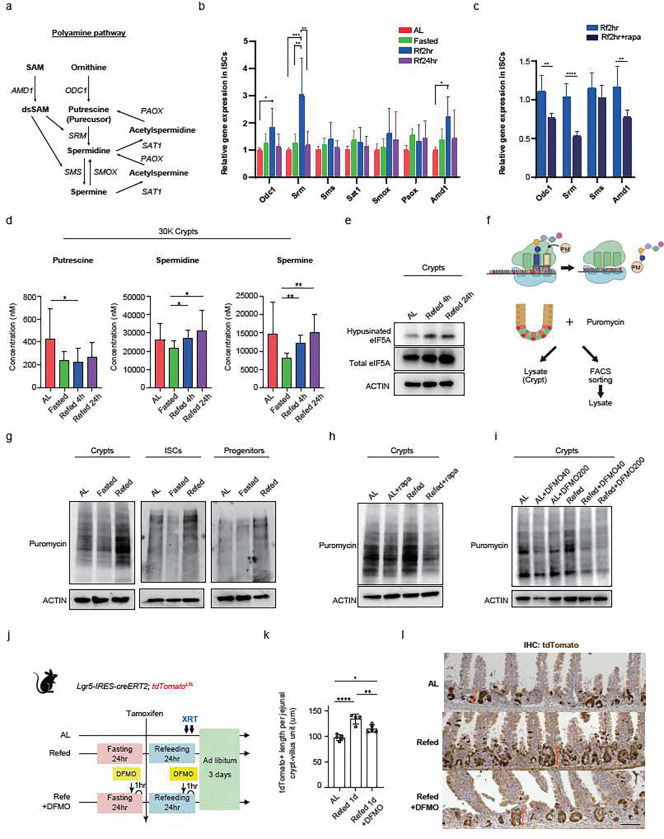
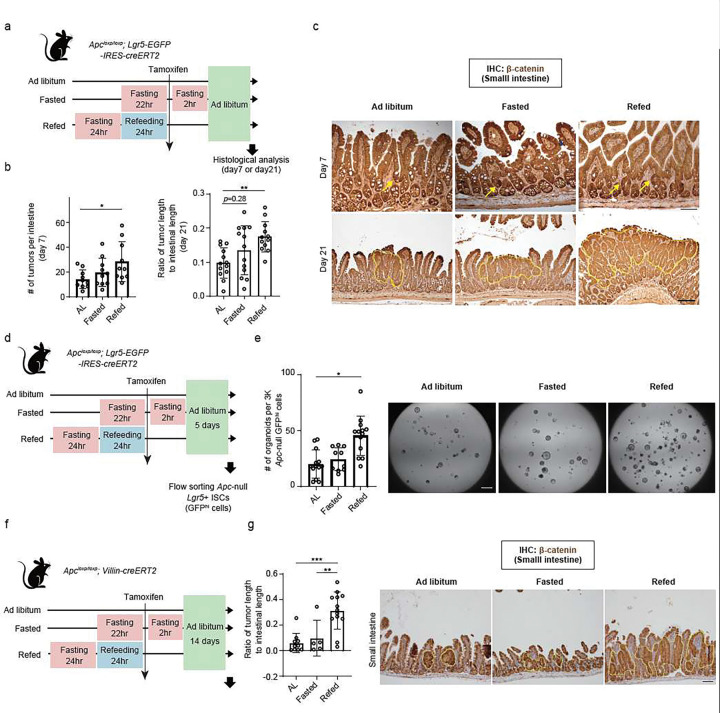
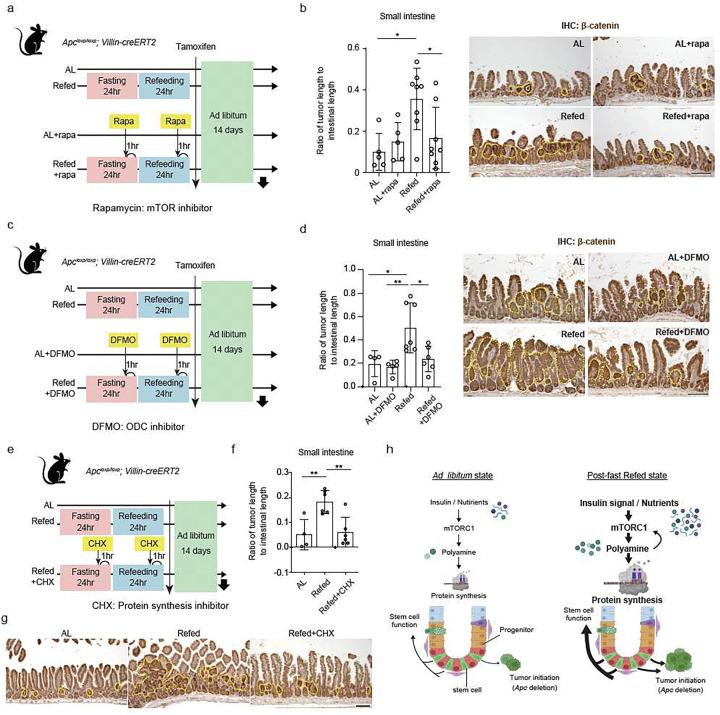
For more than a century, fasting regimens have improved health, lifespan, and tissue regeneration in diverse organisms, including humans. However, how fasting and post-fast refeeding impact adult stem cells and tumour formation has yet to be explored in depth. Here, we demonstrate that post-fast refeeding increases intestinal stem cell (ISC) proliferation and tumour formation: Post-fast refeeding augments the regenerative capacity of Lgr5+ intestinal stem cells (ISCs), and loss of the tumour suppressor Apc in ISCs under post-fast refeeding leads to a higher tumour incidence in the small intestine and colon than in the fasted or ad libitum (AL) fed states. This demonstrates that post-fast refeeding is a distinct state. Mechanistically, we discovered that robust induction of mTORC1 in post-fast-refed ISCs increases protein synthesis via polyamine metabolism to drive these changes, as inhibition of mTORC1, polyamine metabolite production, or protein synthesis abrogates the regenerative or tumourigenic effects of post-fast refeeding. Thus, fast-refeeding cycles must be carefully considered when planning diet-based strategies for regeneration without increasing cancer risk, as post-fast refeeding leads to a burst not only in stem cell-driven regeneration but also in tumourigenicity.


Conflict of interest statement

DECLARATION OF INTERESTS The authors declare no competing interests.

Figures

Figure 1
Figure 1
Post-fast refeeding augments intestinal stem and progenitor cell proliferation and function (a) Quantification (left) and representative images of BrdU+ cells (4 hours after BrdU administration) by IHC per jejunal crypt (right). n > 25 crypts per measurement, n = 5 mice per group. Scale bar, 25 μm. (b) Organoid-forming assay for FACS-sorted ISCs from AL, Fasted, Refed 1d, and Refed 3d mice. Quantification (left) and representative images of day 3 organoids (right). n = 5 mice per group. Scale bar, 50 μm. (c) Schematic of Lgr5 lineage tracing with Lgr5-IRES-CreERT2; Rosa26LSL-tdTomato reporter mice, including the timeline of tamoxifen injection and tissue collection. (d) Quantification (left) and representative images of tdTomato+ Lgr5+ ISC-derived progenies labeled by IHC for tdTomato (orange arrows, right) in the small intestine. n = 20 crypts per measurement, n > 4 mice per group. Scale bar, 25 μm. (e) Schematic of irradiation mouse model, including the timeline of irradiation (XRT 7.5Gy × 2) (f) Quantification (left) and representative images of IHC for tdTomato (right). n = 20 crypts per measurement, and n = 5 mice per group. Scale bar, 50 μm. Data in dot plots were expressed as mean ±SD. *p < 0.05, **p < 0.01, ***p < 0.001, ****p < 0.0001, one-way ANOVA.
Figure 2
Figure 2
Refeeding activates mTORC1 signalling in ISCs (a) Schematic of the mouse model, including a refeeding period (left). Protein amount of phospho-AKT and mTORC1 downstream by immunoblots in crypts from AL, Refed 1h, Refed 24h mice (right). (b) Representative images of IHC for phospho-S6 in jejunal crypts from AL, Fasted, Refed 1d, and Refed 3d mice. Scale bar, 20 μm. (c) Protein amount of pS6, S6, and ACTIN in flow-sorted ISCs (Lgr5-GFPhi), progenitors (Lgr5-GFPlow) by immunoblots from each dietary conditioned Lgr5-IRES-creERT2 mice. (d) Schematic of homeostatic lineage tracing mouse model. (e) Quantification (left) and representative images of tdTomato+ Lgr5+ ISC-derived progenies labeled by IHC for tdTomato (right). Scale bar, 50 μm. (f) Schematic of the irradiation mouse model, including the timeline of rapamycin administration. (g) Quantification (left) and representative images of IHC for tdTomato (orange arrows, right). n=20 crypts per measurement, and n = 5 mice per group. Scale bar, 50 μm Data in dot plots were expressed as mean ±SD. **p < 0.01, Student’s t-test
Figure 3
Figure 3
Refeeding induces mTORC1-dependent transcriptional changes in stemness and metabolic pathways (a) Schematic of single-cell RNAseq (scRNA-seq). GFP+ cells including ISCs (GFPhi) and progenitor cells (GFPlow) were flow-sorted from Lgr5-EGFP-IRES creERT2 mice. (b) Cell type clusters. UMAP for clustering (color coding) of 18,061 single cells (Ad libitum, n=1 and 4,760 cells; Fasted, n=1 and 4,282 cells; Refed 1d n=1 and 4,552 cells; Refed 1d with rapamycin treatment n=1 and 4,467 cells). TA, transit-amplifying (progenitor) cells; EC, enterocyte; EEC, enteroendocrine cells. (c) Lgr5 relative expression level among all clusters within all dietary groups. (d) Gene signatures comparison of ISC subsets between our stem cell clusters (5, 2,10) from all groups and Biton’s ISC classification. Representative genes of Biton’s ISC subsets are shown on the right side. (e) Top hit genes list in ISC subsets (5, 2) where refeeding (rf) stimulates these expression level compared to AL (al) or rf+rapa group. (f) Representative images of in situ hybridization (ISH, red) of OAT mRNA. Scar bar, 10 μm. (g) Immunoblots of OAT and ACTIN in the crypts from different timepoint. (h) Schematic of Ornithine metabolism including the metabolites and the genes encoding the catalytic enzyme. (i) The level of each metabolite with intestinal tissues from AL, Fasted, Refed 4h, and Refed 24h mice. n=4–5 per group. Data in dot plots were expressed as mean ±SD. *p < 0.05, **p < 0.01, ***p < 0.001, ****p < 0.0001, one-way ANOVA.
Figure 4
Figure 4
Refeeding induces protein synthesis through mTORC1 and polyamine metabolites to drive regeneration (a) Schematic of the polyamine biosynthesis pathway including the metabolites and the genes encoding the catalytic enzyme. (b) qPCR with FACS-sorted ISCs from AL, Fasted, Refed 2h, and Refed 24h mice. n=6–7 mice per group. (c) qPCR with FACS-sorted ISCs from Refed 2h and Refed 2h treated with rapamycin mice. n=6 mice per group. (d) Each polyamine level with intestinal crypt measured by LC-MS from AL, Fasted, Refed 4h, and Refed 24h mice. n=5 mice per group. (e) Protein levels of hypusinated eIF5A, Total eIF5A, and ACTIN in the crypt from different dietary conditioned mice. (f) Schematic of puromycin assay to address the protein synthesis (g) Immunoblots for puromycin and ACTIN in isolated crypts as well as in FACS-sorted ISCs (Lgr5-GFPhi),progenitors (Lgr5-GFPlow) labeled with puromycin from AL, Fasted, and Refed 1d Lgr5-EGFP-IRES-creERT2 mice. (h) Immunoblots for puromycin and ACTIN in isolated crypts labeled with puromycin from AL and Refed with or without rapamycin treatment. (i) Immunoblots for puromycin in crypts from AL and Refed with or without ODC1 inhibitor (DFMO). DFMO 40, 200: DFMO 40mg/kg, 200mg/kg. (j)(k)(l) Schematic of irradiation mouse model (j), quantification (k), and representative images of tdTomato+ Lgr5+ ISC-derived progenies labeled by IHC (l) (orange arrows). Scale bar, 50 μm Data in dot plots were expressed as mean ±SD. *p < 0.05, **p < 0.01, ***p < 0.001, ****p < 0.0001, one-way ANOVA for (b), (c), (k). The unpaired t test for (d).
Figure 5
Figure 5
Post-fast refeeding augments the tumourigenic capacity of ISCs (a) Schematic of Apc tumour model with Apcloxp/loxp; Lgr5-EGFP-IRES-creERT2 mice. (b) The number of β-catenin+ nucleus Apc-null lesions 1 week after tamoxifen administration (left), and the ratio of tumour length in small intestine 3 weeks after tamoxifen administration (right). (c) Representative Apc-null tumour lesion by IHC for β-catenin. Tumours are pointed by yellow arrow or surrounded by a yellow dotted line. Scale bar, 100 m (upper) and 50 μm (lower). (d) Schematic of ex vivo adenomatous organoid model with FACS-sorted Apc-null ISCs (Lgr5-GFPhi) from Apcloxp/loxp; Lgr5-EGFP-IRES-CreERT2 mice. (e) Quantification (left) and representative day 6 images of Apc-null adenomatous (right). Scale bar, 1 mm. n = 5 mice (f) Schematic of Apc tumour model with Apcloxp/loxp;Villin-CreERT2 mice. (g) Ratio of β-catenin+ Apc-null tumour length in small intestine (left), and representative Apcnull tumour lesion by IHC for β-catenin. Tumours are surrounded by a yellow dotted line. Scale bar, 50 μm. Data in dot plots were expressed as mean ±SD. *p < 0.05, **p < 0.01, ***p < 0.001, one-way ANOVA.
Figure 6
Figure 6
Refeeding enhances ISC tumourigenic potential through mTORC1 and polyamine mediated protein synthesis (a) (c) (e) Schematic assessing the effect of mTORC inhibitor (rapamycin) (a), ODC1 inhibitor (DFMO) (c), and protein synthesis inhibitor (cycloheximide) (e) on tumourigenesis using Apcloxp/loxp;Vllin- CreERT2 mouse model. (b) (d) (f) Quantification of tumour burden in the small intestine (left) and representative tumour images by IHC for β-catenin (right in b and d). Tumours are surrounded by yellow dotted lines. Scar bar, 100 μm. (b; rapamycin, d; DFMO). (g) Representative tumour images by IHC for β-catenin in the experiment of cycloheximide. (h) Model of how post-fast refeeding alters Lgr5+ ISC activity. Post-fast refeeding augments not only regenerative activity but also the intestinal tumourigenic capacity of Lgr5+ ISCs through the mTORC1 and spermidine mediated polyamine synthesis. Data in dot plots were expressed as mean ±SD. *p < 0.05, **p < 0.01, one-way ANOVA.

References

    1. Cheng C. W. & Yilmaz Ö H. 100 Years of Exploiting Diet and Nutrition for Tissue Regeneration. Cell Stem Cell 28, 370–373, doi:10.1016/j.stem.2021.02.014 (2021). - DOI - PMC - PubMed
    1. Nencioni A., Caffa I., Cortellino S. & Longo V. D. Fasting and cancer: molecular mechanisms and clinical application. Nat Rev Cancer 18, 707–719, doi:10.1038/s41568-018-0061-0 (2018). - DOI - PMC - PubMed
    1. Cheng C. W. et al. Prolonged fasting reduces IGF-1/PKA to promote hematopoietic-stem-cell-based regeneration and reverse immunosuppression. Cell Stem Cell 14, 810–823, doi:10.1016/j.stem.2014.04.014 (2014). - DOI - PMC - PubMed
    1. Longo V. D. & Mattson M. P. Fasting: molecular mechanisms and clinical applications. Cell Metab 19, 181–192, doi:10.1016/j.cmet.2013.12.008 (2014). - DOI - PMC - PubMed
    1. Weindruch R., Walford R. L., Fligiel S. & Guthrie D. The retardation of aging in mice by dietary restriction: longevity, cancer, immunity and lifetime energy intake. J Nutr 116, 641–654, doi:10.1093/jn/116.4.641 (1986). - DOI - PubMed

Publication types