[Preprint]. 2023 Jan 2:2022.12.31.522386.
doi: 10.1101/2022.12.31.522386.

Integration of single-cell multiomic measurements across disease states with genetics identifies mechanisms of beta cell dysfunction in type 2 diabetes

Affiliations

Integration of single-cell multiomic measurements across disease states with genetics identifies mechanisms of beta cell dysfunction in type 2 diabetes

Gaowei Wang et al. bioRxiv. .

Update in

Abstract

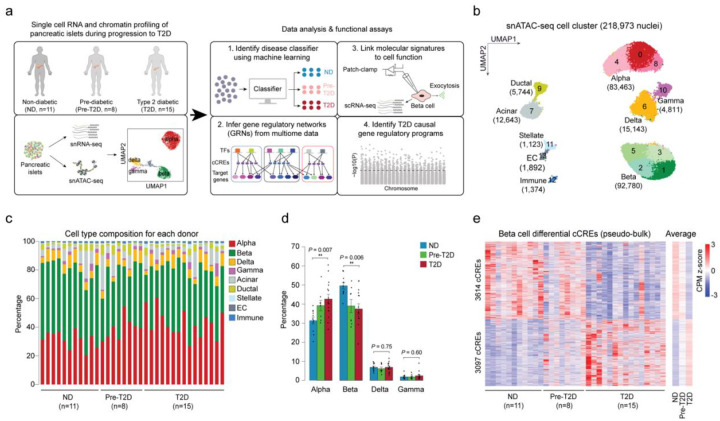
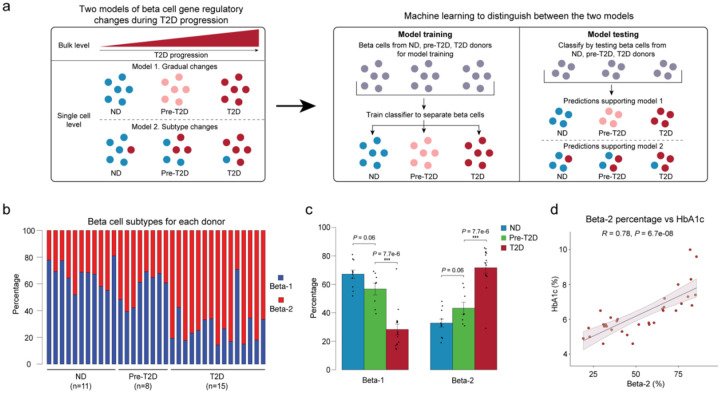
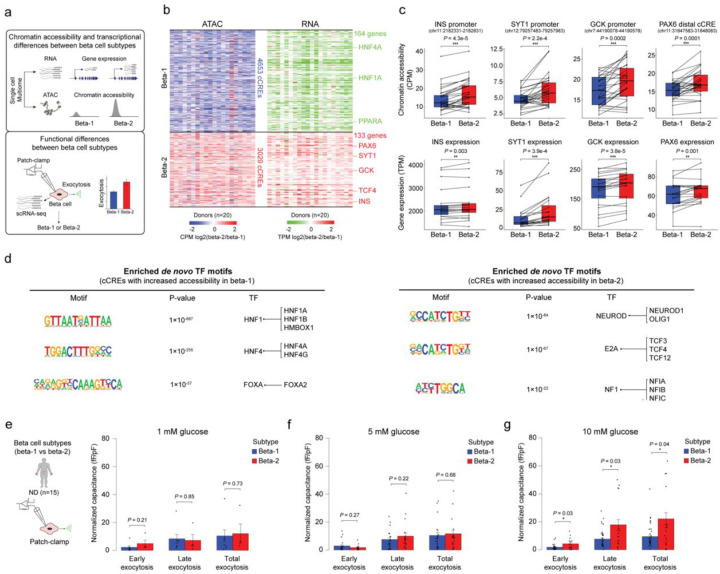
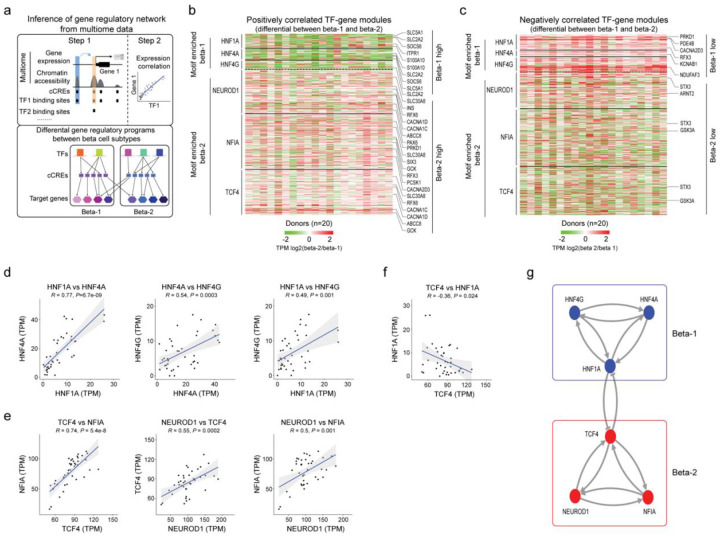
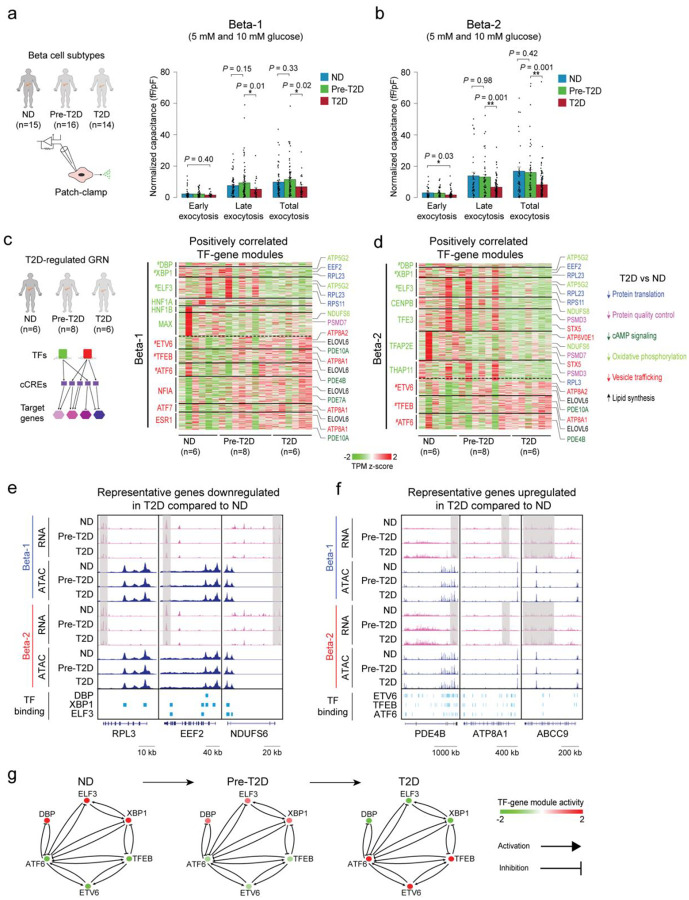
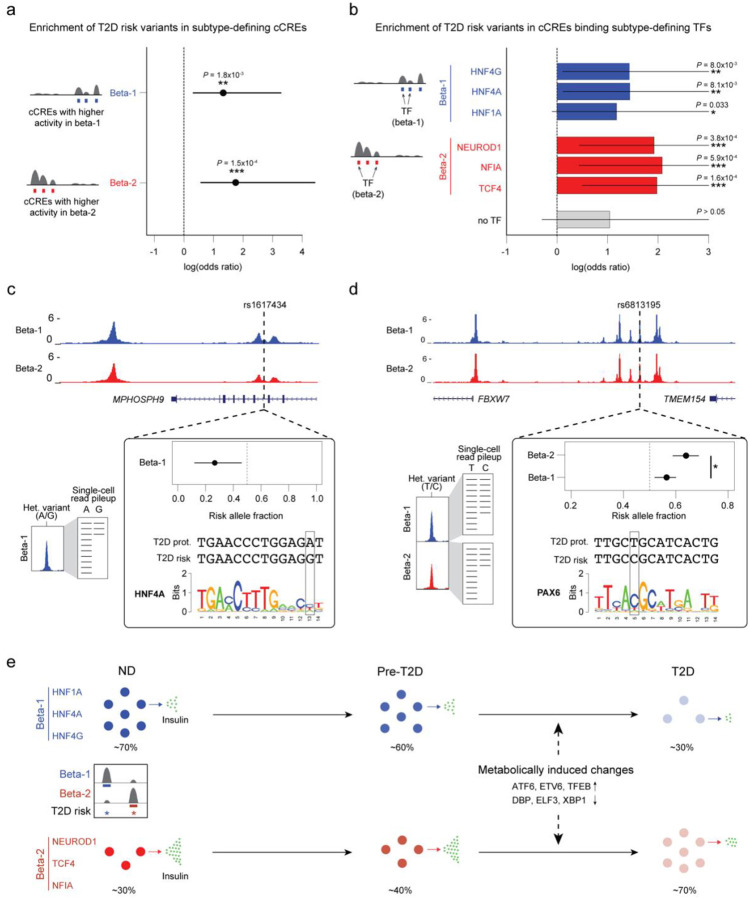
Altered function and gene regulation of pancreatic islet beta cells is a hallmark of type 2 diabetes (T2D), but a comprehensive understanding of mechanisms driving T2D is still missing. Here we integrate information from measurements of chromatin activity, gene expression and function in single beta cells with genetic association data to identify disease-causal gene regulatory changes in T2D. Using machine learning on chromatin accessibility data from 34 non-diabetic, pre-T2D and T2D donors, we robustly identify two transcriptionally and functionally distinct beta cell subtypes that undergo an abundance shift in T2D. Subtype-defining active chromatin is enriched for T2D risk variants, suggesting a causal contribution of subtype identity to T2D. Both subtypes exhibit activation of a stress-response transcriptional program and functional impairment in T2D, which is likely induced by the T2D-associated metabolic environment. Our findings demonstrate the power of multimodal single-cell measurements combined with machine learning for identifying mechanisms of complex diseases.


Conflict of interest statement

Conflict of Interest

K.J.G. does consulting for Genentech and holds stock in Vertex Pharmaceuticals. J.C. is employed by and holds stock in Pfizer Inc.

Figures

Figure 1.
Figure 1.. Beta cells exhibit changes in chromatin activity in type 2 diabetes.
(a) Schematic outlining study design. snATAC-seq was performed on nuclei from pancreatic islets from 11 non-diabetic (ND), 8 pre-diabetic (pre-T2D) and 15 type 2 diabetic (T2D) human donors. Single nucleus multiome (ATAC+RNA) analysis was performed on a subset of donors (6 ND, 8 pre-T2D, 6 T2D). We used machine learning to identify classifiers for beta cells in ND, pre-T2D and T2D, inferred gene regulatory networks (GRNs), linked molecular signatures to beta cell function using Patch-seq, and identified T2D causal gene regulatory programs. (b) Clustering of chromatin accessibility profiles from 218,973 nuclei from non-diabetic, pre-diabetic, and T2D donor islets. Cells are plotted using the first two UMAP components. Clusters are assigned cell type identities based on promoter accessibility of known marker genes. The number of cells for each cell type cluster is shown in parentheses. EC, endothelial cells. (c) Relative abundance of each cell type based on UMAP annotation in Figure 1b. Each column represents cells from one donor. (d) Relative abundance of each islet endocrine cell type in ND, pre-T2D and T2D donor islets. Data are shown as mean ± S.E.M. (n = 11 ND, n = 8 pre-T2D, n = 15 T2D donors), dots denote data points from individual donors. ***P < .001, **P < .01, *P < .05; ANOVA test with age, sex, BMI, and islet index as covariates. (e) Heatmap showing chromatin accessibility at cCREs with differential accessibility in beta cells from ND and T2D donors. Columns represent beta cells from each donor (ND, n=11; pre-diabetic, pre-T2D, n=8; T2D, n=15) and all ND, pre-T2D and T2D donors with accessibility of peaks normalized by CPM (counts per million).
Figure 2.
Figure 2.. Machine learning identifies two beta cell subtypes with differential abundance in T2D.
(a) Schematic outlining the machine learning-based approach to distinguish two models that could account for gene regulatory changes in beta cells in T2D. (b) Relative abundance of beta-1 and beta-2 cells identified by machine learning. Each column represents cells from one donor. (c) Relative abundance of each beta cell subtype in ND, pre-T2D and T2D donor islets. Data are shown as mean ± S.E.M. (n = 11 ND, n = 8 pre-T2D, n = 15 T2D donors), dots denote data points from individual donors. ***P < .001; ANOVA test with age, sex, BMI, and islet index as covariates. (d) Pearson correlation between relative abundance of beta-2 cells and HbA1c across donors (n = 11 ND, n = 8 pre-T2D, n = 15 T2D donors).
Figure 3.
Figure 3.. The two beta cell subtypes are distinguished by chromatin activity, gene expression and function.
(a) Workflow to link beta cell subtype chromatin activity to gene expression using islet single nucleus multiome (ATAC+RNA) data and gene expression to function using Patch-seq. (b) Heatmap showing log2 differences (beta-2/beta-1) in chromatin accessibility at cCREs with differential accessibility between beta cell subtypes (left, paired t-test, FDR < 0.05, P-values adjusted with the Benjamini-Hochberg method) and log2 differences (beta-2/beta-1) in gene expression of cCRE target genes with differential expression between beta cell subtypes (right, paired t-test, FDR < 0.15, P-values adjusted with the Benjamini-Hochberg method). Rows represent differential cCREs or genes, columns represent donors (total 20, ND, n=6; pre-T2D, n=8; T2D, n=6). Representative genes are highlighted. Accessibility of cCREs is normalized by CPM (counts per million) and gene expression by TPM (transcripts per million). (c) Bar plots showing cCRE accessibility (top) and gene expression (bottom) of representative genes in beta-1 and beta-2 cells. Proximal region of INS (chr11:2182331-2182831), SYT1 (chr12:79257483-79257983), GCK (chr7:44190078-44190578), PAX6 (chr11:31847583-31848083). Accessibility of peaks is normalized by CPM and gene expression by TPM. Paired t-test. (d) Transcription factor (TF) motif enrichment at cCREs with higher accessibility in beta-1 compared to beta-2 cells (left) or higher accessibility in beta-2 compared to beta-1 cells (right) against a background of all cCREs in beta cells using HOMER. The top three enriched de novo motifs, their P-values, and best matched known TF motif are shown. (e) Bar plots from Patch-seq analysis showing early, late and total exocytosis in beta-1 (10 cells from 4 ND donors) and beta-2 cells (4 cells from 4 ND donors) stimulated with 1 mM glucose. Data are shown as mean ± S.E.M., dots denote data points from individual cells. ANOVA test with age, sex, and BMI as covariates. (f) Bar plots from Patch-seq analysis showing early, late and total exocytosis in beta-1 (26 cells from 10 ND donors) and beta-2 cells (20 cells from 9 ND donors) stimulated with 5 mM glucose. ANOVA test with age, sex, and BMI as covariates. (g) Bar plots from Patch-seq analysis showing early, late and total exocytosis in beta-1 (42 cells from 5 ND donors) and beta-2 cells (23 cells from 6 ND donors) stimulated with 10 mM glucose. *P < .05, ANOVA test with age, sex, and BMI as covariates.
Figure 4.
Figure 4.. Gene regulatory networks defining the two beta cell subtypes.
(a) Schematic outlining the inference of beta cell gene regulatory networks and differential gene regulatory programs (TF-gene modules) between beta cell subtypes. (b) Heatmap showing log2 differences (beta-2/beta-1) in expression for genes positively regulated by TFs (HNF1A, HNF4A, HNF4G) with higher activity in beta-1 compared to beta-2 cells and TFs (NEUROD1, NFIA and TCF4) with higher activity in beta-2 compared to beta-1 cells (see Methods). Representative target genes of individual TFs are highlighted. Gene expression is normalized by TPM (transcripts per million). (c) Heatmap showing log2 differences (beta-2/beta-1) in expression for genes negatively regulated by TFs (HNF1A, HNF4A, HNF4G) with higher activity in beta-1 compared to beta-2 cells and TFs (NEUROD1, NFIA, TCF4) with higher activity in beta-2 compared to beta-1 cells (see Methods). Representative target genes of individual TFs are highlighted. Gene expression is normalized by TPM (transcripts per million). (d, e, f) Pearson correlation of expression levels between indicated TFs across pseudo-bulk RNA profiles from each beta cell subtype (40 dots in total: 20 donors including n = 6 ND, n = 8 pre-T2D, n = 6 T2D). (g) A bistable circuit established by positive feedback between HNF1A, HNF4A and HNF4G, positive feedback between NEUROD1, NFIA and TCF4, and mutual repression between HNF1A and TCF4.
Figure 5.
Figure 5.. Beta cell functional and gene regulatory changes in T2D.
(a) Bar plots from Patch-seq analysis showing early, late and total exocytosis in beta-1 cells from ND (68 cells from 11 donors), pre-T2D (91 cells from 14 donors) and T2D donors (35 cells from 7 donors) stimulated with 5 mM or 10 mM glucose. Data are shown as mean ± S.E.M., dots denote data points from individual cells. *P < .05, ANOVA test with age, sex, and BMI as covariates. (b) Bar plots from Patch-seq analysis showing early, late and total exocytosis in beta-2 cells from ND (43 cells from 10 donors), pre-T2D (57 cells from 14 donors) and T2D donors (131 cells from 14 donors) stimulated with 5 mM or 10 mM glucose. *P < .05, **P < .01, ANOVA test with age, sex, and BMI as covariates. (c) Heatmap showing expression of genes positively regulated by TFs (green) with higher activity in ND compared to T2D beta-1 cells (see Methods) and TFs (red) with lower activity in ND compared to T2D beta-1 cells (n=6 ND, n=8 pre-T2D, n=6 T2D donors). Representative target genes of individual TFs are highlighted and classified by biological processes. Gene expression is normalized by TPM (transcripts per million). # denotes TFs with decreased or increased expression in T2D in both beta-1 and beta-2 cells. (d) Heatmap showing expression of genes positively regulated by TFs (green) with higher activity in ND compared to T2D beta-2 cells (see Methods) and TFs (red) with lower activity in ND compared to T2D beta-2 cells (n=6 ND, n=8 pre-T2D, n=6 T2D donors). Representative target genes of individual TFs are highlighted and classified by biological processes. Gene expression is normalized by TPM (transcripts per million). # denotes TFs with decreased or increased expression in T2D in both beta-1 and beta-2 cells. (e) Genome browser tracks showing aggregate RNA and ATAC read density at representative genes (RPL3, EEF2, NDUFS6) downregulated in T2D relative to ND for both beta-1 and beta-2 cells. Downregulated regions in T2D beta cells are indicated by grey shaded boxes. Beta cell cCREs with binding sites for downregulated TFs in both beta-1 and beta-2 cells (DBP, XBP1, ELF3) are shown. All tracks are scaled to uniform 1×10⁶ read depth. (f) Genome browser tracks showing aggregate RNA and ATAC read density at representative genes (PDE4B, ATP8A1, ABCC9) upregulated in T2D relative to ND for both beta-1 and beta-2 cells. Upregulated regions in T2D beta cells are indicated by grey shaded boxes. Beta cell cCREs with binding sites for upregulated TFs in both beta-1 and beta-2 cells (ETV6, TFEB, ATF6) are shown. All tracks are scaled to uniform 1×10⁶ read depth. (g) Cross regulation between TFs with activity change in T2D in both beta cell subtypes (from Figure 5c,d). The color code for TFs in ND, pre-T2D and T2D donors reflects their expression change during T2D progression.
Figure 6.
Figure 6.. T2D risk variants affect beta cell subtype chromatin activity.
(a) Enrichment of fine-mapped T2D risk variants for cCREs defining the beta-1 and beta-2 subtype. Values represent log odds ratios and 95% confidence intervals. (b) Enrichment of fine-mapped T2D risk variants for cCREs defining the beta-1 and beta-2 subtype bound by each TF, or not bound by any of the listed TFs (‘no TF’). Values represent log odds ratios and 95% confidence intervals. (c) Fine-mapped T2D risk variant rs1617434 at the MPHOSPH9 locus overlaps a cCRE defining the beta-1 subtype. The T2D risk allele of this variant decreases beta-1 chromatin accessibility and disrupts a predicted binding site for HNF4A. The values for allelic imbalance represent the fraction of reads from the risk allele and the 95% confidence interval. On the left is a schematic describing allelic imbalance mapping in reads from the beta-1 subtype. (d) Fine-mapped T2D risk variant rs6813185 at the TMEM154/FBXW7 locus overlaps a cCRE active in both the beta-1 and beta-2 subtype. This variant has significant heterogeneity in allelic imbalance in beta-2 and beta-2 chromatin accessibility, where the T2D risk allele has larger effect in beta-2 compared to beta-1. The values for allelic imbalance represent the fraction of reads from the risk allele and the 95% confidence interval. On the left is a schematic describing allelic imbalance mapping in reads from the beta-1 and beta-2 subtype. * P<.05. (e) Schematic showing abundance and functional changes of beta cell subtypes during T2D progression. The TFs maintaining beta cell subtype identity as well as TFs mediating T2D-associated changes are shown.

References

    1. Noguchi G.M. & Huising M.O. Integrating the inputs that shape pancreatic islet hormone release. Nat Metab 1, 1189–1201 (2019). - PMC - PubMed
    1. Wojtusciszyn A., Armanet M., Morel P., Berney T. & Bosco D. Insulin secretion from human beta cells is heterogeneous and dependent on cell-to-cell contacts. Diabetologia 51, 1843–1852 (2008). - PubMed
    1. Dominguez-Gutierrez G., Xin Y. & Gromada J. Heterogeneity of human pancreatic beta-cells. Mol Metab 27S, S7–S14 (2019). - PMC - PubMed
    1. Benninger R.K.P. & Kravets V. The physiological role of beta-cell heterogeneity in pancreatic islet function. Nat Rev Endocrinol (2021). - PMC - PubMed
    1. Segerstolpe A., et al. Single-Cell Transcriptome Profiling of Human Pancreatic Islets in Health and Type 2 Diabetes. Cell Metab 24, 593–607 (2016). - PMC - PubMed

Publication types