[Preprint]. 2023 Jan 16:2023.01.13.523828.
doi: 10.1101/2023.01.13.523828.

An Open-Source Platform for Head-Fixed Operant and Consummatory Behavior

Affiliations

An Open-Source Platform for Head-Fixed Operant and Consummatory Behavior

Adam Gordon-Fennell et al. bioRxiv. .

Update in

Abstract

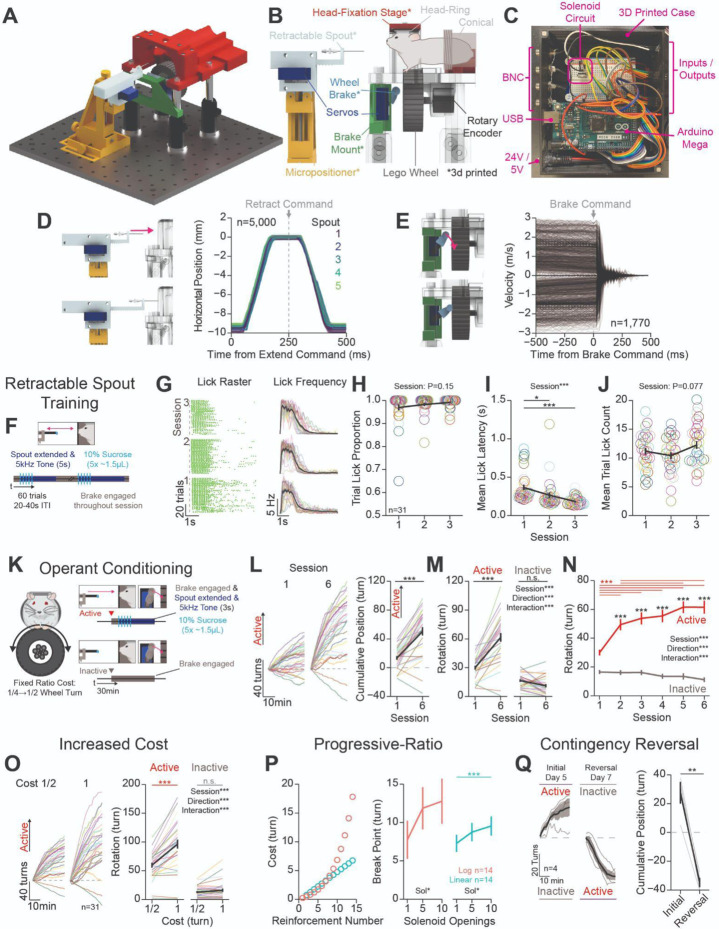
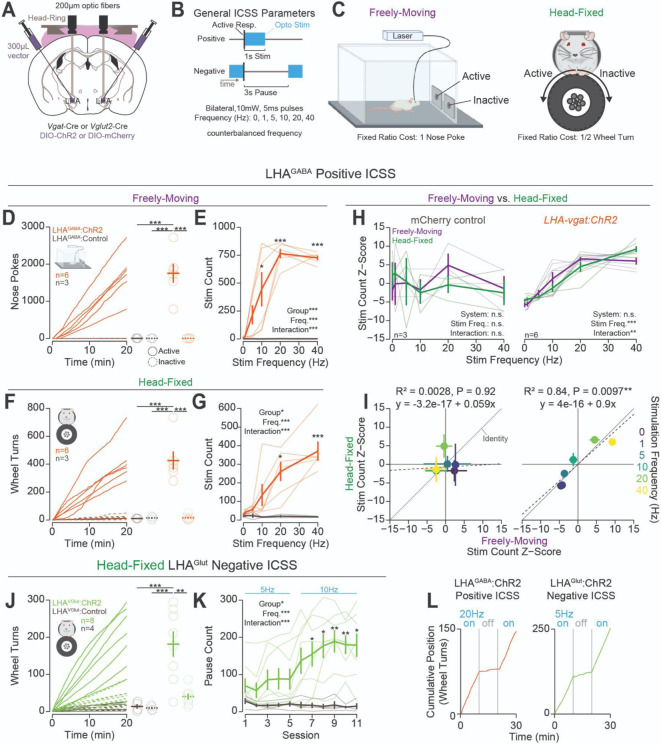
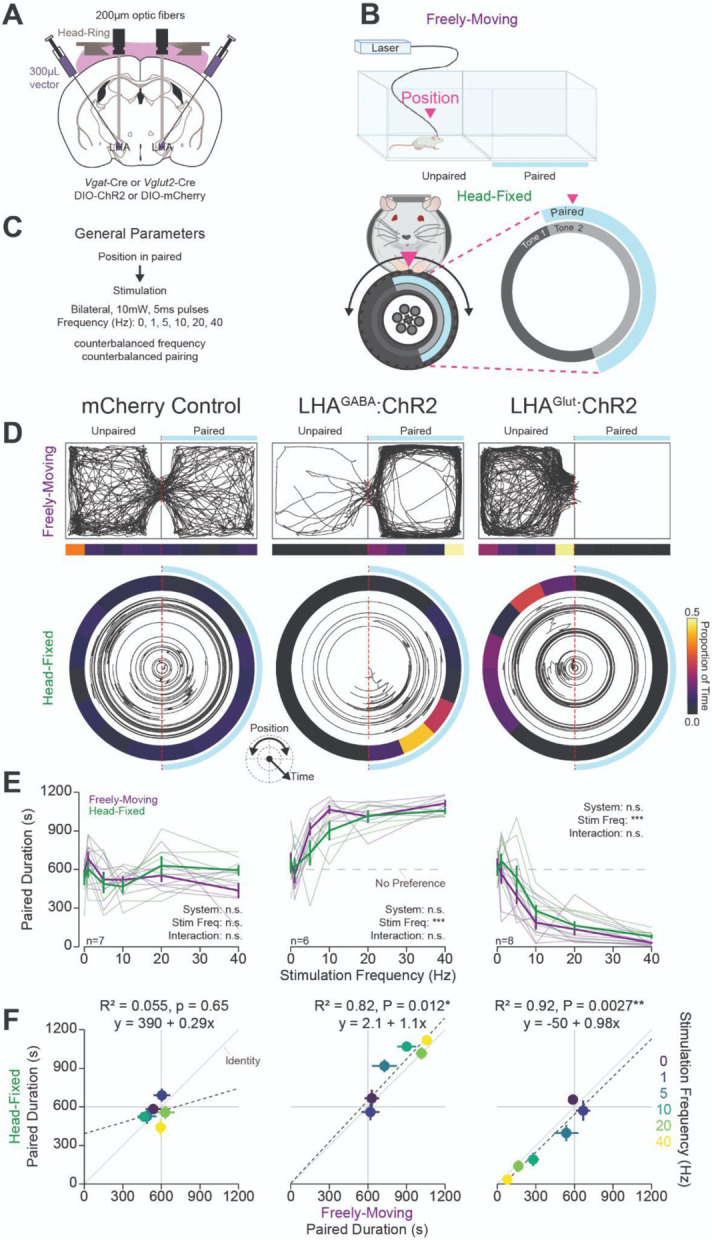
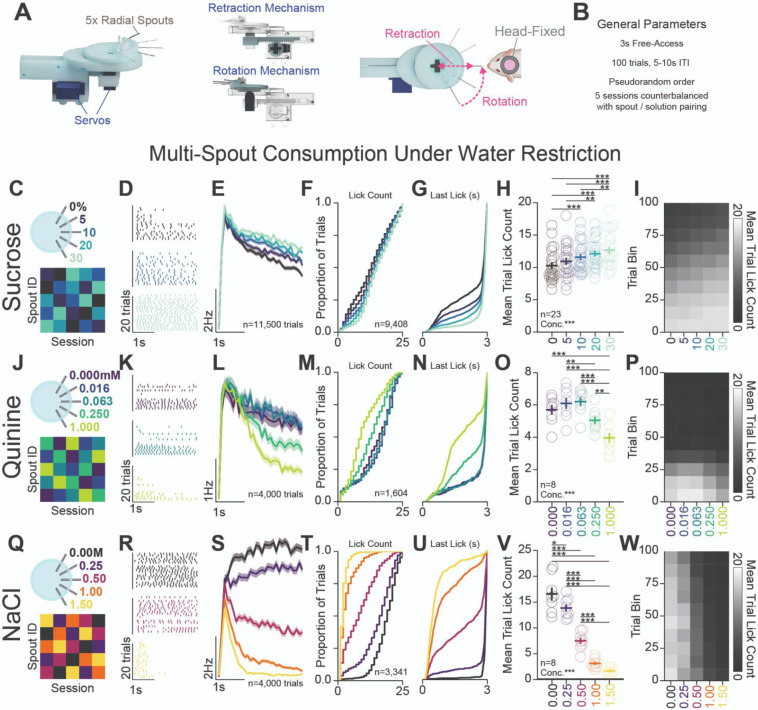
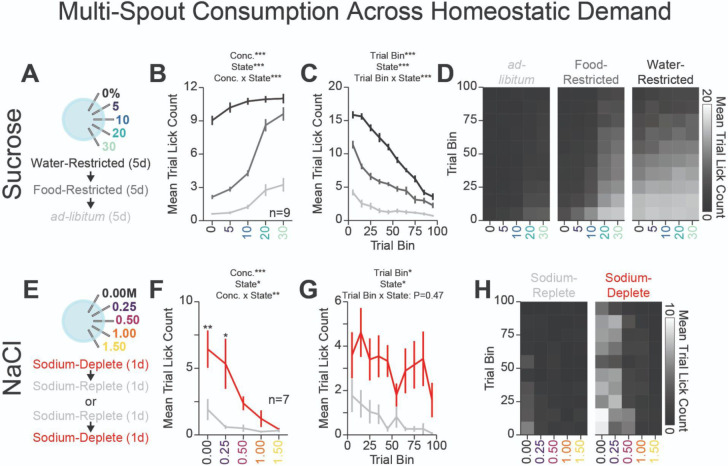
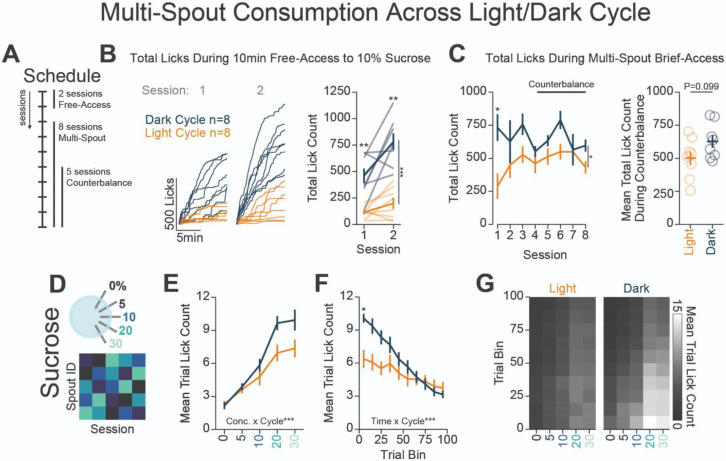
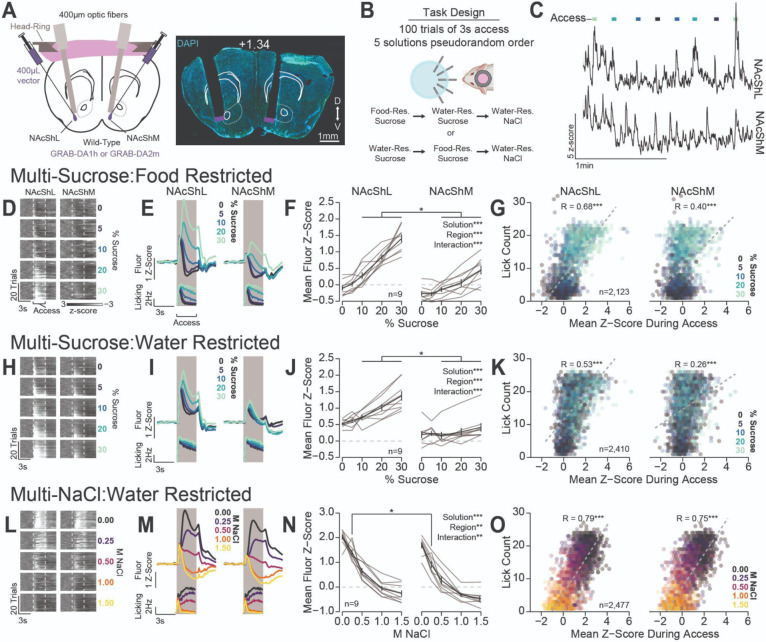
Head-fixed behavioral experiments in rodents permit unparalleled experimental control, precise measurement of behavior, and concurrent modulation and measurement of neural activity. Here we present OHRBETS (Open-Source Head-fixed Rodent Behavioral Experimental Training System; pronounced 'Orbitz'), a low-cost, open-source ecosystem of hardware and software to flexibly pursue the neural basis of a variety of motivated behaviors. Head-fixed mice tested with OHRBETS displayed operant conditioning for caloric reward that replicates core behavioral phenotypes observed during freely moving conditions. OHRBETS also permits for optogenetic intracranial self-stimulation under positive or negative operant conditioning procedures and real-time place preference behavior, like that observed in freely moving assays. In a multi-spout brief-access consumption task, mice displayed licking as a function of concentration of sucrose, quinine, and sodium chloride, with licking modulated by homeostatic or circadian influences. Finally, to highlight the functionality of OHRBETS, we measured mesolimbic dopamine signals during the multi-spout brief-access task that display strong correlations with relative solution value and magnitude of consumption. All designs, programs, and instructions are provided freely online. This customizable ecosystem enables replicable operant and consummatory behaviors and can be incorporated with methods to perturb and record neural dynamics in vivo .

Impact statement: A customizable open-source hardware and software ecosystem for conducting diverse head-fixed behavioral experiments in mice.


Figures

Figure 1:
Figure 1:. Mice Rapidly Learn Head-Fixed Operant Conditioning for Sucrose and Display Operant Behaviors Established in Freely moving Experiments:
(A-E) System overview. (A) 3D rendering of our open-source, low-cost, head-fixed system (Open-Source). B) Cartoon depicting the critical components of our system (* indicates 3D printed components). C) Image of the Arduino based microprocessor and custom enclosure used for controlling hardware and recording events. D) Validation of our 3D printed retractable spout powered by a low-cost micro servo. left: 3D rendering of the linear travel of the spout; right: horizontal position of the spout tip determined using DeepLabCut over time during 1,000 extension/retractions with 5 unique retractable spout units. E) Validation of our 3D printed wheel brake powered by a low-cost micro servo. 3D rendering of the rotational travel of the wheel brake (left); binned rotational velocity of the wheel produced by manual rotation before and after the brake is engaged (right). F) Cartoon depicting the task design for retractable spout training. G) Licking behavior throughout retractable spout training; lick raster for a representative mouse with each lick represented as a tick (left); mean binned frequency of licks (right). (H-J) Summary of behavior throughout retractable spout training: proportion of trials with at least 1 lick (H); Mean latency from spout extension command to first lick on trials with a lick (I); mean number of licks within each 5 s access period (J). K) Cartoon depicting the task design for operant conditioning. L) Cumulative position of the wheel throughout the session (left) and at the conclusion of the session (right) on the first and sixth session of training (Positive direction indicate rotation in the active direction; session 1 vs session 6 t-test***). (M-N) Total rotation of the wheel throughout a session broken down based on direction on the first and sixth session of training (M) and across training sessions (N). O) Cumulative position of the wheel throughout the last session (left), and the mean total rotation of the wheel in the last 3 sessions of fixed-ratio 1/2 turn and 1 turn. P) Progressive-ratio schedule of reinforcement (left) and break points across different reward magnitudes set by the number of solenoid openings (One-Way RM ANOVA*). Q) Cumulative position of the wheel throughout the session (left) and at the conclusion of the session (right) on the last session of initial training and reversal training (t-test; initial vs. reversal: t-test**). (Unless otherwise noted, effects listed on plots indicate statistical significance for Two-Way RM ANOVA effects; Multi color lines and rings depict individual mice; Black lines depict mean across mice; Black asterisks above horizontal bars in (N) and (P) indicate significant differences in active rotation across sessions, while black asterisks above means indicate significant differences between active and inactive rotation within a session; see stats table for details).
Figure 2
Figure 2. Head-fixed Operant Conditioning to Obtain Stimulation of LHAGABA Neurons or Avoid Stimulation of LHAGlut Neurons:
A) Approach, placements depicted in Figure 2- figure supplement 1A. B) Diagram of the experimental approach for positive reinforcement in LHAGABA mice and negative reinforcement in LHAGlut mice. C) Cartoon depicting the freely moving (left) and head-fixed (right) versions of the operant task. D) Cumulative (left) and total (right) nose pokes under positive reinforcement for 40 Hz stimulation in LHAGABA:ChR2 (red) and LHAGABA:Control (grey) mice. E) Total number of stimulations earned under positive reinforcement for multiple stimulation frequencies (1 frequency/session). (F, G) same as (D, E) except during the head-fixed version of the task. H) Comparisons of the z-score of the total number of stimulations across frequencies in freely moving (purple) and head-fixed (green). Z-scores were calculated for each mouse x system independently. No significant post hoc differences when comparing systems at the same stimulation frequency. I) Correlation of the z-score of the total number of stimulations in the freely moving and head-fixed version of the task. J) Cumulative rotation over a session under negative reinforcement for 5 Hz and 10 Hz stimulation in LHAGlut:ChR2 (lime green) and LHAGlut:Control (grey) mice. K) Total pause count across all training sessions (frequency schedule indicated with blue text above the plot; asterisks above means indicate significant differences determined by Bonferroni adjusted t-test). L) Cumulative position over a 30 min session with the laser turned off from 10-20 min. (Unless otherwise noted, Effects listed on plots indicate statistical significance for Two-Way RM ANOVA effects; Faded lines and rings depict individual mice; asterisks above means indicate significant differences determined by HSD between stim count at a corresponding stim frequency or pause count at a corresponding session; asterisks above horizontal lines indicate significant difference determined by HSD between means indicated by line; see stats table for details).
Figure 3
Figure 3. Head-fixed Real-Time Place Preference and Aversion Associated with Stimulation of LHA Subpopulations Mirrors Freely moving Behavior:
A) Approach, placements depicted in Figure 2-figure supplement 1A. B) Cartoon depicting the freely moving and head-fixed versions of the operant task. In the head-fixed task, the mouse’s position was determined relative to the position of the wheel and the mouse could rotate the wheel to navigate through the paired and unpaired zones. C) Task design. (D-F) Behavior during the RTPT task; left column contains data from mCherry controls (both LHAGABA:Control and LHAGlut:Control), middle contains LHAGABA:ChR2, right contains LHAGlut:ChR2. D) Representative traces of the mouse’s position in the 2 chamber arena in freely moving RTPT (top) and the position of the wheel over time in head-fixed RTPT (bottom). The right side of the arena or wheel was paired with optogenetic stimulation as indicated by the blue bar/arc. The proportion of time in binned areas of the arena or wheel are shown in the heat maps under or surrounding the traces (color scale represents the proportion of time in each position bin). E) Amount of time spent in the paired zone during a 20 min (1200 s) session for varying frequencies; values above 600 s are indicative of preference, values below are indicative of avoidance. Colors represent the version of the task as indicated in the left column. F) Correlation between the mean time spent in the paired zone across mice (5 values) during freely moving (abscissa) and the head-fixed (ordinate) versions of RTPT at different stimulation frequencies (colors represent stimulation frequency; error bars represent SEM). (In (E) asterisks depict Two-Way RM ANOVA effects, no HSD differences between systems were detected at corresponding stimulation frequencies; see stats table for details).
Figure 4
Figure 4. Head-Fixed Consumption of Gradients of Rewarding and Aversive Solutions During Brief Access:
A) 3D rendering of the multi-spout unit that retracts and rotates to allow brief access periods to 1 of 5 lick spouts to the head-fixed mouse. B) Task design. (C-I) Multi-spout consumption of a gradient of concentrations of sucrose data. C) Procedure: mice received 5 sessions of 5x multi-spout counterbalanced to have each solution of each spout once. Colors represent concentrations of solution as defined in the label adjacent to the multi-spout cartoon. D) Lick raster of a representative mouse depicting the licks for water, medium concentration, and high concentration during the 3 s access period. E) Mean binned lick rate for all mice for each concentration. (F-G) Cumulative distribution of the number of licks in trials with a ylick (F) and the time of the last lick within each licking bout (G). H) The mean number of licks per trial for each concentration. I) The mean number of licks for each concentration per trial binned by 10 trials over the course of the session. (J-P) same as (C-I), but for data from multi-spout consumption of a gradient of concentrations of quinine. (Q-W) same as (C-I), but for data from multi-spout consumption of a gradient of concentrations of NaCl. (Main effects listed on plots are results of One-Way RM ANOVA; asterisks depict HSD comparisons between concentrations indicated by horizontal line; Faded lines depict individual mice; see stats table for details).
Figure 5
Figure 5. Homeostatic Demand Shifts Within Session Consumption of Gradients of Sucrose and NaCl:
A) Procedure: Mice ran sequentially through water-restriction, food-restriction, and ad-libitum states During each state, mice received 5 sessions of multi-spout counterbalanced to have each concentration of sucrose on each spout once. B) The mean number of licks per trial for each concentration of sucrose in the ad-libitum (light gray), food-restricted (dark gray), and water-restricted (black) states (HSD: every mean is significantly different from every other, except 30% sucrose consumption under food and water-restriction). C) Mean trial lick count across all concentrations of sucrose in bins of 10 trials across the session for each homeostatic state. D) The mean number of licks for each concentration of sucrose per trial binned by 10 trials over the course of the session for each homeostatic state. E) Procedure: In sodium replete or sodium deplete states in counterbalanced order, mice received 1 session of multi-spout with a gradient of concentrations of NaCl. The pairing of solution concentrations and spouts remained consistent. F) The mean number of licks per trial for each concentration of NaCl in the sodium replete (gray) and deplete (red) states. G) Mean trial lick count across all concentrations of NaCl in bins of 10 trials across the session for each homeostatic state. H) The mean number of licks for each concentration of NaCl per trial binned by 10 trials over the course of the session for each homeostatic state. (Main effects listed on plots are results of Two-Way RM ANOVA; asterisks indicate differences between homeostatic demand state at a corresponding concentration; see stats table for details).
Figure 6
Figure 6. Light/Dark Cycle Shifts Within-Session Consumption of Gradients of Sucrose:
A) Schedule for behavioral sessions. B) Licking behavior during two sessions of free-access licking for 10% sucrose displayed as cumulative licking (left) and total lick count during the session (right). Mice ran in the dark-cycle licked more than mice ran in the light-cycle (Two-Way RM ANOVA: Cycle***). C) Total licking behavior during 8 sessions of multi-spout brief-access to a gradient of sucrose concentration (left) and mean over 5 counterbalance sessions (right). Mice ran in the dark-cycle licked more than mice in the light-cycle over all 8 sessions (Two-Way RM ANOVA: Cycle*), but not over the 5 counterbalanced sessions (t-test: P=0.099). D) Procedure: mice were trained in 5 sessions of 5x sucrose multi-spout counterbalanced to have each solution of each spout once. E) The mean number of licks per trial for each concentration of sucrose for mice ran in the dark-cycle (blue) and mice ran in the light-cycle (orange) (Two-Way RM ANOVA: Concentration x Cycle***). F) Mean trial lick count across all concentrations of sucrose in bins of 10 trial across the session (Two-Way RM ANOVA: Time x Cycle***). G) The mean number of licks for each concentration of sucrose per trial binned by 10 trials over the course of the session. (Asterisks above means indicate differences between mice tested in each cycle during the same session).
Figure 7
Figure 7. Differential Dopamine Dynamics During Multi-Spout Consumption Behavior:
A) Approach for simultaneously recording dopamine dynamics in the NAcShL and NAcShM (left), and representative placements of optic fibers overlaying the NAcSh (White numerical value indicates AP position relative to bregma). B) Task design and schedule of experiment. C) Representative trace of simultaneous GRAB-DA fluorescence in the NAcShM and NAcShL during multi-spout access to sucrose under food-restriction (lines on top indicate access periods, color indicates sucrose concentration). (D-G) Dopamine dynamics during multi-sucrose under food-restriction: D) Representative heat map of GRAB-DA fluorescence over time during each trial sorted by sucrose concentration (trials averaged over 3 sessions of recording). E) Perievent time histograms of GRAB-DA fluorescence (top) and licks (bottom). F) Mean fluorescence z-score during access period indicating strong scaling in the NAcShL (left) and weak scaling in the NAcShM (right). G) On individual trials, the mean z-score during access correlates with licking in both the NAcShL (left), and NAcShM (right) (color depicts the solution concentration). (H-K) Same as D-G for dopamine dynamics during multi-sucrose under water-restriction. (L-O) Same as D-G for dopamine dynamics during multi-NaCl under water-restriction. N) Strong scaling in NAcShL (left) and weak scaling in the NAcShM (right). (Asterisks indicate differences between brain regions at the same solution concentration; Two-Way RM ANOVA effects indicated in F, J, N; correlations indicated in G, K, O; see stats table for details).

References

    1. Aghajan Z. M., Acharya L., Moore J. J., Cushman J. D., Vuong C. & Mehta M. R. (2015). Impaired spatial selectivity and intact phase precession in two-dimensional virtual reality. Nature Neuroscience, 18(1), 121–128. 10.1038/nn.3884 - DOI - PubMed
    1. Aronov D. & Tank D. W. (2014). Engagement of Neural Circuits Underlying 2D Spatial Navigation in a Rodent Virtual Reality System. Neuron, 84(2), 442–456. 10.1016/j.neuron.2014.08.042 - DOI - PMC - PubMed
    1. Backyard Brains. (2013). Searcher- 3-D Printable Micromanipulator. https://backyardbrains.com/products/micromanipulator
    1. Bainier C., Mateo M., Felder-Schmittbuhl M.-P. & Mendoza J. (2017). Circadian rhythms of hedonic drinking behavior in mice. Neuroscience, 349, 229–238. 10.1016/j.neuroscience.2017.03.002 - DOI - PubMed
    1. Bjerre A.-S. & Palmer L. M. (2020). Probing Cortical Activity During Head-Fixed Behavior. Frontiers in Molecular Neuroscience, 13, 30. 10.3389/fnmol.2020.00030 - DOI - PMC - PubMed

Publication types