[Preprint]. 2023 Jan 13:2023.01.11.523652.
doi: 10.1101/2023.01.11.523652.

Distinct Mechanisms Underlie Electrical Coupling Resonance and Its Interaction with Membrane Potential Resonance

Affiliations

Distinct Mechanisms Underlie Electrical Coupling Resonance and Its Interaction with Membrane Potential Resonance

Xinping Li et al. bioRxiv. .

Update in

  • This article has been published with doi: 10.3389/fsysb.2023.1122433

Abstract

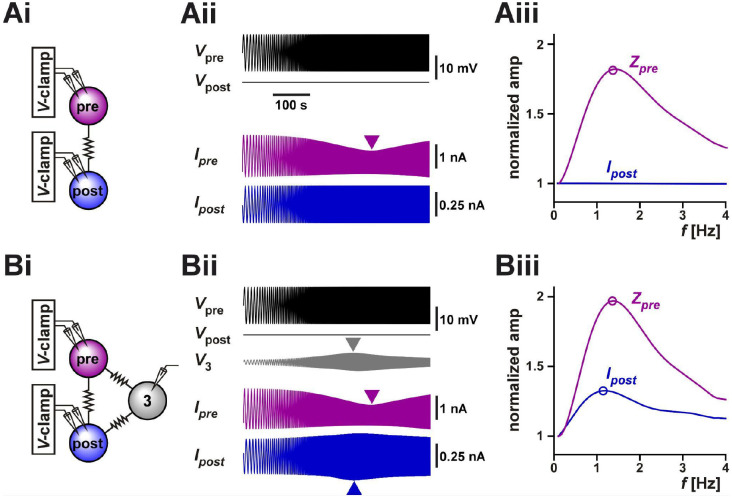
Neurons in oscillatory networks often exhibit membrane potential resonance, a peak impedance at a non-zero input frequency. In electrically coupled oscillatory networks, the coupling coefficient (the ratio of post- and prejunctional voltage responses) could also show resonance. Such coupling resonance may emerge from the interaction between the coupling current and resonance properties of the coupled neurons, but this relationship has not been clearly described. Additionally, it is unknown if the gap-junction mediated electrical coupling conductance may have frequency dependence. We examined these questions by recording a pair of electrically coupled neurons in the oscillatory pyloric network of the crab Cancer borealis. We performed dual current- and voltage-clamp recordings and quantified the frequency preference of the coupled neurons, the coupling coefficient, the electrical conductance, and the postjunctional neuronal response. We found that all components exhibit frequency selectivity, but with distinct preferred frequencies. Mathematical and computational analysis showed that membrane potential resonance of the postjunctional neuron was sufficient to give rise to resonance properties of the coupling coefficient, but not the coupling conductance. A distinct coupling conductance resonance frequency therefore emerges either from other circuit components or from the gating properties of the gap junctions. Finally, to explore the functional effect of the resonance of the coupling conductance, we examined its role in synchronizing neuronal the activities of electrically coupled bursting model neurons. Together, our findings elucidate factors that produce electrical coupling resonance and the function of this resonance in oscillatory networks.

Keywords: Central Pattern Generator; Gap Junctions; Oscillation; Stomatogastric.


Conflict of interest statement

Conflict of Interest The authors declare that the research was conducted in the absence of any commercial or financial relationships that could be construed as a potential conflict of interest.

Figures

Figure 1.
Figure 1.
The two PD neurons produce synchronized slow wave bursting due to their strong electrical coupling. (A) Somatic recording of the two PD neurons shows that they produce bursting oscillations that are synchronized in their slow-wave activity. (B) Measurement of coupling coefficient between the two PD neurons. The prejunctional PD1 neuron is voltage clamped with steps ranging from −80 to −40 mV from a holding potential of −60 mV. The postjunctional PD2 neuron membrane potential is recorded in current clamp. The coupling coefficient CC is measured as the slope of the linear fit to the values of Vpost plotted vs. Vpre. Each data point is the mean value of voltage during the step, as seen in the grey point, corresponding to the lowest steps (arrows). (C) Measurement of coupling conductance between the two PD neurons. The prejunctional PD1 neuron is voltage clamped as in panel B, while the postjunctional PD2 neuron is voltage clamped at a steady holding potential of −60 mV (not shown). The coupling conductance Gc is measured as the slope of the linear fit to the values of Ipost plotted vs. Vpre. Each data point is the mean value the step, as seen in the grey point, corresponding to the lowest Vpre and highest Ipost steps (arrows).
Figure 2
Figure 2
The coupling coefficient (CC) between the two PD neurons shows resonance. (A) A ZAP current, sweeping a frequency range of 0.1 to 4 Hz, was applied to one PD neuron to simultaneously measure the voltage changes in both PD neurons. (Ai) Both neurons showed a peak amplitude response at an intermediate frequency (marked by arrowheads). Schematic shows the two coupled neurons monitored in current clamp. (Aii) The prejunctional impedance (Zpre) and CC of the data shown in Ai. A 6th order polynomial fit (smooth curves) to the raw data was used to measure the peak amplitude and resonance frequency (circled). (B) Zpre and CC have distinct resonances. Averaged frequency profiles of CC and Zpre are shown, both normalized to their amplitude at 0.1 Hz. CC had a smaller resonance frequency than Zpre (p<0.001) and higher resonance power (p=0.037). N=19, paired Student’s t-test. (C-D) The resonance frequency of CC was correlated with the resonance frequency of both Zpre and Zpost (C), while its maximum amplitude was only correlated with that of Zpost (D).
Figure 3
Figure 3
The coupling conductance shows a frequency-dependent resonance which is distinct from the resonance of the coupled PD neurons. (A) The two PD neurons were voltage clamped, the prejunctional neuron with a ZAP waveform, sweeping a frequency range of 0.1 to 4 Hz and a voltage range of −60 to −30 mV, while the postjunctional neuron was held at constant holding potential of −60 mV (not shown), and the current flow in both neurons was measured. (Ai) Ipre showed a minimum value at an intermediate frequency, reflecting the intrinsic resonance of the prejunctional neuron (magenta arrowhead), while Ipost showed a peak at a distinct frequency (blue/bronze arrowheads). Schematic represents the two coupled neurons in voltage clamp. (Aii) The prejunctional impedance (Zpre) and Gc measured from the data shown in Ai. A 6th order polynomial fit (smooth curves) to the raw data was used to measure the peak amplitude and resonance frequency (circled). The peak of Gc corresponds to the bronze color arrowhead in Ai. (Bi) The frequency profile of Gc across experiments shows a peak below 1 Hz. (Bii) Zpre and Gc have distinct resonances. Averaged frequency profiles of CC and Zpre are shown, both normalized to their amplitude at 0.1 Hz. Gc had a smaller resonance frequency than Zpre (p<0.001) but comparable resonance power ZPD (p=0.525). N=20, paired Student’s t-test. (C-D) Neither the resonance frequency (C), nor the resonance amplitude (D) of Gc was correlated with that of Zpre or Zpost.
Figure 4
Figure 4
(A) Membrane impedance of the pre- and postjunctional PD model neurons (Zpre and Zpost, respectively) were measured by the response of the voltage amplitude to an oscillatory ZAP current input spanning 0.1 Hz to 4 Hz. Coupling coefficient (CC) was measured as the impedance profile of the pre (1) and post (2) synaptic cells are the same when synaptically isolated, shown as the gray line in Aii, and differ in amplitude when electrically coupled (shown as the purple line for Zpre and the blue line in Zpost). The coupling coefficient has a resonance frequency that is similar to the membrane impedance profiles. (B) (the analytical calculation) shown for when the isolated pre (1) and post (2) synaptic cells have different resonant frequencies, indicated as Z1 and Z2, and display an intermediate resonant frequency when electrically coupled. In contrast, the coupling coefficient resonant frequency does not take a value between the resonant frequencies of Z1 and Z2. (C) The resonant frequencies are shown as a function of increasing γc, where the membrane impedance fRes converge to a value that is intermediate to the resonance frequencies of the isolated cells (indicated as cell 1 and 2). The coupling coefficient value increases monotonically as a function of γc. (D) The maximal impedances for the isolated cells are equal (shown as dashed gray line, the same as in (B)), and approach a similar, lesser value as a function of increasing γc. (E) The case of a frequency-dependent coupling conductance is considered, where it Gc is either at a fixed value (1, Gc constant, dashed line) or changes as a function of frequency (resonant, solid line). The membrane impedance profiles are compared in both cases, with a negligible effect on resonance frequency and amplitude for both Zpre and Zpost, with an effect of similar magnitude for the coupling coefficient.
Figure 5
Figure 5
Coupling to a third resonant neuron can produce resonance in the coupling current between two voltage-clamped neurons. (A) The coupling current between two identical model neurons with resonant properties was measured in voltage clamp (schematic in Ai). The prejunctional neuron was voltage clamped with a ZAP waveform spanning from 0.1 Hz to 4 Hz and voltage range of −60 to −45 mV. The postjunctional neuron was voltage clamped at a holding potential of −60 mV. The postjunctional current amplitude showed no frequency dependence (Aii). As a function of input frequency, the prejunctional impedance shows resonance, but the post junctional current remains constant. For comparison, Zpre and Ipost are normalized to their value at 0.1 Hz. (B) The same protocol as A, but the two neurons are both coupled to a third (identical) neuron which is not voltage clamped (schematic in Bi). The addition of the third cell leads to a frequency-dependent response in the voltage of the third neuron (Bii) and in resonance in the postjunctional current (Biii). For comparison, Zpre and Ipost are normalized to their value at 0.1 Hz.
Figure 6
Figure 6
Resonance in the coupling conductance influences the level of synchrony between two model bursting neurons. (A) The level of synchrony between two model bursting neurons, coupled with a resonant Gc (schematic), depends on the network oscillation frequency. The three columns show superimposed phase-locked oscillations of two model bursting neurons at three frequencies. The second row is a zoom in to a single burst. The third row shows lowpass filtered traces (slow), highlighting the level of asynchrony of the burst slow waves. The bottom row shows the high pass filtered traces (fast = full - slow), highlighting the lack of synchrony of spiking activity. Gray boxes correspond to frequencies and Gc values as shown in panel B. (B) Coupling conductance is modeled to show resonance at f = 0.75 Hz. The level of synchrony between the two coupled neurons, measured as a coefficient of determination R2 of their voltage waveforms depends on the network frequency. Changing the network frequency increases synchrony of the slow and full waveforms, but not the fast spiking activity. (C) R2 increases with the coupling conductance. Tables`

References

    1. Alcamí P., and Pereda A.E. (2019). Beyond plasticity: the dynamic impact of electrical synapses on neural circuits. Nat Rev Neurosci 20(5), 253–271. doi: 10.1038/s41583-019-0133-5. - DOI - PubMed
    1. Armstrong-Gold C.E., and Rieke F. (2003). Bandpass filtering at the rod to second-order cell synapse in salamander (Ambystoma tigrinum) retina. J Neurosci 23(9), 3796–3806. doi: 10.1523/JNEUROSCI.23-09-03796.2003. - DOI - PMC - PubMed
    1. Bem T., and Rinzel J. (2004). Short duty cycle destabilizes a half-center oscillator, but gap junctions can restabilize the anti-phase pattern. J. Neurophysiol. 91, 693–703. - PubMed
    1. Bennett M.V. (1966). Physiology of electrotonic junctions. Ann N Y Acad Sci 137(2), 509–539. doi: 10.1111/j.1749-6632.1966.tb50178.x. - DOI - PubMed
    1. Blitz D.M., Beenhakker M.P., and Nusbaum M.P. (2004). Different sensory systems share projection neurons but elicit distinct motor patterns. J Neurosci 24(50), 11381–11390. doi: 24/50/11381 [pii] 10.1523/JNEUROSCI.3219-04.2004. - DOI - PMC - PubMed

Publication types