[Preprint]. 2023 Feb 20:2023.01.18.524545.
doi: 10.1101/2023.01.18.524545.

Spatially aware deep learning reveals tumor heterogeneity patterns that encode distinct kidney cancer states

Affiliations

Spatially aware deep learning reveals tumor heterogeneity patterns that encode distinct kidney cancer states

Jackson Nyman et al. bioRxiv. .

Update in

Abstract

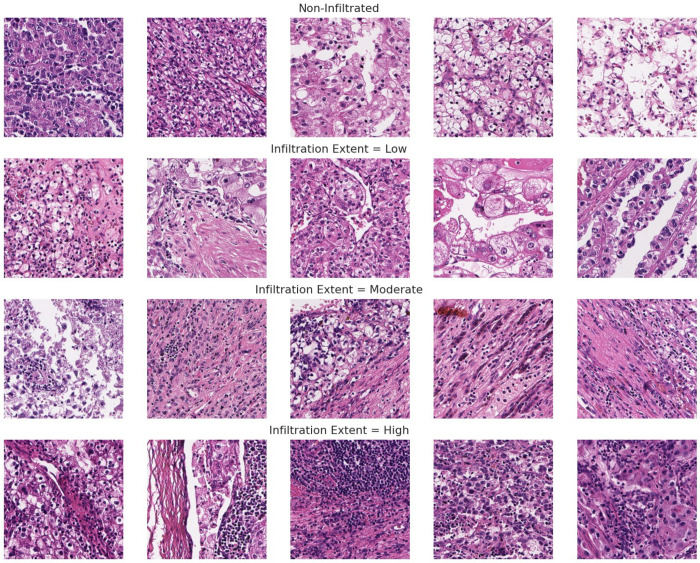
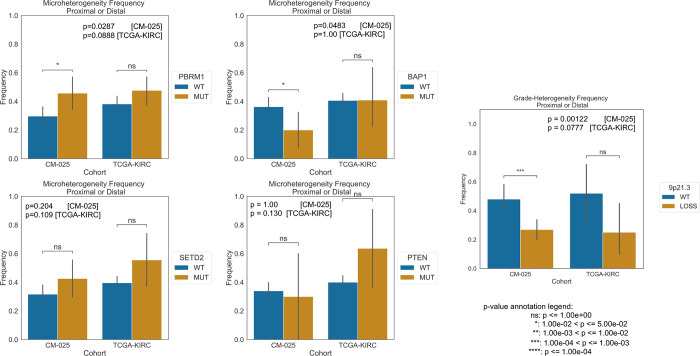
Clear cell renal cell carcinoma (ccRCC) is molecularly heterogeneous, immune infiltrated, and selectively sensitive to immune checkpoint inhibition (ICI). Established histopathology paradigms like nuclear grade have baseline prognostic relevance for ccRCC, although whether existing or novel histologic features encode additional heterogeneous biological and clinical states in ccRCC is uncertain. Here, we developed spatially aware deep learning models of tumor- and immune-related features to learn representations of ccRCC tumors using diagnostic whole-slide images (WSI) in untreated and treated contexts (n = 1102 patients). We discovered patterns of nuclear grade heterogeneity in WSI not achievable through human pathologist analysis, and these graph-based "microheterogeneity" structures associated with PBRM1 loss of function, adverse clinical factors, and selective patient response to ICI. Joint computer vision analysis of tumor phenotypes with inferred tumor infiltrating lymphocyte density identified a further subpopulation of highly infiltrated, microheterogeneous tumors responsive to ICI. In paired multiplex immunofluorescence images of ccRCC, microheterogeneity associated with greater PD1 activation in CD8+ lymphocytes and increased tumor-immune interactions. Thus, our work reveals novel spatially interacting tumor-immune structures underlying ccRCC biology that can also inform selective response to ICI.


Conflict of interest statement

Competing Interests

T.K.C reports institutional and personal, paid and unpaid support for research, advisory boards, consultancy, and honoraria from: AstraZeneca, Aravive, Aveo, Bayer, Bristol Myers-Squibb, Calithera, Circle Pharma, Eisai, EMD Serono, Exelixis, GlaxoSmithKline, IQVA, Infinity, Ipsen, Jansen, Kanaph, Lilly, Merck, Nikang, Nuscan, Novartis, Pfizer, Roche, Sanofi/Aventis, Surface Oncology, Takeda, Tempest, Up-To-Date, CME events (Peerview, OncLive, MJH and others), outside the submitted work; institutional patents filed on molecular mutations and immunotherapy response, and ctDNA; equity in Tempest, Pionyr, Osel, NuscanDx. T.K.C serves on the committees of NCCN, GU Steering Committee, ASCO/ESMO. Medical writing and editorial assistance support may have been funded by Communications companies in part. No speaker’s bureau. Mentored several non-US citizens on research projects with potential funding (in part) from non-US sources/Foreign Components. The institution (Dana-Farber Cancer Institute) may have received additional independent funding of drug companies or/and royalties potentially involved in research around the subject matter. E.M.V.A. reports advisory/consulting with Tango Therapeutics, Genome Medical, Invitae, Monte Rosa, Enara Bio, Manifold Bio, Riva Therapeutics, Serinus Bio, and Janssen; research support from Novartis and BMS; equity in Tango Therapeutics, Genome Medical, Syapse, Manifold Bio, Monte Rosa, Enara Bio, Riva Therapeutics, Serinus Bio; Patents: Institutional patents filed on chromatin mutations and immunotherapy response, and methods for clinical interpretation; intermittent legal consulting on patents for Foaley & Hoag. D.A.B. reports personal fees from LM Education and Exchange, Adnovate Strategies, MDedge, Cancer Network, Cancer Expert Now, OncLive, Catenion, AVEO, and grants and personal fees from Exelixis, outside the submitted work. C.L. reports research funding from Genentech/imCORE. Z.B. reports research funding from Bristol-Myers Squibb & Genentech/imCORE; Honoraria from UpToDate. S.S. reports grants from Exelixis, grants from Bristol-Myers Squibb, personal fees from Merck, grants and personal fees from AstraZeneca, personal fees from CRISPR Therapeutics, personal fees from NCI, and personal fees from AACR; a patent for Biogenex with royalties paid. K.B. has consulted for Related Sciences (RS) outside of the scope of this work. SR receives research funding from Bristol-Myers Squibb and KITE/Gilead, and is a member of the SAB for Immunitas Therapeutics.

Figures

Extended Data Figure 1:
Extended Data Figure 1:. Evaluation of grade neural network model.
A. Receiver operator characteristic curve (ROC) for evaluating performance of a grade classifier on TCGA-KIRC (AUROC: area under ROC curve statistic; TPR: true positive rate; FPR: false positive rate). B Kaplan-Meier curves for overall survival (OS) in TCGA-KIRC based on tercile bins of computationally inferred continuous grade score (left) and assigned pathologist grade (right). C. The average area of predicted tumor nuclei versus grade score (GS), aggregated over distinct tumor regions per WSI. D. Dichotomizing regions based on high grade designation (average score above 0.8).
Extended Data Fig. 2:
Extended Data Fig. 2:. Evaluation of tumor region segmentations by pathologist.
A. Tile-level AUROC for tumor vs non-tumor prediction, averaged over 4-fold cross-validation. (Model 0: Finetuned ResNet-18, Model 1: Finetuned ResNet-50 (Selected for downstream), Model 2: Modified ResNet-50.) B. Number of regions examined per sampled slide. C. Distribution of pathologist assessments by cohort. D. Examples of correct and incorrect tumor-stroma borders.
Extended Data Figure 3:
Extended Data Figure 3:. TIL inference process description.
Top: sequential descriptions of inference process. Bottom: visual example for illustration.
Extended Data Figure 4:
Extended Data Figure 4:. Ground truth/pathologist-labeled examples for TIL infiltration extent used for evaluating tile level TIL thresholds.
Extended Data Fig. 5:
Extended Data Fig. 5:. Lower grade tumor tissue is prone to extreme false positive rates, wherein tumor nuclei are classified as TILs incorrectly.
Extended Data Fig. 6:
Extended Data Fig. 6:. Accuracy in predicting TIL infiltration presence relies on both grade score and infiltration cutoff choice.
A/B. False positive rate (FPR) and accuracy, respectively, versus minimum tissue segment grade score required for TIL evaluation at different cutoffs for calling “infiltrated”. C. Mann-Whitney U test statistic p-values from comparing grade score distributions of correctly versus incorrectly classified tiles (”none” vs “any” TIL presence) at different minimum grade score cutoffs.
Extended Data Fig. 7:
Extended Data Fig. 7:. Comparing H&E derived TIL phenotypes to CD8+ data from the same tumor.
A. Inferred tumor infiltrating lymphocyte density in high grade foci is consistent with CD8+ immunofluorescence data collected for a subset in the same cohort (Braun et al., 2020). B. QQ-plot comparison of CD8+ IF tumor center cell density versus H&E-inferred TIL infiltrated area fraction. C. Area infiltration fraction in CM-025 versus microheterogeneity status (within edges containing a high grade node [score >= 0.8]). Area infiltration fraction: proportion of tiles above the “infiltrated” cutoff (14 TIL/tile).
Extended Data Fig. 8:
Extended Data Fig. 8:. Cohort level distributional differences in grade score.
A. Grade score distributions for each cohort. B. Grade score distributions in each cohort, limited to Stage IV cases.
Extended Data Figure 9:
Extended Data Figure 9:. Distribution of RAG edges across TCGA-KIRC and CM-025.
Histograms of RAG edge counts, split by type.
Extended Data Figure 10:
Extended Data Figure 10:. Distribution of continuous heterogeneity scores across TCGA-KIRC and CM-025.
Violin-Swarm plots for f-weighted heterogeneity scores (f-HS). Left column: combined (summed) proximal and distal counts/scores. Middle: proximal context (”_proximal”). Right: Distal context (“_distal”).
Extended Data Figure 11:
Extended Data Figure 11:. Multiregional microheterogeneity dataset description.
A. schematic of proposed covariation patterns of microheterogeneity score and grade score within the samples collected from a single patient tumor. B. Actual data analyzed.
Extended Data Figure 12:
Extended Data Figure 12:. Aggregate continuous heterogeneity scores.
A. Case-wise frequency of microheterogeneity versus the maximum observed f-weighted or total-weighted heterogeneity score. B. Case-wise block count versus the maximum observed f-weighted or total-weighted heterogeneity score. Statistics aggregated within a given patient’s set of scanned tissue blocks (1 slide per block). Pearson’s Rho p-values calculated via exact distribution. C. Case-wise frequency of microheterogeneity versus the intracase grade score standard deviation or range. D. Casewise block count versus intracase grade score standard deviation or range. Statistics aggregated within a given patient’s set of scanned tissue blocks (1 slide per block). Pearson’s Rho p-values calculated via exact distribution.
Extended Data Figure 13:
Extended Data Figure 13:. Modeling microheterogeneity occurrence.
A. Negative log10 p-values for a likelihood ratio test comparing a null model (beta binomial) to a model that updates its parameters upon observing one “reference” slide from a patient’s collection of samples. X-axis: different selection strategies. Tie-Breaker Margin: margin to allow for considering two or more samples as equally weighted references. GS: Grade Score. B. visualization of expected versus observed data for predicting occurrence of microheterogeneity based on null model or alternative reference model strategy.
Extended Data Figure 14:
Extended Data Figure 14:. Frequency of microheterogeneity within different loss of function states in TCGA-KIRC and CM-025.
Significance calculated with Fisher’s Exact test.
Extended Data Figure 15 :
Extended Data Figure 15 :. Prognostic correlates of microheterogeneity.
Concordance Index (C-Index) for univariate and bivariate models of PFI and OS in TCGA-KIRC. “Grade”: grade type (pathologist vs continuous). “MH” microheterogeneity status (present/absent) as second included covariate. Significance calculated via relative likelihood.
Extended Data Figure 16:
Extended Data Figure 16:. Coefficients for univariate and bivariate Cox proportional hazards models for OS/PFI in TCGA-KIRC.
A: pathologist grade. B: continuous grade. “Base”: single covariate type(s). “MH”: microheterogeneity binary presence. C: pathologist grade. D: continuous grade. P-values calculated via log-rank test.
Extended Data Fig. 17:
Extended Data Fig. 17:. Kaplan-Meier curves for low versus high grade score within each arm of the CM-025 trial.
Top row: progression free survival (PFS). Bottom row: overall survival (OS). Stratification based on the median inferred grade score in the CM-025 cohort. Table: log-rank test p-values for shown curves.
Extended Data Fig. 18:
Extended Data Fig. 18:. Likelihood ratio test evaluation of univariate Cox proportional hazards models using continuous grade score in the ICI arm of CM-025.
Columns: subset of data; rows: survival endpoint modelled.
Extended Data Fig. 19:
Extended Data Fig. 19:. Cox model coefficients for models in the CM-025 cohort, limited to genomic and clinical features (”WES + C”).
LLRT: loglikelihood ratio test. C-Index: concordance index. WES: whole-exome sequencing.
Extended Data Fig. 20:
Extended Data Fig. 20:. Cox model coefficients for models in the CM-025 cohort, limited to H&E/computer vision and clinical features (”H&E + C”).
LLRT: loglikelihood ratio test. C-Index: concordance index. àny_diff_edgè: microheterogeneity categorical variable. GS: continuous grade score.
Extended Data Fig. 21:
Extended Data Fig. 21:. Cox model coefficients for models in the CM-025 cohort, limited to genomic, H&E/computer vision and clinical features (”H&E + WES + C”).
LLRT: loglikelihood ratio test. C-Index: concordance index. àny_diff_edgè: microheterogeneity categorical variable. WES: whole-exome sequencing. GS: continuous grade score.
Extended Data Fig. 22 :
Extended Data Fig. 22 :. Cox model coefficients for models in the CM-025 cohort, using all available covariate types (genomic, H&E/computer vision, clinical, risk).
LLRT: loglikelihood ratio test. C-Index: concordance index. àny_diff_edgè: microheterogeneity categorical variable. GS: continuous grade score. MSKCC: MSKCC risk group (categorical).ǹ_prior_therapy`: number of lines of therapies administered prior to the trial.
Extended Data Fig. 23
Extended Data Fig. 23. Cox model coefficients for models in the CM-025 cohort, limited to genomic and clinical features, restricted to subset where TIL are evaluable (”WES + C”).
LLRT: loglikelihood ratio test. C-Index: concordance index. àny_diff_edgè: microheterogeneity categorical variable.
Extended Data Fig. 24:
Extended Data Fig. 24:. Cox model coefficients for models in the CM-025 cohort, limited to H&E/computer vision [TIL included] and clinical features (”H&E + C”).
LLRT: loglikelihood ratio test. C-Index: concordance index. àny_hg_diff_edgè: microheterogeneity categorical variable (high-grade node involved in RAG edge required). GS: continuous grade score. Global: area infiltration fraction across evaluated tumor area (fraction tiles above minimum TIL count).
Extended Data Fig. 25:
Extended Data Fig. 25:. Cox model coefficients for models in the CM-025 cohort, limited to genomic, H&E/computer vision [TIL included] and clinical features (”H&E + WES + C”).
LLRT: loglikelihood ratio test. C-Index: concordance index. àny_hg_diff_edgè: microheterogeneity categorical variable (high-grade node involved in RAG edge required). GS: continuous grade score. Global: area infiltration fraction across evaluated tumor area (fraction tiles above minimum TIL count).
Extended Data Fig. 26:
Extended Data Fig. 26:. Cox model coefficients for models in the CM-025 cohort, using all available covariate types (genomic, H&E/computer vision [TIL included], clinical, risk).
LLRT: loglikelihood ratio test. C-Index: concordance index. àny_hg_diff_edgè: microheterogeneity categorical variable (highgrade node involved in RAG edge required). GS: continuous grade score. Global: area infiltration fraction across evaluated tumor area (fraction tiles above minimum TIL count). MSKCC: MSKCC risk group (categorical). ǹ_prior_therapy`: number of lines of therapies administered prior to the trial.
Extended Data Figure 27:
Extended Data Figure 27:. Comparison of different immune-context specifications when fitting Cox proportional hazards models for overall survival in CM-025, ICI arm.
A. Concordance Index. B. Relative Likelihood. Colors indicate the form of infiltration covariate used. HG Edge: edge involving a high-grade node (average score above 0.8). Global: Using all evaluable tumor area for infiltration fraction description. Disconnected: Using nodes that are disconnected from RAG. Proximal or Distal: infiltration specific to a proximal or distal edge, respectively. G: Grade Score E: Heterogeneity/RAG Edge Variable I: Infiltration Variable C: Clinical Base Info (Sex, Age) R: Clinical Risk/Performance Info (MSKCC Risk group, Num. prior lines Tx before trial) (E:I is shorthand for [E + E*I], where E:I is an interaction term between variables E and I)
Extended Data Fig. 28:
Extended Data Fig. 28:. Comparison of Cox model LLRT p-values under different PBRM1 states in the ICI arm of CM-025.
LOF: loss of function (truncating mutation present).
Extended Data Figure 29:
Extended Data Figure 29:. mIF data and cell graphs for immune hotspots: examples from two microhomogeneous cases.
Edges are drawn between CD8+ and tumor cells that are adjacent in a nearest neighbor graph.
Extended Data Figure 30:
Extended Data Figure 30:. mIF data and cell graphs for immune hotspots: examples from two microheterogeneous cases.
Edges are drawn between CD8+ and tumor cells that are adjacent in a nearest neighbor graph.
Extended Data Fig. 31:
Extended Data Fig. 31:. Cell densities by type and microheterogeneity status in immune hotspots.
Y-axis: log10 density (cells per 2000px window; approx. 1mm) Rows: different data removal strategies. Significance calculated by Wilcoxon rank sum test (MWW).
Extended Data Fig. 32:
Extended Data Fig. 32:. Cell densities by type, context, and microheterogeneity status in immune hotspots.
Y-axis: log10 density (cells per 2000px window; approx. 1mm) Rows: different data removal strategies. Significance calculated by Wilcoxon rank sum test (MWW). “TI”: tumor-immune interacting cell context. “Self”: self-interacting cell context.
Extended Data Fig. 33:
Extended Data Fig. 33:. Cell densities by cell subtype and microheterogeneity status in immune hotspots.
Y-axis: log10 density (cells per 2000px window; approx. 1mm) Rows: different data removal strategies. Significance calculated by Wilcoxon rank sum test (MWW).
Figure 1:
Figure 1:. A spatially aware deep learning framework for studying ccRCC.
A. Our approach builds a series of biologically relevant prediction models to provide both high resolution and readily human-understandable representations of ccRCC slide images. The first two models identify tumor tissue and grade phenotype within predicted tumor regions, each using a finetuned ResNet-50 convolutional neural network (CNN). A third model identifies tumor infiltrating lymphocytes (TILs) using a finetuned HoVerNet CNN. Local predictions are grouped via watershed segmentation and assembled into graph representations for slide-level description of patients. Computationally inferred patient representations capture both clinically relevant, and biologically informative characteristics of ccRCC. B. Comparison of assigned pathologist grade and grade score on held-out cohorts (TCGA-KIRC, CM-025) in-house training set used for tumor and grade classifier development (DFCI-PROFILE). C. Kaplan-Meier curves for progression free interval (PFI) in TCGA-KIRC based on tercile bins of computationally inferred continuous grade score (left) and assigned pathologist grade (right).
Figure 2:
Figure 2:. Computationally inferred phenotypic variation in ccRCC.
A. Representative example of proximally occurring grade microheterogeneity (dashed line indicating interface of region contact). B. Representative example of distally occurring grade microheterogeneity. C-E: Summary statistics surrounding microheterogeneity in the TCGA-KIRC and CM-025 cohorts. C: Number of patients with/without microheterogeneity. D. Frequency of microheterogeneity by assigned pathologist grade (where available). E. Distribution of continuous heterogeneity score (f-weighted) in nonhomogeneous cases, which describes the extent of microheterogeneity in a given slide.
Figure 3:
Figure 3:. Linkage between microheterogeneiety and whole-tumor variation.
A. Schematic for creating a multiregional weighted microheterogeneity analysis using computer vision models. B. Example data collections from four patients, showing RAG plots for the scanned slide of each tissue block. C. Case-wise frequency of microheterogeneity versus the maximum observed f-weighted heterogeneity score, which describes the largest extent of heterogeneity observed in a patient. Statistics aggregated within a given patient’s set of scanned tissue blocks (1 slide per block). D. Case-wise frequency of microheterogeneity versus standard deviation of grade score predictions within the same case. Statistics aggregated within a given patient’s set of scanned tissue blocks (1 slide per block). Pearson’s Rho p-values calculated via exact distribution.
Figure 4:
Figure 4:. Inferred patterns of grade microheterogeneity associate with improved survival in the CheckMate-025 (CM-025) cohort, but only for immune checkpoint inhibitor (ICI) treated patients.
A. Kaplan-Meier curves for overall survival (OS) and progression free survival (PFS) in the CM-025 cohort based on the presence of microheterogeneity. Significance values were calculated via log-rank test. B. Kaplan-Meier curves for overall survival (OS) and progression free survival (PFS) in the CM-025 cohort based on the presence of microheterogeneity, stratifying further based on relative grade score within a grade microheterogeneity category. Significance values were calculated via (pairwise) log-rank test.
Figure 5:
Figure 5:. Combining computationally inferred tumor and immune states identifies a further subset of responders to immune checkpoint inhibition (ICI) in the CheckMate-025 trial.
A. Representative examples of four classes of patients identified using computational inference, based on the presence of grade microheterogeneity, and the relative abundance of tumor infiltrating lymphocytes in high-grade tumor regions (TIL Density). Top row: representative RAG plots based on grade score (Blue: lower score, Red: higher score). Bottom row: Representative inferred TIL densities (blue: lower infiltration, red: Higher infiltration; uncolored: lower grade regions not considered for TIL density evaluation). B-C: Kaplan-Meier curves for progression free survival (PFS) and overall survival (OS) in both arms of the CM-025 trial based on the groups demonstrated in (a). Significance values were calculated via log-rank test between “Microheterogeneous and High Infiltration” patients and all remaining patients within a trial arm.
Figure 6:
Figure 6:. Exploration of microheterogeneity implications in paired multiplexed imaging data.
A,B. Representative example of a Microhomogeneous case (A), and Microheterogeneous case (B). H&E Rag: slide-level representation of H&E-inferred tumor and grade properties. mIF Local Motifs: indicates the primary cell type and context present within overlapping 200 pixel windows. mIF Immune Hotspot: representative example of an area of high tumor-immune interaction density. Cell Graph: visualization of tumor and CD8+ cells, and their interaction context; edges are drawn between interacting tumor and CD8+ cells (nearest neighbors in a Delaunay triangulation). C. Comparison of the frequency of tumor-immune interaction within CD8+ cells (left) and tumor cells (right) versus H&E-inferred microheterogeneity status.(TI: “tumor-immune” interaction context). D. Comparison of the frequency of PD1-High within CD8+ cells that interact with tumor cells versus H&E-inferred microheterogeneity status. Significance calculated via Wilcoxon rank sum test.

References

    1. Hsieh J. J. et al. Renal cell carcinoma. Nat Rev Dis Primers 3, 17009 (2017). - PMC - PubMed
    1. Gerlinger M. et al. Intratumor heterogeneity and branched evolution revealed by multiregion sequencing. N. Engl. J. Med. 366, 883–892 (2012). - PMC - PubMed
    1. Turajlic S. et al. Tracking Cancer Evolution Reveals Constrained Routes to Metastases: TRACERx Renal. Cell 173, 581–594.e12 (2018). - PMC - PubMed
    1. Mitchell T. J. et al. Timing the Landmark Events in the Evolution of Clear Cell Renal Cell Cancer: TRACERx Renal. Cell 173, 611–623.e17 (2018). - PMC - PubMed
    1. Turajlic S. et al. Deterministic Evolutionary Trajectories Influence Primary Tumor Growth: TRACERx Renal. Cell 173, 595–610.e11 (2018). - PMC - PubMed

Publication types