[Preprint]. 2023 Jan 15:2023.01.13.523300.
doi: 10.1101/2023.01.13.523300.

Analysis of donor pancreata defines the transcriptomic signature and microenvironment of early pre-neoplastic pancreatic lesions

Affiliations

Analysis of donor pancreata defines the transcriptomic signature and microenvironment of early pre-neoplastic pancreatic lesions

Eileen S Carpenter et al. bioRxiv. .

Update in

  • Analysis of Donor Pancreata Defines the Transcriptomic Signature and Microenvironment of Early Neoplastic Lesions.
    Carpenter ES, Elhossiny AM, Kadiyala P, Li J, McGue J, Griffith BD, Zhang Y, Edwards J, Nelson S, Lima F, Donahue KL, Du W, Bischoff AC, Alomari D, Watkoske HR, Mattea M, The S, Espinoza CE, Barrett M, Sonnenday CJ, Olden N, Chen CT, Peterson N, Gunchick V, Sahai V, Rao A, Bednar F, Shi J, Frankel TL, Pasca di Magliano M. Carpenter ES, et al. Cancer Discov. 2023 Jun 2;13(6):1324-1345. doi: 10.1158/2159-8290.CD-23-0013. Cancer Discov. 2023. PMID: 37021392 Free PMC article.

Abstract

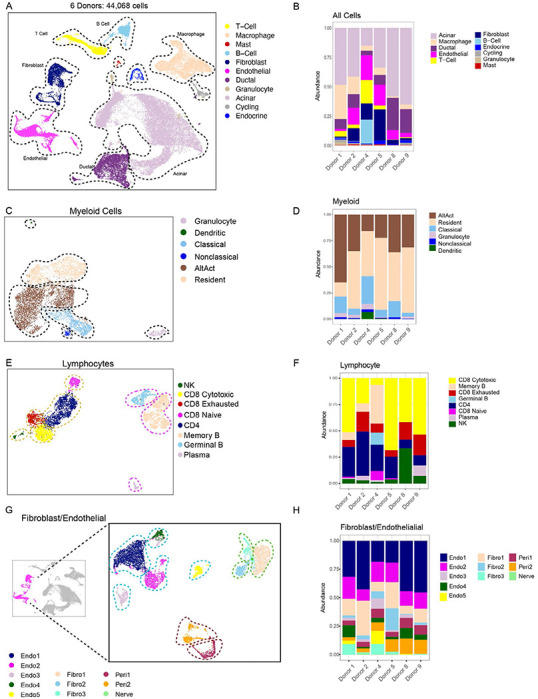
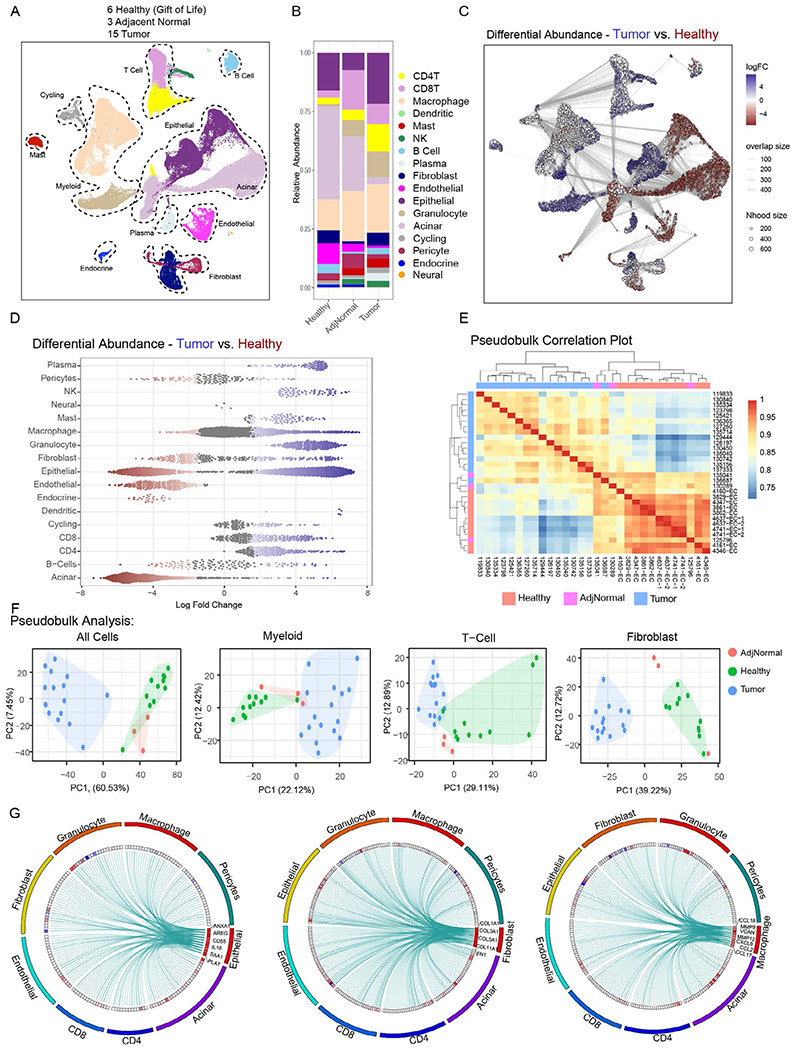
The adult healthy human pancreas has been poorly studied given lack of indication to obtain tissue from the pancreas in the absence of disease and rapid postmortem degradation. We obtained pancreata from brain dead donors thus avoiding any warm ischemia time. The 30 donors were diverse in age and race and had no known pancreas disease. Histopathological analysis of the samples revealed PanIN lesions in most individuals irrespective of age. Using a combination of multiplex immunohistochemistry, single cell RNA sequencing, and spatial transcriptomics, we provide the first ever characterization of the unique microenvironment of the adult human pancreas and of sporadic PanIN lesions. We compared healthy pancreata to pancreatic cancer and peritumoral tissue and observed distinct transcriptomic signatures in fibroblasts, and, to a lesser extent, macrophages. PanIN epithelial cells from healthy pancreata were remarkably transcriptionally similar to cancer cells, suggesting that neoplastic pathways are initiated early in tumorigenesis.

Statement of significance: The causes underlying the onset of pancreatic cancer remain largely unknown, hampering early detection and prevention strategies. Here, we show that PanIN are abundant in healthy individuals and present at a much higher rate than the incidence of pancreatic cancer, setting the stage for efforts to elucidate the microenvironmental and cell intrinsic factors that restrain, or, conversely, promote, malignant progression.


Conflict of interest statement

Conflict of interest disclosure statement

The authors declare no competing interests for this manuscript.

Figures

Fig 1.
Fig 1.. The adult human pancreas harbors frequent PanIN lesions.
A) Schematic of workflow to recover and process Gift of Life donor pancreas organs. B) (Left) Population distribution barplot of donor cohort. Tan bars represent donors that were found to have PanIN lesions on histological examination. Blue bars represent donors in whom no neoplastic lesions were found. (Middle) Pie chart of donor cohort by sex. (Right) Pie chart of donor cohort by race. C) H&E of representative PanIN lesions found in donor pancreata. Each H&E section represents a different donor.
Fig 2.
Fig 2.. PanIN lesions in healthy pancreata is surrounded by a unique microenvironment.
A) mfIHC composite images of formalin-fixed, paraffin-embedded donor tissue specimens, highlighting acinar, normal duct, ADM (acinar-to-ductal), and PanIN structures. Antibodies and colors of immune panel used in the legend below. B) mfIHC composite images of formalin-fixed, paraffin-embedded donor tissue specimens, highlighting acinar, normal duct, ADM (acinar-to-ductal), and PanIN structures. Antibodies and colors of fibroblast panel used in the legend below. C) Quantification of percent positive CD3+ cells (top) and CD163+ cells (bottom) surrounding Acinar, ADM, Duct, and PanIN populations, respectively. Asterisks denote a P value of <0.05, as determined by ANOVA. D) Quantification of percent positive FAP+ cells (top left) and FDGFR+ cells (bottom left), SMA+ cells (top right), and Vimentin+ cells (bottom right) surrounding Acinar, ADM, Duct, and PanIN populations, respectively. Asterisks denote a P value of <0.05, as determined by ANOVA.
Fig 3.
Fig 3.. Healthy pancreata contain several non-epithelial populations, including myeloid, lymphocyte, fibroblast, and endothelial cells
A) UMAP of all cells captured from single cell RNA sequencing of six donor pancreata. Populations are identified by color. B) Histogram of cell type abundance of all captured cells by donor. C) UMAP of extracted myeloid cells from donor pancreata. Populations are identified by color. AltAct = Alternatively Activated Macrophages. D) Histogram of cell type abundance of specific myeloid cell populations by donor. E) UMAP of extracted lymphocytes from donor pancreata. Populations are identified by color. F) Histogram of cell type abundance of specific lymphocyte populations by donor. G) UMAP of extracted fibroblast, pericyte, and endothelial populations from donor pancreata. Populations are identified by color. H) Histogram of cell type abundance of specific fibroblast, pericyte, and endothelial populations by donor.
Fig 4.
Fig 4.. Comparison of the microenvironment in healthy pancreata and pancreatic tumors reveals distinct stromal features.
A) UMAP of all cells captured from single cell RNA sequencing of six donor pancreata merged with 15 PDAC samples and 3 adjacent normal samples. Populations are identified by color. B) Histogram of cell type abundance of all cell populations by disease state (healthy, adjacent normal, and tumor). C) Neighborhood graph differential abundance plot of merged tumor, healthy, and adjacent normal samples. Size of dots represent neighborhoods, while edges represent depict the number of cells shared between neighborhoods. Neighborhoods colored in red represent significantly increased abundance in healthy samples while neighborhoods colored in blue represent significantly increased abudance in tumor samples. D) Beeswarm plot of differential abundance by cell type. X-axis represents log-fold change in abundance between tumor and healthy states. Each dot is a neighborhood; neighborhoods colored in red represent significnatly increased abundance in healthy samples while neighborhoods colored in blue represent signficantly increased abudance in tumor samples. E) Correlation heatmap of pseudobulk-aggregrated counts of 15 tumor samples, 3 adjacent normal samples and 11 donor samples (given that single cell sequencing was performed on the head and tail sections separately of 5 out of 6 donors). Each row/line represents one aggregated single cell sequencing sample. F) PCA plots of pseudobulk-aggregated counts from all cells, myeloid cells, t-cells, and fibroblasts. Each dot represents one aggregated single cell sequencing sample. G) Circos plots of putative ligand–receptor interactions that are upregulated in PDAC epithelial (left), fibroblast (middle), and macrophage (right) cells compared with healthy cells. The heatmap within the circos plots is the scaled average expression of each gene within PDAC tissue cell populations. The interactions plotted are those in which the expression level of the ligand is increased in PDAC samples compared with healthy tissues.
Fig 5.
Fig 5.. Myeloid and fibroblast populations from tumor-bearing pancreata display distinct transcriptomic signatures compared to their non-tumor counterparts.
A) (left) UMAP of extracted myeloid cells from single cell dataset of healthy, adjacent normal, and tumor samples. Populations are identified by color. AltAct = Alternatively Activated Macrophages. pDC = Plasmacytoid Dendritic Cells. cDC = Conventional Dendritic Cells. (right) UMAP overlay of disease states on extracted myeloid cells from single cell dataset of healthy, adjacent normal, and tumor samples. B) PCA plots of pseudobulk-aggregated counts from specific myeloid cell populations Each dot represents one aggregated single cell sequencing sample. C) Top differentially expressed genes between alternatively activated macrophages (left) and resident macrophages (right) from healthy (blue) and tumor (orange) samples. D) Violin plots of normalized expression of select tumor-associated macrophage markers comparing healthy to tumor samples. E) (left) UMAP of extracted fibroblast and pericyte cells from single cell dataset of healthy, adjacent normal, and tumor samples. Populations are identified by color. (right) UMAP overlay of disease states on extracted fibroblast/pericyte cells from single cell dataset of healthy, adjacent normal, and tumor samples. F) Violin plots of normalized expression of select fibroblast markers mapped across fibroblast and pericyte populations. G) PCA plots of pseudobulk-aggregated counts from fibroblast (top) and pericyte (bottom) populations Each dot represents one aggregated single cell sequencing sample. H) Top differentially expressed genes between fibroblasts from healthy (blue) and tumor (orange) samples. D) Violin plots of normalized expression of select fibroblast markers comparing healthy to tumor samples.
Fig 6
Fig 6. Spatial transcriptomics reveals a unique epithelial gene signature of PanIN lesions which aligns closely with tumor epithelium.
A) (Left) GeoMX tissue section from donor pancreas, stained for panCK and CD45. panCK+ segments were pseudo-colored in green, while panCKCD45segments were pseudo-colored in red. (Right) GeoMX tissue section from surgically resected treatmentnaïve PDAC, stained for panCK and CD45. panCK+ segments were pseudo-colored in purple. B) Sankey plot showing distribution of ROIs amount donor or PDAC samples. C) Heatmap of cell-type specific markers derived from differential gene expression using the linear mixed model on spatial transcriptomic ROIs. D) UMAP overlay of disease states on extracted epithelial cells from single cell dataset of healthy, adjacent normal, and tumor samples. E) AUCell geneset scoring mapped to epithelial single cell dataset of healthy, adjacent normal, and tumor samples using signatures derived from Acinar, Normal Duct, PanIN, and ADM (acinar to ductal metaplasia) spatial transcriptomic ROIs. Top row represents spatial transcriptomic signatures obtained from healthy tissue; bottom row represents spatial transcriptomic signatures obtained from tumor tissue. F) AUCell geneset scoring mapped to epithelial single cell dataset of healthy, adjacent normal, and tumor samples using signatures derived from glandular tumor and poorly differentiated tumor ROIs.
Fig 7)
Fig 7). Claudin 18, MUC5AC/B, and AQP1/3 distinguish normal Ducts, ADM, and PanIN in healthy pancreas.
A) Donor tissue stained with antibodies against Muc5B (green) and E-Cad (red), along with DAPI. B) Donor tissue stained with antibodies against Muc5AC (green) and E-Cad (red), along with DAPI. C) Donor tissue stained with antibodies against p-ERK (green), Claudin18 (orange), and E-Cad (red), along with DAPI. D) Donor tissue stained with antibodies against Claudin18 (green) and E-Cad (red), along with DAPI. E) Donor tissue stained with antibodies against Aqp3 (green) and E-Cad (red), along with DAPI. F) Donor tissue stained with antibodies against Aqp1 (green) and E-Cad (red), along with DAPI. G-H) Donor tissue stained with RNAScope probe for TFF1 (red) and antibody against Claudin18 (green), along with DAPI.

References

    1. Walker AE. The Adult Pancreas in Trauma and Disease. Acad Forensic Pathol 2018;8(2):192–218 doi 10.1177/1925362118781612. - DOI - PMC - PubMed
    1. Morioka F, Tani N, Ikeda T, Hirokawa T, Ikeda K, Shida A, et al. Morphological and biochemical changes in the pancreas associated with acute systemic hypoxia. Hum Cell 2021;34(2):400–18 doi 10.1007/s13577-020-00481-0. - DOI - PMC - PubMed
    1. Cocariu EA, Mageriu V, Staniceanu F, Bastian A, Socoliuc C, Zurac S. Correlations Between the Autolytic Changes and Postmortem Interval in Refrigerated Cadavers. Rom J Intern Med 2016;54(2):105–12 doi 10.1515/rjim-2016-0012. - DOI - PubMed
    1. Shimizu M, Hayashi T, Saitoh Y, Ohta K, Itoh H. Postmortem autolysis in the pancreas: multivariate statistical study. The influence of clinicopathological conditions. Pancreas 1990;5(1):91–4 doi 10.1097/00006676-199001000-00013. - DOI - PubMed
    1. Grant TJ, Hua K, Singh A. Molecular Pathogenesis of Pancreatic Cancer. Prog Mol Biol Transl Sci 2016;144:241–75 doi 10.1016/bs.pmbts.2016.09.008. - DOI - PMC - PubMed

Publication types