[Preprint]. 2023 Jan 18:2023.01.16.524266.
doi: 10.1101/2023.01.16.524266.

Ontogenesis of the molecular response to sleep loss

Affiliations

Ontogenesis of the molecular response to sleep loss

Christine M Muheim et al. bioRxiv. .

Update in

  • Ontogenesis of the molecular response to sleep loss.
    Muheim CM, Ford K, Medina E, Singletary K, Peixoto L, Frank MG. Muheim CM, et al. Neurobiol Sleep Circadian Rhythms. 2023 Mar 16;14:100092. doi: 10.1016/j.nbscr.2023.100092. eCollection 2023 May. Neurobiol Sleep Circadian Rhythms. 2023. PMID: 37020466 Free PMC article.

Abstract

Sleep deprivation (SD) results in profound cellular and molecular changes in the adult mammalian brain. Some of these changes may result in, or aggravate, brain disease. However, little is known about how SD impacts gene expression in developing animals. We examined the transcriptional response in the prefrontal cortex (PFC) to SD across postnatal development in male mice. We used RNA sequencing to identify functional gene categories that were specifically impacted by SD. We find that SD has dramatically different effects on PFC genes depending on developmental age. Gene expression differences after SD fall into 3 categories: present at all ages (conserved), present when mature sleep homeostasis is first emerging, and those unique to certain ages in adults. Developmentally conserved gene expression was limited to a few functional categories, including Wnt-signaling which suggests that this pathway is a core mechanism regulated by sleep. In younger ages, genes primarily related to growth and development are affected while changes in genes related to metabolism are specific to the effect of SD in adults.


Figures
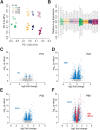
Figure 1
Figure 1
The number of cortical genes influenced by SD increases with age. A) Principal component analysis of RUVs normalized sequencing reads showed an increased effect of sleep-deprivation with increased age. Developmental age contributed the most variability (PC1, 20.41%) while SD contributed only 9.43% (PC2) to the overall variability in the dataset. n=5-8 per age group and condition, k=3, open circles: home cage, closed circles: SD. B) Relative Log expression for each sample and condition using k=3 factors for RUVs. Color code as in A. C-F) Volcano plots of normalized dataset per age group, C) P16 D) P24 E) P30 F) P90. Each gray dot represents an expressed gene, blue dots are differentially expressed genes after SD with the absolute gene number in blue for each volcano plot on the left. For the P90 group, red dots represent control genes with known response to SD (supplementary Table 1). 84.4%of these genes were found as differentially expressed after SD with the chosen RUVs normalization, k=3, FDR <0.05.
Figure 2
Figure 2
Venn diagram of A) up and B) down regulated genes after SD in each age group with an FDR of <0.05. Selected genes in the boxes are given as examples for each category analyzed further. Outlined in dark green, yellow, lime green or purple are the subsets of genes further analyzed. Dark green: genes changed after SD in all ages, yellow: genes changed only in P24, P30, and P90, lime green: genes changed exclusively in P24, purple: genes changed exclusively in P90.
Figure 3
Figure 3
Genes affected by SD at all ages target transcription. A) Bubbles show functional enrichment analysis of up (red) and down (blue) regulated genes. Bubble size represents number of genes per functional category. Modified Fisher’s exact p-value<0.05, minimum of 3 genes for corresponding functions or pathways. P-values are represented as a color gradient. Gray box indicates functions within a cluster with an enrichment score of 1.65 based on a similarity threshold 0.2 and Modified Fisher’s exact p-Value<0.05). No significant cluster was detected for the upregulated genes. MF, Uniprot keywords Molecular Function. BP, Uniprot keywords Biological Process. PW, KEGG pathways. B) Heatmap of log2 fold change across age of genes enriched in functional categories with >4 fold enrichment from A (MicroRNAs in Cancer, Wnt-signaling Pathways, Pathways in Cancer). Red colors indicate increase in expression compared to home cage control, blue colors indicate decrease. Dendrogram on the left represents gene clusters based on Euclidean distance and Ward 2D agglomeration of log2 fold changes.
Figure 4
Figure 4
Genes affected by SD in P24 and older animals mainly affect protein regulation and circadian rhythms. A) Bubbles show functional enriched terms of up (red) and down (blue) regulated genes. Bubble size represents number of genes per term. Modified Fisher’s exact p-value<0.05, minimum of 3 genes for corresponding functions or pathways. P-values are represented as a color gradient. Gray boxes outline functions for each cluster based on a similarity threshold of 0.2 and a Modified Fisher’s exact p-value<0.05. Enrichment scores for each cluster; cluster-1: 4.72, cluster-2: 1.93, cluster-3: 2.17. MF, Uniprot keywords Molecular Function. BP, Uniprot keywords Biological Process. PW, KEGG pathways. B) Heatmap of log2 fold change across age of genes enriched in terms with >4 fold enrichment from A (Stress Response, Circadian Rhythm, Apoptosis - multiple species, Glycosaminoglycan degradation, Carboxypeptidase). Red colors indicate increase in expression compared to home cage control, blue colors indicate a decrease. Dendrogram on the left represents gene clusters based on Euclidean distance and Ward 2D agglomeration of log2 fold changes.
Figure 5
Figure 5
Functional enrichment analysis for differentially expressed genes after SD exclusively in P24 mice are related to development and neuronal activity. Bubble size represents number of genes per function, for up (red) and down (blue) regulated genes, Modified Fisher’s exact p-value<0.05, minimum of 3 genes for corresponding functions or pathways. P-values are represented as a color gradient. Gray box outlines enriched functions per cluster based on a similarity threshold of 0.2 and a Modified Fisher’s exact p-value<0.05, enrichment score 2.31. MF, Uniprot keywords Molecular Function. BP, Uniprot keywords Biological Process. PW, KEGG pathways.
Figure 6
Figure 6
Genes related to in Wnt-signaling pathways are downregulated after SD at all ages but more extensively after SD in P24. Wnt-signaling pathways adapted from KEGG (mmu04310) and WikiPathways. Genes in blue are downregulated after SD in all ages. Genes colored in lime green are downregulated after SD only in P24.
Figure 7
Figure 7
Differentially expressed genes after SD only in P90 mice are mostly related to cell adhesion and polarity and glucose and lipid metabolism. Bubbles show enriched functions of up (red) and down (blue) regulated genes. Bubble size represents number of genes per function. Modified Fisher’s exact p-value <0.05, minimum of 3 genes for each function or pathway. P-values are represented as a color gradient. Gray boxes outline function within each cluster with a similarity threshold 0.2 and Modified Fisher’s exact p-value<0.05. Enrichment scores for each cluster; cluster-1: 2.12, cluster-2: 2.57, cluster-3: 2.09, cluster-4: 2.09, cluster-5: 2.04, cluster-6: 1.75. MF, Uniprot keywords Molecular Function. BP, Uniprot keywords Biological Process. PW, KEGG pathways.

Similar articles

References

    1. Aboufares El Alaoui A., Buhl E., Galizia S., Hodge J.J.L., de Vivo L., Bellesi M., 2023. Increased interaction between endoplasmic reticulum and mitochondria following sleep deprivation. BMC Biology 21, 1. 10.1186/s12915-022-01498-7 - DOI - PMC - PubMed
    1. Achermann P., Borbély A.A., 2003. Mathematical models of sleep regulation. Front Biosci 8, s683–693. 10.2741/1064 - DOI - PubMed
    1. Achermann P., Borbély A.A., 1995. Concepts and models of sleep regulation. Wien Med Wochenschr 145, 402–406. - PubMed
    1. Achermann P., Borbély A.A., 1992. Combining different models of sleep regulation. Journal of Sleep Research 1, 144–147. 10.1111/j.1365-2869.1992.tb00028.x - DOI - PubMed
    1. Alfoldi P., Tobler I., Borbely A.A., 1990. Sleep regulation in rats during early development. American Journal of Physiology-Regulatory, Integrative and Comparative Physiology 258, R634–R644. 10.1152/ajpregu.1990.258.3.R634 - DOI - PubMed

Publication types