[Preprint]. 2023 Jan 4:2023.01.04.522767.
doi: 10.1101/2023.01.04.522767.

High Throughput Viability Assay for Microbiology

Affiliations

High Throughput Viability Assay for Microbiology

Christian T Meyer et al. bioRxiv. .

Update in

Abstract

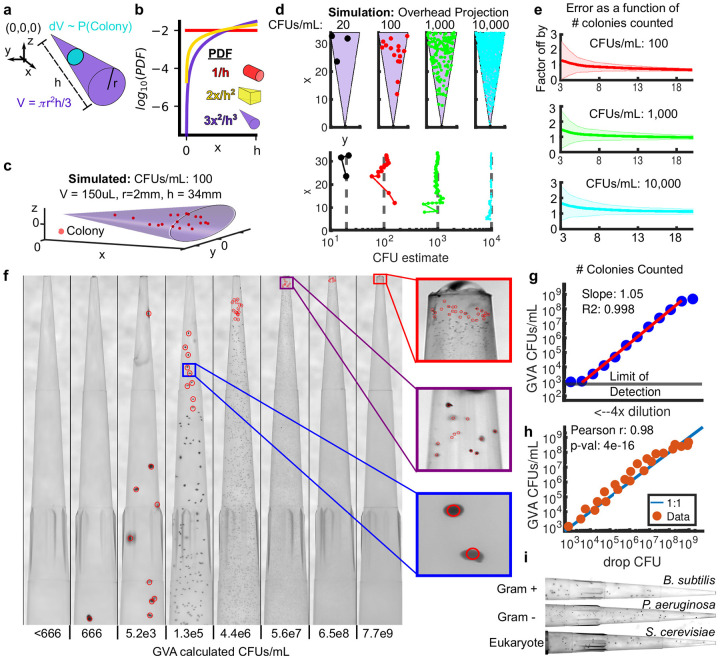
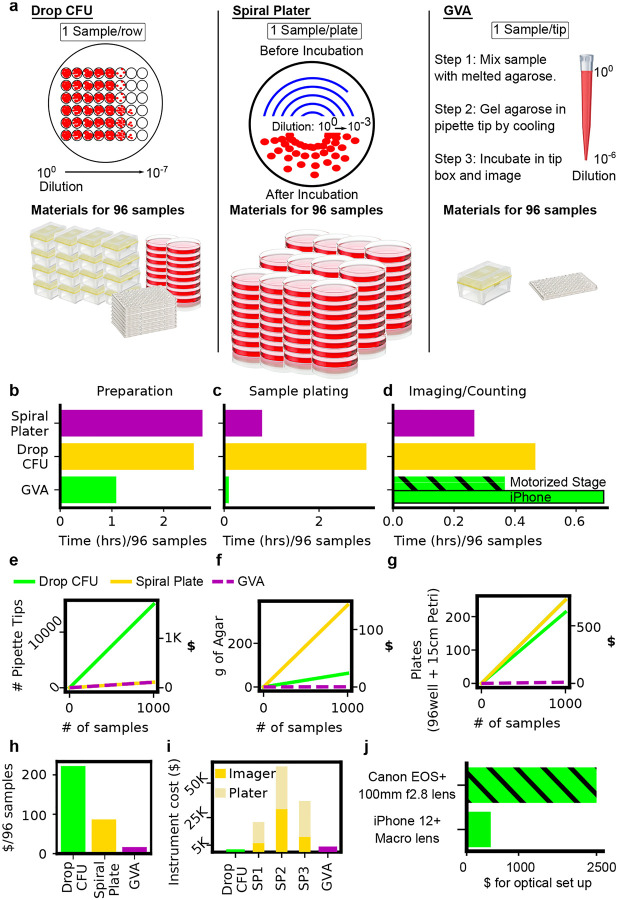
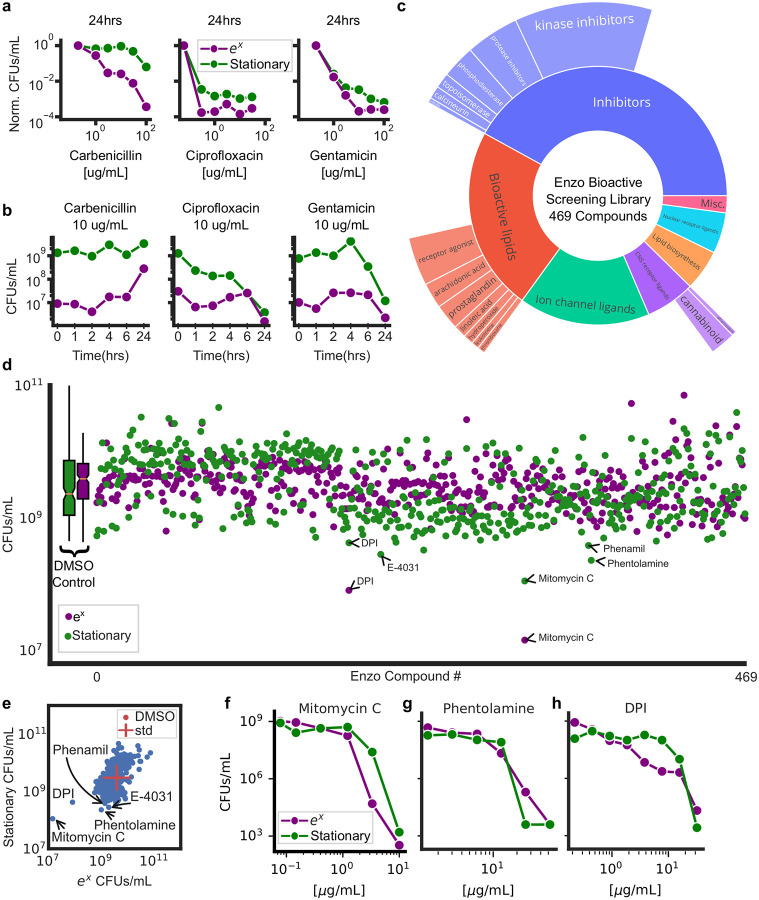
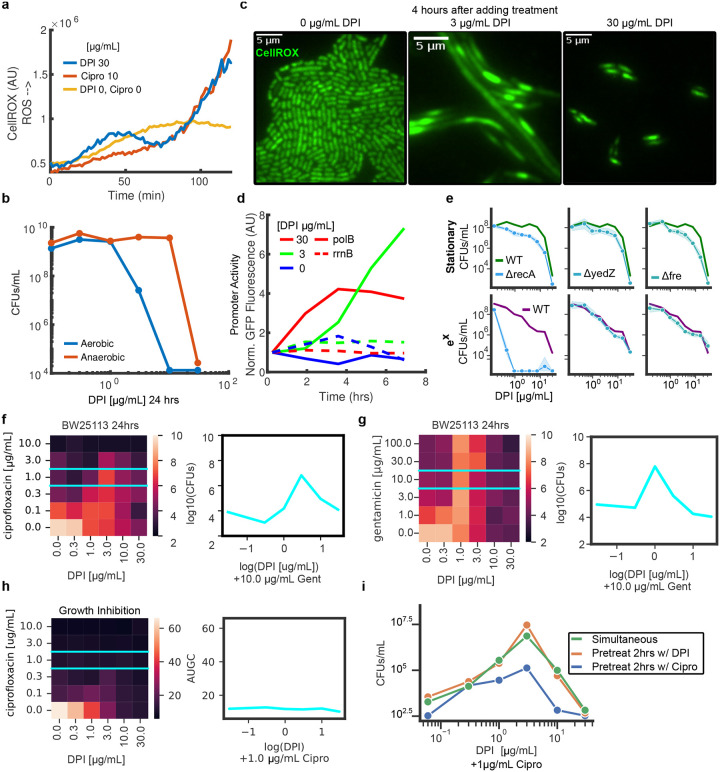
Counting viable cells is a universal practice in microbiology. The colony forming unit (CFU) assay has remained the gold standard to measure viability across disciplines; however, it is time-intensive and resource-consuming. Herein, we describe the Geometric Viability Assay (GVA) that replicates CFU measurements over 6-orders of magnitude while reducing over 10-fold the time and consumables. GVA computes a sample's viable cell count based on the distribution of embedded colonies growing inside a pipette tip. GVA is compatible with gram-positive and -negative planktonic bacteria, biofilms, and yeast. Laborious CFU experiments such as checkerboard assays, treatment time-courses, and drug screens against slow-growing cells are simplified by GVA. We therefore screened a drug library against exponential and stationary phase E. coli leading to the discovery of the ROS-mediated, bactericidal mechanism of diphenyliodonium. The ease and low cost of GVA evinces it can accelerate existing viability assays and enable measurements at previously impractical scales.


Conflict of interest statement

Declaration of Interests CTM and JMK have filed a provisional patent for the Geometric Viability Assay. CTM is a co-founder of Duet BioSystems. The funders had no role in the design of the study; in the collection, analyses, or interpretation of data; in the writing of the manuscript, or in the decision to publish the results.

Figures

Figure 1:
Figure 1:. The Geometric Viability Assay (GVA).
a) The probability of a colony forming at a distance x from the tip of the cone is proportional to the infinitesimal volume dV (cyan circle) divided by the total volume V (purple cone). Analytically, this ratio is the Probability Density Function (PDF) as a function of x (see Supplemental Materials for derivation). b) The PDF for a cylinder (red), wedge (yellow), and cone (purple) as a function of the axial distance (x). c) Simulation of the colony distribution in a cone. d) Estimating the total CFUs/mL based on the position of colonies in the cone. (top) Shown are the distributions of colonies for 4 simulations spanning 20 to 10,000 CFUs/mL density. The volume of each cone is the same as in panel c. (bottom) GVA estimate of the CFUs/mL as a function of the included colonies and their x positions. e) The factor the GVA calculation differs from the correct value as a function of the number of colonies in equation (1). Shaded errorbars represent 1 standard deviation in 1000 simulations. Colors match simulations in panel d. f) Dilution series of E. coli embedded in 150 μL 0.5% LB-agarose in p200 pipette tips. Red circles correspond to colonies counted using a custom semi-automated segmentation software. g) E. coli CFUs/mL calculated using GVA for a 4x dilution series. Points are the mean of 4 replicates. Mean calculated after taking the log. Red line is the linear regression fit to dilution series. A slope of 1 on a log-log plot is expected if the GVA estimate scales linearly with dilution. h) The drop CFU and GVA estimates are significantly correlated over 6 orders of magnitude. i) GVA performed on gram-positive, gram-negative, and eukaryotic cells (see Fig. S4a for quantification)
Figure 2:
Figure 2:. GVA dynamic range, but not accuracy, depends on the optical configuration.
a) Picture of assembled pipette tip holder on an iPhone 12 with a Xenvo macro lens. The pipette images are taken in front of a white backdrop (paper) with ambient illumination. b) Example images of the same 2 pipette tips using the Canon EOS with 100 mm f2.8 macro lens (left) or the iPhone 12 with Xenvo macro lens (right). The GVA calculated CFUs/mL are reported below. Selected colonies for GVA calculation are circled. c) Dynamic range of the iPhone GVA. E. coli were diluted 4X and embedded in pipette tips. After incubation, the same tips were imaged with the iPhone camera with macro lens (green) and the mirrorless camera (purple). Points are the mean of 4 replicates calculated after taking the log. Green and purple lines are the linear regression fit to the dilution series. d) Pearson correlation between iPhone GVA and professional camera for all pipettes where colonies could be counted using both. Correlation coefficient calculated in log-space.
Figure 3:
Figure 3:. GVA reduces the time and materials of viability measurements by over 10-fold.
a) (left) Schematic of a drop CFU assay and required materials for 96 samples assuming tips are changed for each dilution step. (middle) A Spiral Plater spreads a sample in an Archimedes spiral on a solid media plate. The spiral results in decreasing sample volume as a function of radial distance with a reported 3-log dynamic range. One petri dish is required per sample. (right) GVA uses a single pipette tip to run a 6-order dilution series. b-d) Time comparisons for different techniques. b) Time required to prepare solid growth media. The preparation time for the Spiral Plater and drop CFU includes: 1) autoclaving the agar; 2) cooling post autoclave; 3) plate pouring; and 4) an plate cooling. GVA melts agarose in a microwave which is subsequently equilibrated in a warm bath for 1 hour prior to starting. c) Sample plating from a 96-well plate. Time for the Spiral Plater assay sample plating based on industry-reported value. Drop CFU was timed by an expert user using a 12-channel pipette and changing tips at every dilution and plating step. d) Time required for quantification of 96 samples. Spiral Plater time is based on industry-reported value using an automated colony counter. GVA time includes imaging (7 min for Canon with motorized stage and 30 min for iPhone), image preprocessing and tip segmentation (5min), and semi-automated colony counting (10min) for 96 pipette tips. The drop CFU colonies were counted and recorded manually. e) Number and cost of pipette tips as a function of sample count for the three different techniques. See Supplemental Table 1 for cost estimates. f) Amount of agar required as a function of sample count. 25mL of 1.5% agar per 15cm petri dish was assumed for the drop CFU and Spiral Plater assays. 200 μL of 0.5% agarose per tip was assumed for the GVA. g) Number of 96-well and petri dishes per condition. h) Estimated total cost in consumables per 96 samples of the three methods. GVA cost is $0.17/sample. i) Instrument costs. Based on quotes for a Spiral Plater (SP) and automated imaging system from 3 manufacturers. GVA instrument cost included the Canon camera and 100mm f/2.8 macro lens. j) The difference in instrumentation cost for the Canon and iPhone optical configurations.
Figure 4:
Figure 4:. GVA has a low noise profile and is robust to missing colonies or tip position errors.
a,b) Coefficient of Variation (COV) between 4 technical replicates for different number of CFU concentrations for GVA using the Canon or iPhone optical configuration (a) and drop CFU (b). c,d) The factor the GVA calculation differs from the correct value as a function of the number of missed colonies (c) or error in tip position (d) in simulated results (see Methods). Shaded error bar is the standard deviation in 1000 simulations. e,f) Same error calculations for experimental data. Error bars represent the standard deviation between all the pipette tips (#) included in each bin. g,h) Correlation between the GVA and the drop CFU assay as a function of counting and position errors.
Figure 5:
Figure 5:. GVA screening of the Enzo library identifies DPI as active against stationary phase E. coli.
a) Dose-response of 3 antibiotics for stationary and exponential (ex) cultures after 24 hours of treatment. Each point is the mean of duplicate measurements. CFUs/mL were normalized to an untreated control. b) Viability over time for stationary and exponential cells at one concentration of antibiotic. c) Drug classes of the Enzo Bioactive Screening Library. Size of donut wedge is proportional to drug class representation. Targets of each class and relative representation depicted on the outer ring. d) Absolute viability of stationary (green) and exponentially growing (purple) cells after 24 hours of treatment with Enzo library. Each condition was run in duplicate and the mean taken in log-space. e) Scatter plot of stationary phase versus exponential phase from the screen. The standard deviation of DMSO controls are depicted with a red cross. Selected hits are annotated. f,g,h) Mitomycin C (DNA crosslinker), phentolamine (α-adrenergic antagonist), and DPI (NADPH oxidase inhibitor) dose responses in stationary and exponential cultures.
Figure 6:
Figure 6:. DPI generates ROS, activates the SOS response, and antagonizes ciprofloxacin.
a) Median, single-cell CellROX signal as a function of time for DPI (blue), ciprofloxacin (orange), and an untreated control (yellow). b) Efficacy of DPI in aerobic and anaerobic conditions. See Fig. S12b,c for ciprofloxacin and gentamicin. c) Images of live E. coli cells stained with the CellROX dye for three DPI concentrations 4 hours after adding DPI. Brightness and contrast is the same for all images. See Supplemental Movie 2. d) Measurement of polB and rrnB promoter activity normalized to t=0. e) DPI dose response for E. coli knockout mutants treated during stationary (top panels) or exponential growth (bottom panels). The dose response for the wild-type (WT) cells is depicted in green or purple, respectively. Shaded errorbars equal to the standard deviation in logspace between 3 replicates. See Fig. S14 for other mutants. f) GVA checkerboard assay for DPI combined with ciprofloxacin at 24 hours. Each square in the heatmap was the mean of duplicate conditions. Colorbar correspond to the log10(CFUs/mL) for each dose combination. Left panel shows the dose response for DPI plus 1 μg/mL ciprofloxacin (cyan). See Fig. S15 for full time series. g) GVA checkerboard assay for DPI combined with gentamicin at 24 hours. h) Growth inhibition checkerboard for DPI and ciprofloxacin. Optical density was measured for each condition over 8 hours and the integrated area under the growth curve (AUGC) is depicted (colorbar). i) Dose response curves for temporally staggered combinations. All treatments lasted for 24 hours total. Pretreated conditions were treated for 2 hours with a single drug followed by 22 hours with both drugs.

References

    1. Lázár V., Snitser O., Barkan D. & Kishony R. Antibiotic combinations reduce Staphylococcus aureus clearance. Nature, 1–7 (Oct. 2022). - PMC - PubMed
    1. Zheng E. J., Stokes J. M. & Collins J. J. Eradicating Bacterial Persisters with Combinations of Strongly and Weakly Metabolism-Dependent Antibiotics. Cell chemical biology 27, 1544–1552 (Dec. 2020). - PubMed
    1. Hazan R., Que Y. A., Maura D. & Rahme L. G. A method for high throughput determination of viable bacteria cell counts in 96-well plates. BMC Microbiology 12 (Nov. 2012). - PMC - PubMed
    1. Thieme L. et al. Adaptation of the Start-Growth-Time Method for High-Throughput Biofilm Quantification. Frontiers in Microbiology 12, 2395 (Aug. 2021). - PMC - PubMed
    1. Hazan R., Maura D., Que Y. A. & Rahme L. G. Assessing Pseudomonas aeruginosa Persister/antibiotic tolerant cells. Methods in molecular biology 1149, 699–707 (2014). - PMC - PubMed

Publication types