[Preprint]. 2023 Jan 19:2023.01.16.524277.
doi: 10.1101/2023.01.16.524277.

A single amino acid polymorphism in natural Metchnikowin alleles of Drosophila results in systemic immunity and life history tradeoffs

Affiliations

A single amino acid polymorphism in natural Metchnikowin alleles of Drosophila results in systemic immunity and life history tradeoffs

Jessamyn I Perlmutter et al. bioRxiv. .

Update in

Abstract

Antimicrobial peptides (AMPs) are at the interface of interactions between hosts and microbes and are therefore expected to be fast evolving in a coevolutionary arms race with pathogens. In contrast, previous work demonstrated that one AMP, Metchikowin (Mtk), has a single residue that segregates as either proline (P) or arginine (R) in populations of four different Drosophila species, some of which diverged more than 10 million years ago. The recurrent finding of this polymorphism regardless of geography or host species, coupled with evidence of balancing selection in Drosophila AMPs, suggest there is a distinct functional importance to each allele. The most likely hypotheses involve alleles having specificity to different pathogens or the more potent allele conferring a cost on the host. To assess their functional differences, we created D. melanogaster lines with the P allele, R allele, or Mtk null mutation using CRISPR/Cas9 genome editing. Here, we report results from experiments assessing the two hypotheses using these lines. In males, testing of systemic immune responses to a repertoire of bacteria and fungi demonstrated that the R allele performs as well or better than the P and null alleles with most infections. With some pathogens, however, females show results in contrast with males where Mtk alleles either do not contribute to survival or where the P allele outperforms the R allele. In addition, measurements of life history traits demonstrate that the R allele is more costly in the absence of infection for both sexes. These results provide strong in vivo evidence that differential fitness with or without infection and sex-based functional differences in alleles may be adaptive mechanisms of maintaining immune gene polymorphisms in contrast with expectations of rapid evolution. Therefore, a complex interplay of forces including pathogen species and host sex may lead to balancing selection for immune genotypes. Strikingly, this selection may act on even a single amino acid polymorphism in an AMP.


Figures

Figure 1.
Figure 1.. MtkR allele flies have lower egg hatch rates and adult longevity times.
(a) Overview of the experimental design, where individual pairs of males and females of a given genotype were crossed. They were allowed to lay eggs for 24 hours and these embryos were counted. They were then monitored for hatching rates and the larvae were moved into fly food vials. The pupae were counted each day, along with adult male and female emergence, and these adults were tracked over time until death. (b) The egg-to-larvae hatch rate was counted for each family. Each dot represents the offspring of a single male and female of the indicated genotype. Each dot represents the proportion of all eggs that hatched from one dish (mean eggs per dish was 41). The boxes indicate the interquartile range. Outer edges of the box indicate 25th (lower) and 75th (upper) percentiles and the middle line indicates 50th percentile (median). Whiskers represent maximum and minimum ranges of data within 1.5 times the interquartile range of the box. Letters indicate statistical significance groups, based on a logistic regression and Tukey post hoc test. (c) Lines represent adult longevity beginning at emergence from pupae. Each genotype contains an average of 3879 total flies (males plus females). Statistics based on an ANOVA with Tukey post-hoc test (Table S1). The entire experiment was performed twice, and graphs represent a combination of data from both experiments.
Figure 2.
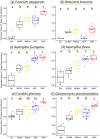
Figure 2.. MtkR male flies perform as well or better than other genotypes against a variety of filamentous fungal and yeast infections.
Infections were performed with the indicated microbes, using either spores (green underline) or yeast cultures (orange underline). Each dot represents the survival 21 days after infection for a vial starting with 10 males. Each set of data represents two independent experiments combined. Corresponding survival curves and controls for this experiment are shown in Figure S4. The boxes indicate the interquartile range. Outer edges of the box indicate 25th (lower) and 75th (upper) percentiles and the middle line indicates 50th percentile (median). Whiskers represent maximum and minimum ranges of data within 1.5 times the interquartile range of the box. Letters indicate statistical significance groups, based on a logistic regression and Tukey post hoc test (Table S1).
Figure 3.
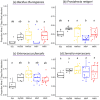
Figure 3.. Mtk alleles are associated with differential survival after infection with some bacterial infections.
Infections were performed with the indicated microbes, using bacteria (purple underline). (a) and (c) are Gram-positive, and (b) and (d) are Gram-negative). Each dot represents the survival 7 days after infection for a vial starting with 10 males. Each set of data represents two independent experiments combined. Corresponding survival curves and controls for this experiment are shown in Figure S6. The boxes indicate the interquartile range. Outer edges of the box indicate 25th (lower) and 75th (upper) percentiles and the middle line indicates 50th percentile (median). Whiskers represent maximum and minimum ranges of data within 1.5 times the interquartile range of the box. Letters indicate statistical significance groups, based on a logistic regression and Tukey post hoc test (Table S1).
Figure 4.
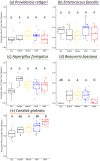
Figure 4.. Survival against some infections depends on host sex along with Mtk allele and pathogen species.
Infections were performed in females with the indicated microbes, using bacteria (purple underline), spores (green underline), or yeast (orange underline). Each dot represents the survival 21 days after infection for a vial starting with 10 females. Each set of data represents two independent experiments combined. Corresponding survival curves and controls for this experiment are shown in Figure S7. The boxes indicate the interquartile range. Outer edges of the box indicate 25th (lower) and 75th (upper) percentiles and the middle line indicates 50th percentile (median). Whiskers represent maximum and minimum ranges of data within 1.5 times the interquartile range of the box. Letters indicate statistical significance groups, based on a logistic regression and Tukey post hoc test (Table S1).
Figure 5.
Figure 5.. Side-by-side male and female fungal spore infections demonstrate key differences in phenotypes.
Infections were performed in females and males with the indicated microbes, using two representative sporulating fungal species (green underline). Each dot represents the survival 21 days after infection for a vial starting with 10 flies. Each set of data represents two independent experiments combined. Females are shown in the lighter colors on the left of each genotype pair, and males are shown in the darker colors on the right of each genotype pair. Corresponding survival curves and controls for this experiment are shown in Figure S8. The boxes indicate the interquartile range. Outer edges of the box indicate 25th (lower) and 75th (upper) percentiles and the middle line indicates 50th percentile (median). Whiskers represent maximum and minimum ranges of data within 1.5 times the interquartile range of the box. Letters indicate statistical significance groups, based on logistic regression and Tukey post-hoc test (Table S1). Non-bolded letters indicate the females, and bolded letters indicate the males.
Figure 6.
Figure 6.. Pathogen load differences suggest that greater pathogen resistance may underlie the greater survival of MtkR males with certain infections.
Infections were performed in males with the indicated microbes, using bacteria (purple underline) or yeast (orange underline). Each dot represents the pathogen load 24 hours after infection for 3 pooled flies. Each set of data represents three independent experiments combined. The boxes indicate the interquartile range. Outer edges of the box indicate 25th (lower) and 75th (upper) percentiles and the middle line indicates 50th percentile (median). Whiskers represent maximum and minimum ranges of data within 1.5 times the interquartile range of the box. Letters indicate statistical significance groups, based on a logistic regression and Tukey post hoc test (Table S1).

References

    1. Libert S., Chao Y., Chu X. & Pletcher S. D. Trade-offs between longevity and pathogen resistance in Drosophila melanogaster are mediated by NF κ B signaling. Aging cell 5, 533–543 (2006). - PubMed
    1. Schwenke R. A., Lazzaro B. P. & Wolfner M. F. Reproduction–immunity trade-offs in insects. Annual Review of Entomology 61, 239–256 (2016). - PMC - PubMed
    1. Cressler C. E., Nelson W. A., Day T. & McCauley E. Disentangling the interaction among host resources, the immune system and pathogens. Ecology letters 17, 284–293 (2014). - PMC - PubMed
    1. Short S. M. & Lazzaro B. P. Reproductive status alters transcriptomic response to infection in female Drosophila melanogaster. G3: Genes, Genomes, Genetics 3, 827–840 (2013). - PMC - PubMed
    1. Lochmiller R. L. & Deerenberg C. Trade-offs in evolutionary immunology: just what is the cost of immunity? Oikos 88, 87–98 (2000).

Publication types