[Preprint]. 2023 Jan 2:2022.12.31.522383.
doi: 10.1101/2022.12.31.522383.

Non-catalytic role of phosphoinositide 3-kinase in mesenchymal cell migration through non-canonical induction of p85β/AP-2-mediated endocytosis

Affiliations

Non-catalytic role of phosphoinositide 3-kinase in mesenchymal cell migration through non-canonical induction of p85β/AP-2-mediated endocytosis

Hideaki T Matsubayashi et al. bioRxiv. .

Update in

Abstract

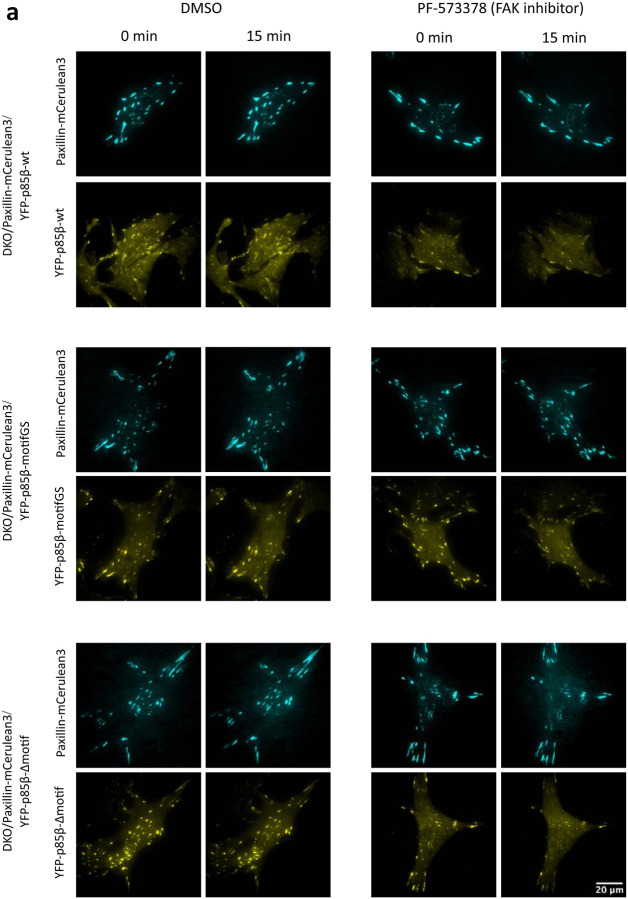
Class IA phosphoinositide 3-kinase (PI3K) galvanizes fundamental cellular processes such as migration, proliferation, and differentiation. To enable multifaceted roles, the catalytic subunit p110 utilizes a multidomain, regulatory subunit p85 through its inter SH2 domain (iSH2). In cell migration, their product PI(3,4,5)P3 generates locomotive activity. While non-catalytic roles are also implicated, underlying mechanisms and its relationship to PI(3,4,5)P3 signaling remain elusive. Here, we report that a disordered region of iSH2 contains previously uncharacterized AP-2 binding motifs which can trigger clathrin and dynamin-mediated endocytosis independent of PI3K catalytic activity. The AP-2 binding motif mutants of p85 aberrantly accumulate at focal adhesions and upregulate both velocity and persistency in fibroblast migration. We thus propose the dual functionality of PI3K in the control of cell motility, catalytic and non-catalytic, arising distinctly from juxtaposed regions within iSH2.


Figures

Extended Data Figure 1:
Extended Data Figure 1:. Prediction of intrinsically disordered regions.
Intrinsically disordered region of mouse p85β (PIK3R2) was analyzed by three algorithms, IUPred2A, PrDOS, and PONDR.
Extended Data Figure 2:
Extended Data Figure 2:. iSH2-vesicles colocalize with mCLING dye.
Epi-fluorescence microscopy images of iSH2-vesicles colocalized with extracellularly added mCLING-ATTO647. Cos7 cells were transiently transfected with Lyn-ECFP-FRB, EYFP-FKBP-iSH2, mCherry-PH(Akt). After mCLING addition, iSH2 translocation and vesicle formation was induced by 100 nM rapamycin. 30 min after rapamycin addition, the samples were chilled, washed, and fixed with 4% paraformaldehyde. Top: raw image of a transfected cell. Bottom: enlarged images of dashed line area of top images. To reduce background noise, median filtered values were subtracted from the raw images.
Extended Data Figure 3:
Extended Data Figure 3:. Temperature dependency of iSH2-mediated endocytosis.
(a) Confocal images of endocytic vesicle production and PH(Akt) translocation. HeLa cells were transiently transfected with Lyn-ECFP-FRB, mCherry-PH(Akt), and EYFP-FKBP or EYFP-FKBP-iSH2. (−) before rapamycin addition, rapa(+) 20 min after adding 100 nM rapamycin. (b) Quantified iSH2-mediated endocytosis indices. The values were normalized by time=0. Box whisker plots represent median, 1st, 3rd quartiles and 1.5×inter-quartile range. P-value ***: < 0.001. Steel-Dwass test. (c) Time course of PH(Akt) translocation. Cytosolic intensity of mCherry-PH(Aki) was quantified and normalized by time=0. Error bars represent standard deviation. YF 37°C, n=15 cells. YF-iSH2 23°C, n=30 cells. YF-iSH2 37°C, n=28 cells.
Extended Data Figure 4:
Extended Data Figure 4:. Generality of iSH2-mediated endocytosis.
(a, b) Confocal images of iSH2-vesicles produced with different plasma membrane anchors and the quantified iSH2 puncta index. Cos7 cells were transiently transfected with EYFP-FKBP-iSH2, mCherry-PH(Akt), and ECFP-FRB fused with different types of plasma membrane anchors. 15 min after adding 100 nM rapamycin, cells were chilled, washed, and fixed with 4% paraformaldehyde and 0.15% glutaraldehyde. Box whisker plots represent median, 1st, 3rd quartiles and 1.5×inter-quartile range. (c) Confocal images of iSH2-vesicles induced by iLID/SspB system. Cos7 cells were transiently transfected with Lyn-iLID and EYFP-SspB-iSH2. dark: before light stimulation. lit (458 nm): 15 min after 458 nm light illumination. EYFP-SspB-iSH2 shows punctate structure in the cytosol.
Extended Data Figure 5:
Extended Data Figure 5:. Vesicle formation with iSH2 variants.
(a) List of the tested iSH2 mutants. Underlines indicate mutation sites. Here, wild type is derived from iSH2 domain of mouse p85β. (b) Confocal images of iSH2-vesicles produced with wild type and mutant iSH2. Cos7 cells were transiently transfected with Lyn-ECFP-FRB, EYFP-FKBP-iSH2, and mCherry-PH(Akt). 15 min after adding 100 nM rapamycin, cells were chilled, washed, and fixed with 4% paraformaldehyde and 0.15% glutaraldehyde.
Extended Data Figure 6:
Extended Data Figure 6:. iSH2 recruits AP-2 to plasma membrane.
(a) Schematic of co-recruitment assay. Interaction between bait and prey was evaluated by rapamycin-dependent increase in plasma membrane intensify of prey, here AP-2-mCherry. (b) Representative images showing changes in TIRF fluorescence intensities on plasma-membrane recruitment of EYFP-FKBP-iSH2, EYFP-FKBP-iSH2-motifGS and EYFP-FKBP-iSH2-Δmotif and corresponding changes in AP2-mCherry intensities. Scale bar: 10 μm. (c) Co-recruitment indices (I/I0) of mCherry with EYFP-FKBP-iSH2 and of AP2-mCherry with EYFP-FKBP-iSH2, EYFP-FKBP-iSH2-GSmotif and EYFP-FKBP-iSH2-Δmotif using the live cell co-recruitment assay. ***, P < 0.001 or as shown, Student’s t test. (d) TIRF images showing co-localization between YF-iSH2 and mCherry-AP-2(μ2). During live cell imaging, images were taken 1 min after 100 nM rapamycin addition. To reduce noise, median filtered images were subtracted from raw images. Graphs show line scan of dashed lines in merge images. (e) Pearson’s correlation between YFP signal and mCherry-AP-2(μ2) signal of (d). Calculation was performed on raw images. For each cell, 10 μm (80 pixels) × 10 μm (80 pixels) areas were selected for the quantification. Steel-Dwass test. P-values: *: < 0.05, **: < 0.01, ***: < 0.001, ****: < 0.0001.
Extended Data Figure 7:
Extended Data Figure 7:. iSH2-mediated endocytosis is independent of PI3K catalytic activity and C-terminal 46 aa region is necessary and sufficient.
(a) Time course of PH(Akt) translocation of Fig. 2a. Cytosolic intensity of mCherry-PH(Akt) was quantified and normalized by time=0. Error bars represent standard deviation. YF-iSH2, n=30 cells. YF-iSH2 + LY, n=28 cells. YF-iSH2DN, n=27 cells. YF, n=28 cells. (b) Confocal images of vesicles induced by iSH2 derived from different p85 isoforms. Cos7 cells were transiently transfected with Lyn-ECFP-FRB, EYFP-FKBP-iSH2, and mCherry-PH(Akt). 15 min after adding 100 nM rapamycin, cells were chilled, washed, and fixed with 4% paraformaldehyde and 0.15% glutaraldehyde. (c) Schematic representation of iSH2 truncates. Crystal structure of p110β-iSH2β is derived from PDB 2y3a. (d) Representative confocal image of live-cell plasma membrane recruitment of iSH2 truncates in HeLa expressing Lyn-ECFP-FRB, EYFP-FKBP-iSH2 (truncates), and mCherry-PH(Akt). Scale bar, 5 μm. (e) Quantified iSH2 puncta index of iSH2 truncates tested in Cos7 cells expressing LynECFP-FRB, EYFP-FKBP-iSH2 (truncates), and mCherry-PH(Akt). YF-46aa, n=38 cells. YF-N20aa, n=39 cells. YF-C20aa, n=48 cells. YF, n=27 cells. YF-iSH2, n=46 cells. Box whisker plots represent median, 1st, 3rd quartiles and 1.5×inter-quartile range. P-values (Steel-Dwass test): *: < 0.05, **: < 0.01, ***: < 0.001, ****: < 0.0001. n.s.: not significant. (f) Confocal live-cell images of iSH2-vesicles and PH(Akt) translocation. (g) Time course of PH(Akt) translocation of (f). Cytosolic intensity of mCherry-PH(Aki) was quantified and normalized by time=0. Error bars represent standard deviation. YF, n=17 cells. YF-iSH2, n=41 cells. YF-iSH2Δ46aa, n=39 cells. YF-46aa, n=22 cells. (f, g) Data correspond with Fig. 2c.
Extended Data Figure 8:
Extended Data Figure 8:. Generation and Functional analysis of p85-rescued MEFs.
(a) p85α, β double knockout (DKO) MEFs were infected with lentiviruses encoding YFP-p85 variants. Infected cells were FACS-sorted by YFP fluorescence. (b) Epi-fluorescence microscopy images of each cell lines. Dynamic range was adjusted between. c) ERK response to PDGF stimulation. Each cell lines were transiently transfected with mCherry-ERKKTR. The cells were serum starved and stimulated with 50 ng/mL PDGFBB. ERKKTR response was recorded by live cell imaging at 37°C with 5% CO2. Left: epi-fluorescence microscopy images of mCherry-ERKKTR. Right: quantified Cytosol/Nucleus ratio of mCherry-ERKKTR. Error bars represent 2×SEM (95% CI). DKO, n=18 cells. DKO/p85α-wt, n=18 cells. DKO/p85β-wt, n=18 cells. DKO/p85β-motifGS, n=19 cells. DKO/p85β-Δmotif, n=19 cells. (d) Transferrin uptake. Alexa Fluor 647-conjugated transferrin was added to serum starved cells. After the indicated time, the cells were chilled, washed with acid, and fixed with 4% paraformaldehyde. Left: epi-fluorescence microscopy images of Alexa Fluor 647-conjugated transferrin. Right: quantified Alexa Fluor 647 intensity. Error bars represent standard deviation. n>61 cells for each time point.
Extended Data Figure 9:
Extended Data Figure 9:. PF-573378 (FAK inhibitor) response of p85 variants.
(a) TIRF images of MEFs stably expressing Paxillin-mCerulean3 and YFP-p85 variants. The cells were serum starved and imaged at 37°C with 5% CO2. (b) Normalized YFP-p85 intensity at focal adhesions. YFP-p85 intensity at focal adhesion was measured with image masks created by Paxillin-mCerulean3 images and normalized by time=0. Error bars represent standard deviation. DKO/p85β-wt, n=20 cells. DKO/p85β-motifGS, n=22 cells. DKO/p85β-Δmotif, n=18 cells.
Extended Data Figure 10:
Extended Data Figure 10:. Supplementary data of migration assay.
(a–c) Random migration. (a) Cell track analysis of each cell lines. Data correspond with Fig. 4b–d. (b) Full data of random migration including PI3K inhibitor LY294002 data and FAK inhibitor PF-573228 data. Data correspond with Fig. 4b–d. (c) Different data set of random migration including DKO/p85α-wt.
Figure 1:
Figure 1:. Plasma membrane recruitment of iSH2 domain induces clathrin and dynamin dependent endocytosis.
(a) Crystal structure of PI3K (PDB 2y3a) and AP-2 binding motifs of mouse p85β iSH2 domain. (b) Confocal images of endocytic vesicles produced by plasma membrane targeting of iSH2 domain. HeLa cells were transiently transfected with Lyn-ECFP-FRB, mCherry-PH(Akt), and EYFP-FKBP or EYFP-FKBPiSH2. Images show before and after 100 nM rapamycin addition. (c) Confocal images of iSH2-induced vesicles colocalized with endocytosis marker molecules: mCherry-Rab5 (early endosome) and LAMP1mRFP (lysosome). mCherry (cytosol) and mCherry-KDEL (ER) were used as negative controls. The graph shows Pearson’s correlation between iSH2 and marker molecules. (d) Quantified iSH2-mediated endocytosis indices (see method) of wild type and mutants in di-leucine motif and acidic cluster, but not YxxΦ motif. (e) TIRF images of iSH2 vesicles colocalized with AP-2. (f, g) Confocal images of iSH2 vesicles showing dynamin and clathrin dependency. Vesicle formation was suppressed in the presence of dominant negative form of dynamin (K44A) or AP180C. Box whisker plots represent median, 1st, 3rd quartiles and 1.5×inter-quartile range. P-values: *: < 0.05, **: < 0.01, ***: < 0.001, ****: < 0.0001. n.s.: not significant. (c, d) Steel-Dwass test. In the right panel of (d), p-values against YF-iSH2 were only shown. (f, g) Wilcoxon rank sum test.
Figure 2:
Figure 2:. iSH2-mediated endocytosis is independent of PI3K catalytic activity and C-terminal 46 aa region is necessary and sufficient.
(a) Confocal images of PI(3,4,5)P3 sensor PH(Akt) and iSH2 vesicles. Quantifications are shown on the right. LY294002: PI3K inhibitor, iSH2(DN): deletion mutant lacking p110 binding site. (b) Top: Amino acid sequence alignment of AP-2 binding motif region of human and mouse p85α, p85β, p55γ isoforms. Bottom: Quantification of iSH2 vesicles produced by each isoform. (c) Secondary structure of mouse p85β iSH2 domain and quantification of PH(Akt) translocation and iSH2 vesicles. Box whisker plots represent median, 1st, 3rd quartiles and 1.5×inter-quartile range. P-values: *: < 0.05, **: < 0.01, ***: < 0.001, ****: < 0.0001. n.s.: not significant.
Figure 3:
Figure 3:. Mutation in AP-2 binding motifs of p85β increases focal adhesion localization.
(a) Schematic of receptor tyrosine kinase-dependent and focal adhesion-dependent PI3K pathways. (b) Western blot of total- and phospho-Akt (T308) and its quantification. Cells were treated with 50 ng/mL PDGF for indicated time. pAkt/Akt level was normalized to DKO/p85β-wt 5 min. Error bars represent standard deviations. (c) Doubling time of DKO and p85 rescued MEF cells. (d) Confocal images of p85β-wt and p85β-motifGS cells and their quantification. Yellow: EYFP-p85β, Magenta: immunofluorescence against vinculin. (e) Western blot of total- and phospho-FAK (Y397) and its quantification. (f) FAK activity dependency of p85 focal adhesion localization. Cells were treated with DMSO or 10 μM PF-573228 (FAK inhibitor; FAKi) for 5 min and EYFP-p85β intensity were divided by the values of time=0. Box whisker plots represent median, 1st, 3rd quartiles and 1.5×inter-quartile range. P-value:****: < 0.0001. (d) Wilcoxon rank sum test.
Figure 4:
Figure 4:. Mutation in AP-2 binding motifs of p85β enhances cell motility in random and chemotactic migration.
(a) Representative tracks of 2D random migration on fibronectin coated plates. Cells were allowed to migrate at 37°C with 5% CO2 and 10% FBS. 0.25 mg/mL Hoechst 33342 was used for tracking cells. (b, c, d) Quantification of migration parameters. Error bars in (c) and (d) represent 2×SEM (95% CI). (e) Representative tracks of chemotaxis in μ-Slide chemotaxis chamber (ibidi). Cells were allowed to migrate at 37°C with 5% CO2 in the presence of 1–20% FBS gradient. 0.25 mg/mL Hoechst 33342 was used for tracking cells. (f, g, i and j) Quantification of migration parameters. Error bars in (g and i) represent 2×SEM (95% CI). (h) Schematic of displacement: d, distance: D, and forward displacement: y. Persistence ratio was defined as d/D, while Forward migration index was defined as y/D. Box whisker plots represent median, 1st, 3rd quartiles and 1.5×inter-quartile range. (b, f, and j) Steel-Dwass test was performed and p-values against DKO/p85β-wt were indicated. P-values: ****: < 0.0001. n.s.: not significant. In (j), p-values of Steel-Dwass test were < 0.001 for wt-DKO, <0.05 for wt-DKO/p85α-wt, a <0.001 for wt-DKO/p85β-motifGS, respectively, while the other pairs were not significant.

References

    1. Vanhaesebroeck B., Guillermet-Guibert J., Graupera M. & Bilanges B. The emerging mechanisms of isoform-specific PI3K signalling. Nature Reviews Molecular Cell Biology 11, 329–341 (2010). - PubMed
    1. Fruman D. A. et al. The PI3K Pathway in Human Disease. Cell 170, 605–635 (2017). - PMC - PubMed
    1. Marat A. L. & Haucke V. Phosphatidylinositol 3-phosphates—at the interface between cell signalling and membrane traffic. The EMBO Journal 35, 561–579 (2016). - PMC - PubMed
    1. Bilanges B., Posor Y. & Vanhaesebroeck B. PI3K isoforms in cell signalling and vesicle trafficking. Nature Reviews Molecular Cell Biology 20, 515–534 (2019). - PubMed
    1. Bear J. E. & Haugh J. M. Directed migration of mesenchymal cells: Where signaling and the cytoskeleton meet. Current Opinion in Cell Biology 30, 74–82 (2014). - PMC - PubMed

Publication types