[Preprint]. 2023 Jan 10:rs.3.rs-2334665.
doi: 10.21203/rs.3.rs-2334665/v1.

Heterogeneity in the M. tuberculosis β-Lactamase Inhibition by Sulbactam

Affiliations

Heterogeneity in the M. tuberculosis β-Lactamase Inhibition by Sulbactam

Marius Schmidt et al. Res Sq. .

Update in

  • Heterogeneity in M. tuberculosis β-lactamase inhibition by Sulbactam.
    Malla TN, Zielinski K, Aldama L, Bajt S, Feliz D, Hayes B, Hunter M, Kupitz C, Lisova S, Knoska J, Martin-Garcia JM, Mariani V, Pandey S, Poudyal I, Sierra RG, Tolstikova A, Yefanov O, Yoon CH, Ourmazd A, Fromme P, Schwander P, Barty A, Chapman HN, Stojkovic EA, Batyuk A, Boutet S, Phillips GN Jr, Pollack L, Schmidt M. Malla TN, et al. Nat Commun. 2023 Sep 7;14(1):5507. doi: 10.1038/s41467-023-41246-1. Nat Commun. 2023. PMID: 37679343 Free PMC article.

Abstract

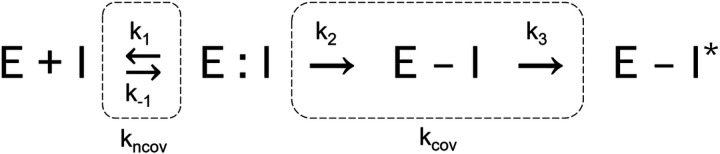
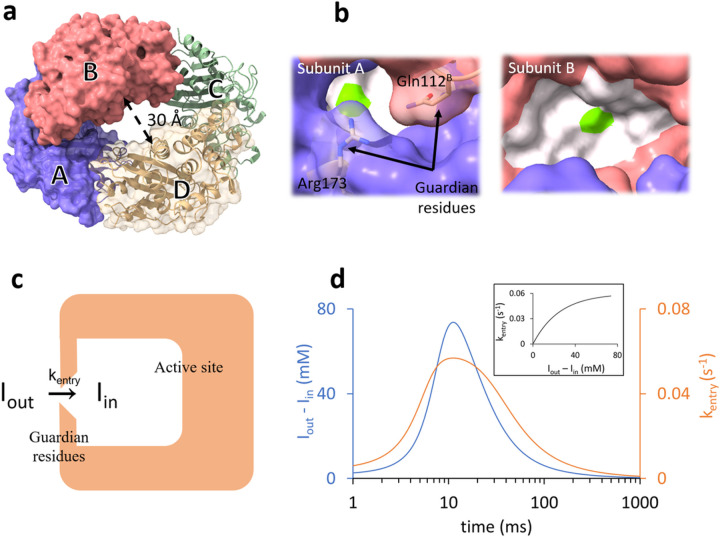
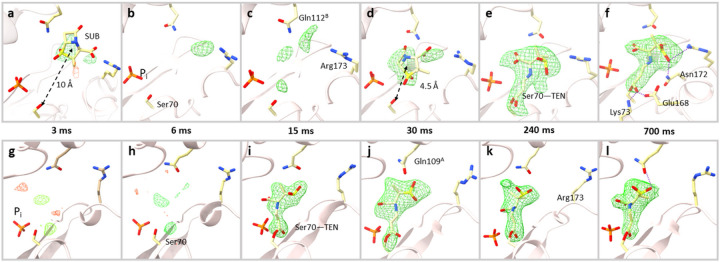
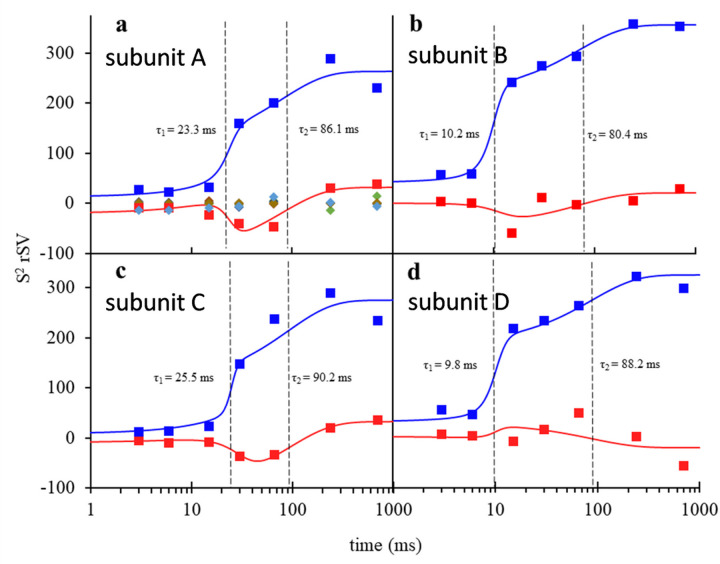
For decades, researchers have been determined to elucidate essential enzymatic functions on the atomic lengths scale by tracing atomic positions in real time. Our work builds on new possibilities unleashed by mix-and-inject serial crystallography (MISC) 1-5 at X-ray free electron laser facilities. In this approach, enzymatic reactions are triggered by mixing substrate or ligand solutions with enzyme microcrystals 6 . Here, we report in atomic detail and with millisecond time-resolution how the Mycobacterium tuberculosis enzyme BlaC is inhibited by sulbactam (SUB). Our results reveal ligand binding heterogeneity, ligand gating 7-9 , cooperativity, induced fit 10,11 and conformational selection 11-13 all from the same set of MISC data, detailing how SUB approaches the catalytic clefts and binds to the enzyme non-covalently before reacting to a trans- enamine. This was made possible in part by the application of the singular value decomposition 14 to the MISC data using a newly developed program that remains functional even if unit cell parameters change during the reaction.


Figures

Figure 1
Figure 1
A simplified two-step mechanism of BlaC inhibition by sulbactam. The first step is the formation of the non-covalent enzyme inhibitor complex whose rate of formation depends on the concentration of the inhibitor in the unit cell and the rate coefficient (kncov). The nucleophilic attack by the active serine opens the lactam ring of SUB leading to the formation of acyl-enzyme intermediate (E-I). The E-I intermediate does not accumulate to become observable. The next step is the irreversible inhibition of enzyme by the chemically modified inhibitor (E-I*) which depends on the apparent rate coefficient (kcov).
Figure 2
Figure 2
Structure of BlaC and the gating mechanism. (a) Subunits A - D in the asymmetric unit are marked and shown by blue, red, green, and yellow respectively. (b) Binding pockets of subunit B (top) and subunit A (bottom). The active site is represented by the white surface. The position of the catalytically active serine is marked in green. The access to the active site in subunit B is wide open. The entrance to the active site of subunit A is partially occluded by two residues (Gln112B and Arg173) called the guardian residues. (c) Simplified scheme depicting the delayed entry of sulbactam into the active site through the guardian residues in subunits A/C. (b) Time-dependence of the concentration difference (blue line) and of the rate coefficient kentry (orange line). Inset: The dependence of kentry on the concentration difference.
Figure 3
Figure 3
Difference electron density maps at the active site of subunit A and subunit B (contour level ±3σ). Subunit A top row: (a) At 3ms, weak densities can be identified at the entrance of cavity between Gln112B and Arg173 and a SUB placed there. (b) At 6ms, very weak density is observed. The phosphate molecule (Pi) near the active site is marked. (c) At 15ms, difference density features are identified closer to the catalytically active residue Ser70. The guardian residues (Gln112B and Arg173) that are located at the entrance to the binding pocket are marked. (d) At 30 ms a strong DED feature appears within the active site. An intact SUB molecule is placed there. (e) At 240 ms, the SUB has reacted with Ser70 to form TEN giving rise to an elongated density. (f) At 700 ms, the elongated density of the TEN is fully developed. Additional hydrogen bonds between the TEN and other side chains are shown. Subunit B, bottom row: (g-h) At 3 and 6ms, no interpretable density was present in the catalytic center. (i) At 15ms, the SUB has already reacted with Ser70 to from TEN. (j-l) TEN densities as observed at Δmisc from 30 ms to 700 ms. Gln109A and Arg173 are marked in j and k, respectively.
Figure 4
Figure 4
Right singular vectors (rSVs) derived from a singular value decomposition of the time-dependent DED maps in the active sites of the BlaC. (a) Right singular vectors plotted as a function of Δtmisc for subunit A. The first and second significant rSV are shown by blue and red triangles respectively. Solid colored lines are the result of a global fit of Eqn. 2 to the significant rSVs. The colored diamonds represent insignificant rSVs. (b-d) Significant rSVs plotted as a function of Δtmisc for subunits B, C and D respectively. Colors and lines as in panel (a). The vertical dashed black lines in all panels denote the relaxation times τ1 and τ2 that result from the fit. For subunits A and C, τ1 belongs to accumulation of intact SUB in the active site, and τ2 corresponds to the formation of the covalently bound TEN. For subunits B and D, τ1 denotes the time when the reaction to TEN occurs and τ2 indicates a second relaxation phase.
Figure 5
Figure 5
Calculated concentration profiles of reactants and products in the active sites of BlaC compared to corresponding observables. (a) Subunits B/D. Blue line: free SUB concentrations [I] in the unit cell. Blue squares: SUB concentrations in the central flow of the injector. Red line: time-dependent concentrations of the free BlaC [Efree]. Orange line: concentrations of the non-covalently bound SUB [E:I] intermediate (not observable). Green line: concentrations of the covalent enzyme-inhibitor complex TEN [E-I*]. Green triangles and diamonds: concentrations of E-I*, derived from refined ligand occupancy values in subunits B and D, respectively. Grey circles: SUB cannot be detected near the active sites. (b) Subunits A/C. Blue dotted line: free SUB concentrations [I] in the unit cell. Blue line: SUB concentrations [Iin] in the active site (note the delay relative to subunits B/D). Red line: time-dependent concentration of the free BlaC [Efree]. Orange line: concentrations of the non-covalently bound SUB [E:I] intermediate. Green line: concentrations of the covalent enzyme-inhibitor complex TEN [E-I*]. Orange and green triangles and diamonds: concentrations of E:I and E-I* derived from refined ligand occupancy values in subunits B and D, respectively.

References

    1. Kupitz C. et al. Structural enzymology using X-ray free electron lasers. Struct Dyn 4, 044003, doi: 10.1063/1.4972069 (2017). - DOI - PMC - PubMed
    1. Stagno J. R. et al. Structures of riboswitch RNA reaction states by mix-and-inject XFEL serial crystallography. Nature 541, 242–246, doi: 10.1038/nature20599 (2017). - DOI - PMC - PubMed
    1. Mehrabi P. et al. Liquid application method for time-resolved analyses by serial synchrotron crystallography. Nature methods 16, 979–982, doi: 10.1038/s41592-019-0553-1 (2019). - DOI - PubMed
    1. Ishigami I. et al. Snapshot of an oxygen intermediate in the catalytic reaction of cytochrome c oxidase. Proceedings of the National Academy of Sciences of the United States of America 116, 3572–3577, doi: 10.1073/pnas.1814526116 (2019). - DOI - PMC - PubMed
    1. Dasgupta M. et al. Mix-and-inject XFEL crystallography reveals gated conformational dynamics during enzyme catalysis. Proceedings of the National Academy of Sciences of the United States of America, doi: 10.1073/pnas.1901864116 (2019). - DOI - PMC - PubMed

Publication types

LinkOut - more resources