

Paleoeconomy more than demography determined prehistoric human impact in Arctic Norway
- PMID: 36712342
- PMCID: PMC9802259
- DOI: 10.1093/pnasnexus/pgac209
Paleoeconomy more than demography determined prehistoric human impact in Arctic Norway
Erratum in
-
Correction to: Paleoeconomy more than demography determined prehistoric human impact in Arctic Norway.PNAS Nexus. 2023 Feb 15;2(2):pgad040. doi: 10.1093/pnasnexus/pgad040. eCollection 2023 Feb. PNAS Nexus. 2023. PMID: 36874275 Free PMC article.
Abstract
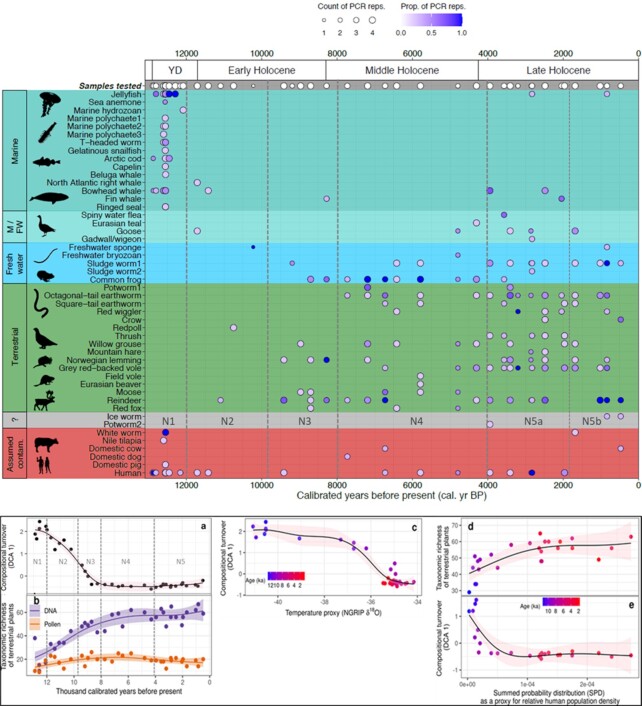
Population size has increasingly been taken as the driver of past human environmental impact worldwide, and particularly in the Arctic. However, sedimentary ancient DNA (sedaDNA), pollen and archaeological data show that over the last 12,000 years, paleoeconomy and culture determined human impacts on the terrestrial ecology of Arctic Norway. The large Mortensnes site complex (Ceavccageađgi, 70°N) has yielded the most comprehensive multiproxy record in the Arctic to date. The site saw occupation from the Pioneer period (c. 10,000 cal. years BP) with more intensive use from c. 4,200 to 2,000 cal. years BP and after 1,600 cal. years BP. Here, we combine on-site environmental archaeology with a near-site lake record of plant and animal sedaDNA. The rich animal sedaDNA data (42 taxa) and on-site faunal analyses reveal switches in human dietary composition from early-Holocene fish + marine mammals, to mixed marine + reindeer, then finally to marine + reindeer + domesticates (sheep, cattle, pigs), with highest reindeer concentrations in the last millennium. Archaeological evidence suggests these changes are not directly driven by climate or variation in population densities at the site or in the region, but rather are the result of changing socio-economic activities and culture, probably reflecting settlers' origins. This large settlement only had discernable effects on its hinterland in the last 3,600 years (grazing) and more markedly in the last 1,000 years through reindeer keeping/herding and, possibly domestic stock. Near-site sedaDNA can be linked to and validate the faunal record from archaeological excavations, demonstrating that environmental impacts can be assessed at a landscape scale.
Keywords: Arctic ecology; climate human impact; hunter–gatherers–fishers; sedimentary ancient DNA; sustainability.
© The Author(s) 2022. Published by Oxford University Press on behalf of National Academy of Sciences.
Figures


References
-
- Masson-Delmotte V, et al. 2021. Climate Change 2021: The Physical Science Basis. Contribution of Working Group I to the Sixth Assessment Report of the Intergovernmental Panel on Climate Change. IPCC Sixth Assessment Report. Cambridge: Cambridge University Press.
-
- Chapin FS, et al. 2004. Resilience and vulnerability of northern regions to social and environmental change. AMBIO. 33:344–349. - PubMed
-
- Ravolainen V, Bjorkman AD. 2018. State of the Arctic Terrestrial Biodiversity Report. 3.1 Vegetation in State of the Arctic Terrestrial Biodiversity Report. Conservation of Arctic Flora and Fauna (CAFF), 29–35.. https://caff.is/monitoring-series/all-monitoring-documents/558-start-3-1... [accessed 12/10/2022]
-
- Schuyler Q, et al. 2021. Human population density is a poor predictor of debris in the environment. Front Environ Sci. 9:583454.
LinkOut - more resources
Full Text Sources
Miscellaneous
