Review
. 2022 Oct 20:12:200-214.
doi: 10.1016/j.aninu.2022.10.001. eCollection 2023 Mar.

Functionality of dietary antimicrobial peptides in aquatic animal health: Multiple meta-analyses

Affiliations
Review

Functionality of dietary antimicrobial peptides in aquatic animal health: Multiple meta-analyses

Jinhai Wang et al. Anim Nutr. .

Abstract

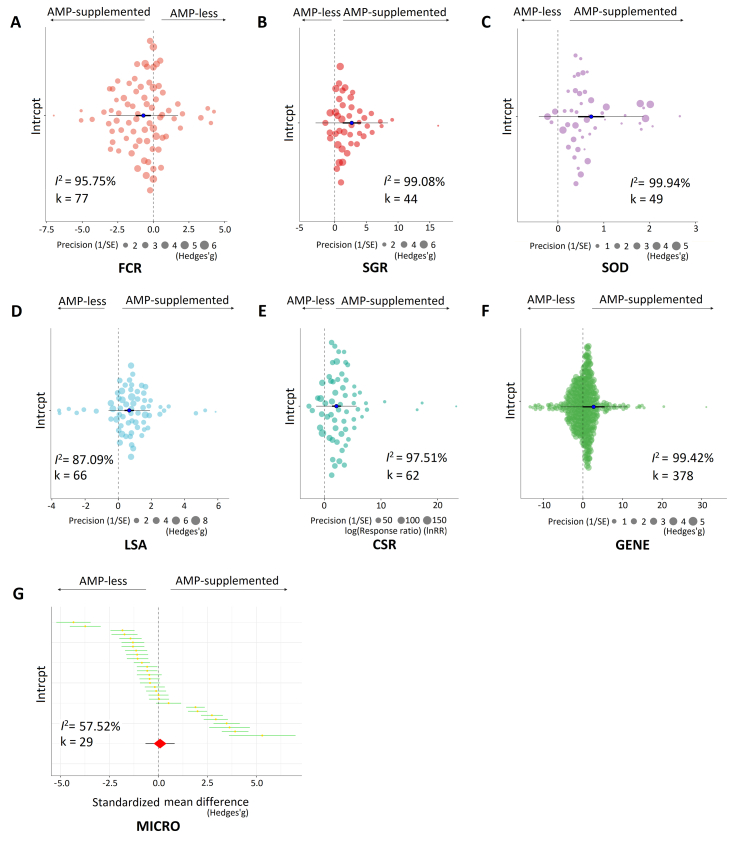
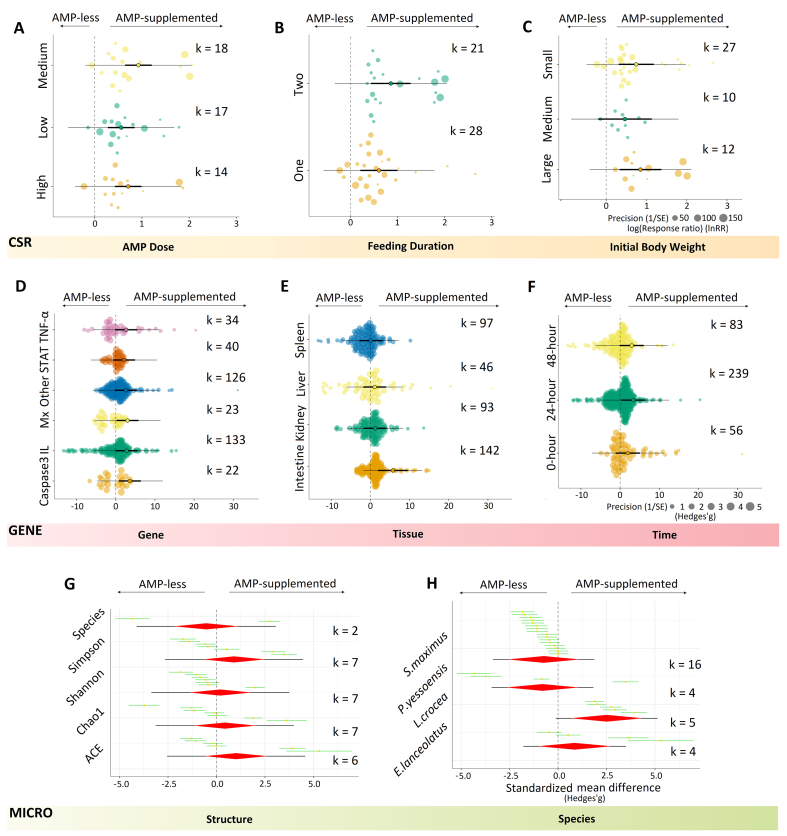
Effects of antimicrobial peptides (AMP) added to diets on aquatic animal health and body function are influenced by multiple factors such as animal species, initial body weight, the dosage of AMP and feeding duration. However, there is limited knowledge on the relationship between these factors and the body function of aquatic animals. Here, we aimed to perform multiple meta-analyses to investigate the effects of dietary AMP on growth performance (feed conversion ratio [FCR], specific growth rate [SGR]), enzyme activity (superoxide dismutase activity [SOD], lysozyme activity [LSA]), disease resistance (cumulative survival rate [CSR], the expression of immune-related genes [GENE]) and the abundance of gut microbiota (MICRO) from a pool of empirical studies. Additionally, the dose-effect model was applied to determine the optimal AMP dose, initial body weight and feeding duration to maximize body function. To conduct the meta-analyses, we included 34 publications that estimated 705 effect sizes across 21 fish, 2 shrimp and 2 shellfish species. The results confirmed that the inclusion of AMP in the diet can significantly improve SGR, SOD, LSA, CSR and GENE and decrease FCR for aquatic animals. Interestingly, our findings implied a slight positive effect of AMP on MICRO albeit with a limited number of studies available on fish gut microbial communities. Although no significant linear or quadratic relationship was predicted by meta-regression, the dose-effect indicated that the optimal AMP doses for FCR, SGR, SOD and LSA were 707.5, 750.0, 1,050.0 and 937.5 mg/kg, respectively. Taken together, fish with an initial body weight of 30 g could be fed with a dose of 600 to 800 mg/kg for 2 mo when AMP-supplemented diets were applied in aquaculture, which can effectively improve body function and health while lowering aquafeed costs. In addition, more studies should address fish gut microbiota to delimitate the influence of dietary AMP on MICRO in the future.

Keywords: AMP; Dose-effect; Feed additive; Fish; Immune; Oral administration.


Conflict of interest statement

We declare that we have no financial and personal relationships with other people or organizations that can inappropriately influence our work, and there is no professional or other personal interest of any nature or kind in any product, service and/or company that could be construed as influencing the content of this paper.

Figures

Fig. 1
Fig. 1
A summary of the current application of antimicrobial peptides (AMP) as feed additives in aquatic animals. (A) A total of 34 papers focused on the study of AMP additives, which covered 16 kinds of AMP (5 of those without specific names are classified as other AMP), 25 aquatic animals (21 fish, 2 shrimp and 2 shellfish). The inserted numbers on the pie chart indicate the number of publications. For example, 15 indicates that there are 15 papers studying the performance of aquatic animals using lactoferrin as a feed additive, and these publications cover 11 fish species and 1 shrimp. (B) A total of 27 studies related to disease resistance were validated through pathogen-challenge experiments, which included 12 pathogens, covering 21 aquatic animals (18 fish, 2 shrimp and 1 shellfish). For example, 10 demonstrates that 10 papers are focused on disease resistant against Aeromonas hydrophila employing AMP as feed additives, which cover 7 fish, 1 shrimp and 1 eel. APSH-07, an AMP from large yellow croaker; TP4, Tilapia piscidin 4; TH2-3, Tilapia hepcidin 2-3; IsCT, Isalo scorpion cytotoxic peptide; CM11, a small peptide with 11 residues derived from cecropin and melittin; AP1, an AMP from Bacillus subtilis B06; Other AMP, AMP not mentioned by names or sequences.
Fig. 2
Fig. 2
Overall effect of AMP-supplemented feeds on individual performance (growth performance, enzyme activity, disease resistance and the abundance of gut microbiota) based on overall effect size. (A) Orchard plot of dietary AMP impact on FCR using the standardized mean difference (SMD, Hedges'g) as the effect size. (B) Orchard plot of dietary AMP impact on SGR using SMD as the effect size. (C) Orchard plot of dietary AMP impact on SOD using SMD as the effect size. (D) Orchard plot of dietary AMP impact on LSA using SMD as the effect size. (E) Orchard plot of dietary AMPs impact on CSR using log10(Response ratio) as the effect size. (F) Orchard plot of dietary AMP impact on GENE using SMD as the effect size. (G) Caterpillar plot shows the overall effect of dietary AMP on MICRO using Hedges'g as the effect size. K indicates the number of effect sizes from the pool of empirical studies. For example, k = 77 shows 77 effect sizes are calculated for FCR from our recruited papers. AMP-less, basal diets without AMP; AMP-supplemented, diets with AMP; I2, the heterogeneity index across studies. SMD is depicted with 95% confidence intervals (CI) and 95% predicted intervals (PI) as scaled effect-size points for each study. Each colorful circle represents a scaled effect size. The dot at the center of each circle is the mean effect size. The diameter of the circles represents the 95% CI of the effect size. AMP = antimicrobial peptide; FCR = feed conversion ratio; SGR = specific growth rate; SOD = superoxide dismutase activity; LSA = lysozyme activity; CSR = cumulative survival rate after pathogen infection; GENE = expression of immune-related genes; MICRO = the abundance of gut microbiota.
Fig. 3
Fig. 3
Moderator-analysis results of the effect of AMP-supplemented feeds on aquatic animal growth performance and enzyme activity. (A) The effect of AMP dose on FCR based on dose-moderator analysis. (B) The effect of initial body weight on FCR based on IBW-moderator analysis. (C) The effect of feeding duration on FCR based on duration-moderator analysis. (D) The effect of AMP dose on SGR based on dose-moderator analysis. (E) The effect of feeding duration on SGR based on duration-moderator analysis. (F) The effect of initial body weight on SGR based on IBW-moderator analysis. (G) The effect of AMP dose on SOD based on dose-moderator analysis. (H) The effect of initial body weight on SOD based on IBW-moderator analysis. (I) The effect of feeding duration on SOD based on duration-moderator analysis. (J) The effect of AMP dose on LSA based on dose-moderator analysis. (K) The effect of feeding duration on LSA based on duration-moderator analysis. (L) The effect of initial body weight on LSA based on IBW-moderator analysis. K indicates the number of effect sizes for each level of these 3 moderators. For example, k = 29 shows 29 effect sizes are calculated for the medium dose of AMP. Here are 3 different levels for each moderator. AMP dose: low, the minimum dose of each study; high, the maximum dose of each study; medium, remaining doses of each study. IBW: small, less than 15 g; medium, from 15 to 30 g; large, above 30 g. Feeding duration: one, less than 35 d; two, from 35 to 65 d; > two, more than 65 d. AMP-less, basal diets without AMP; AMP-supplemented, diets with AMP; AMP = antimicrobial peptide; IBW = initial body weight; FCR = feed conversion ratio; SGR = specific growth rate; SOD = superoxide dismutase activity; LSA = lysozyme activity.
Fig. 4
Fig. 4
Moderator-analysis results of the effect of AMP-supplemented feeds on aquatic animal disease resistance and the abundance of gut microbiota. (A) The effect of AMP dose on CSR based on dose-moderator analysis. (B) The effect of feeding duration on CSR based on duration-moderator analysis. (C) The effect of initial body weight on CSR based on IBW-moderator analysis. (D) The effect of gene type on GENE based on gene-moderator analysis. (E) The effect of tissue on GENE based on tissue-moderator analysis. (F) The effect of time on GENE based on time-moderator analysis. (G) Caterpillar plot shows the effect of different structures on MICRO based on structure-moderator analysis. (H) The effect of fish species on MICRO based on species-moderator analysis. Each green line represents an effect size with a yellow dot (mean effect size). The red rhombus indicates the overall effect size with a mean (centre), 95% CI (left and right borders) and 95% PI (black line through the rhombus). AMP-less, basal diets without AMP; AMP-supplemented, diets with AMP. AMP = antimicrobial peptide; CSR = cumulative survival rate after pathogen infection; GENE = expression of immune-related genes; MICRO = the abundance of gut microbiota.
Fig. 5
Fig. 5
Dose effect and meta-regression analysis results for growth performance and enzyme activity. (A) The outcome of meta-regression for FCR when AMP dose is involved. The effect size of FCR vs AMP dose, and the dose-effect curve is in red. (B) The outcome of meta-regression for FCR when feeding duration is involved. (C) The outcome of meta-regression for FCR when IBW is involved. (D) The outcome of meta-regression for SGR when AMP dose is involved. The effect size of SGR vs AMP dose, and the dose-effect curve is in red. (E) The outcome of meta-regression for SGR when feeding duration is involved. (F) The outcome of meta-regression for SGR when IBW is involved. (G) The outcome of meta-regression for SOD when AMP dose is involved. The effect size of SOD vs AMP dose, and the dose-effect curve is in red (H) The outcome of meta-regression for SOD when feeding duration is involved. (I) The outcome of meta-regression for SOD when IBW is involved. (J) The outcome meta-regression for LSA when AMP dose is involved. The effect size of LSA vs AMP dose, and the dose-effect curve is in red. (K) The result from meta-regression for LSA when feeding duration is involved. (L) The result from meta-regression for LSA when IBW is involved. AMP = antimicrobial peptide; FCR = feed conversion ratio; SGR = specific growth rate; SOD = superoxide dismutase activity; LSA = lysozyme activity; IBW = initial body weight.
Fig. 6
Fig. 6
The effect of waters (marine or freshwater), living habitats (warm or cold water) and diets (carnivorous, omnivorous, herbivorous) on aquatic animal health using waters-, habitats- and diets-moderator analysis, respectively. K indicates the number of effect sizes for each level of different moderators. FCR = feed conversion ratio; SGR = specific growth rate; SOD = superoxide dismutase activity; LSA = lysozyme activity; CSR = cumulative survival rate after pathogen infection; GENE = expression of immune-related genes; MICRO = the abundance of gut microbiota; AMP = antimicrobial peptide; AMP-supplemented, diets with AMP. LRR = log response ratio. ∗, P < 0.05; ∗∗, P < 0.01; ∗∗∗, P < 0.001.

References

    1. Abdel-Wahab M.M., Taha N.M., Lebda M.A., Elfeky M.S., Abdel-Latif H.M.R. Effects of bovine lactoferrin and chitosan nanoparticles on serum biochemical indices, antioxidative enzymes, transcriptomic responses, and resistance of Nile tilapia against Aeromonas hydrophila. Fish Shellfish Immunol. 2021;111:160–169. doi: 10.1016/j.fsi.2021.01.017. - DOI - PubMed
    1. Cabello F.C. Heavy use of prophylactic antibiotics in aquaculture: a growing problem for human and animal health and for the environment. Environ Microbiol. 2006;8:1137–1144. doi: 10.1111/j.1462-2920.2006.01054.x. - DOI - PubMed
    1. Chand R.K., Sahoo P.K., Kumari J., Pillai B.R., Mishra B.K. Dietary administration of bovine lactoferrin influences the immune ability of the giant freshwater prawn Macrobrachium rosenbergii (de Man) and its resistance against Aeromonas hydrophila infection and nitrite stress. Fish Shellfish Immunol. 2006;21:119–129. doi: 10.1016/j.fsi.2005.10.010. - DOI - PubMed
    1. Chen F., Li X., Wu Y., Huang D., Guo Y., Zhang Y., et al. Influences of dietary antimicrobial peptide APSH-07 on the growth performance, immune response and vibriosis resistance of abalone Haliotis discus hannai Ino. Aquacult Nutr. 2020;26:1736–1747. doi: 10.1111/anu.13124. - DOI
    1. Chen Y.-B., Hu J., Lyu Q.-J., Liu L.-J., Wen L.-F., Yang X.-K., et al. The effects of Natucin C-Natucin P mixture on blood biochemical parameters, antioxidant activity and non-specific immune responses in tilapia (Oreochromis niloticus) Fish Shellfish Immunol. 2016;55:367–373. doi: 10.1016/j.fsi.2016.06.016. - DOI - PubMed

LinkOut - more resources