. 2023 Jan 11:13:1092242.
doi: 10.3389/fgene.2022.1092242. eCollection 2022.

Unraveling signatures of chicken genetic diversity and divergent selection in breed-specific patterns of early myogenesis, nitric oxide metabolism and post-hatch growth

Affiliations

Unraveling signatures of chicken genetic diversity and divergent selection in breed-specific patterns of early myogenesis, nitric oxide metabolism and post-hatch growth

Ivan I Kochish et al. Front Genet. .

Abstract

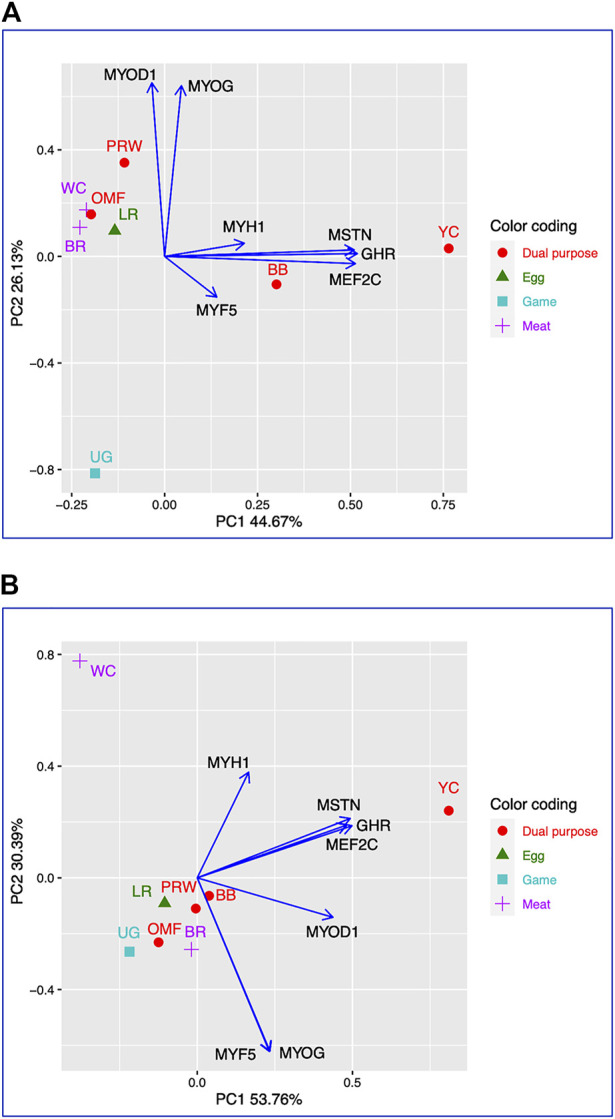
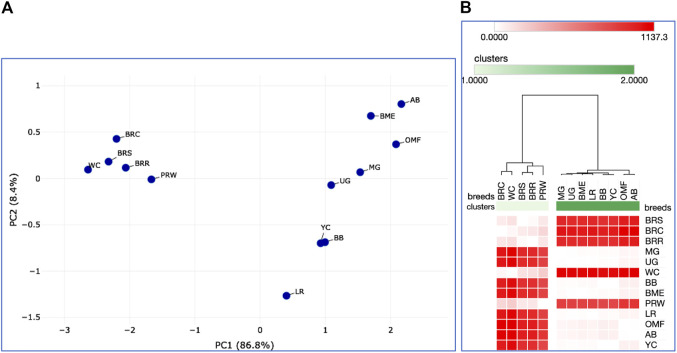
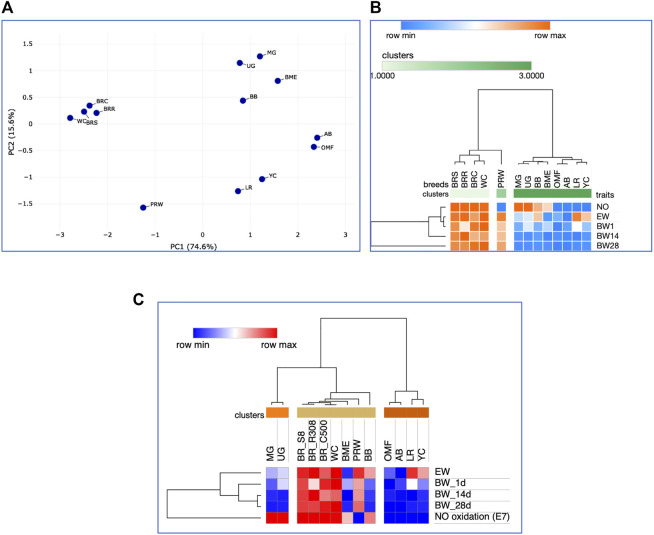
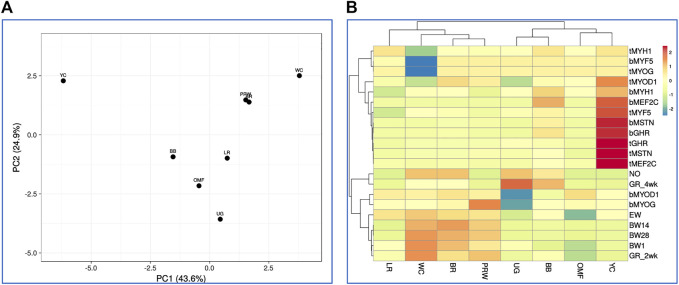
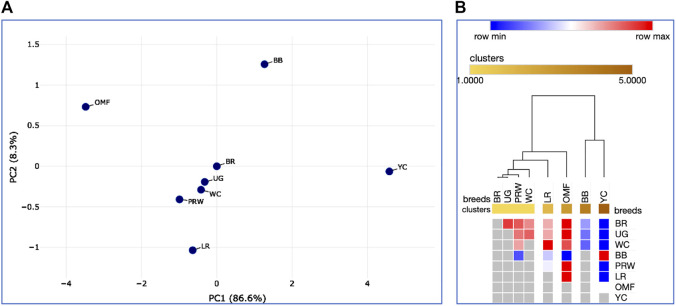
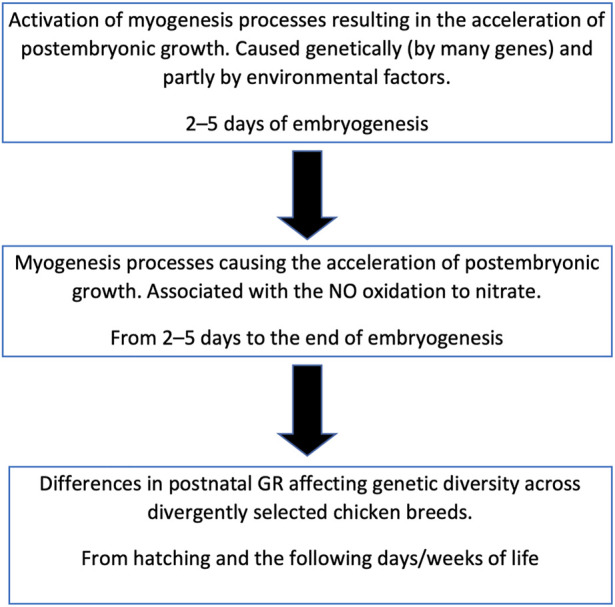
Introduction: Due to long-term domestication, breeding and divergent selection, a vast genetic diversity in poultry currently exists, with various breeds being characterized by unique phenotypic and genetic features. Assuming that differences between chicken breeds divergently selected for economically and culturally important traits manifest as early as possible in development and growth stages, we aimed to explore breed-specific patterns and interrelations of embryo myogenesis, nitric oxide (NO) metabolism and post-hatch growth rate (GR). Methods: These characteristics were explored in eight breeds of different utility types (meat-type, dual purpose, egg-type, game, and fancy) by incubating 70 fertile eggs per breed. To screen the differential expression of seven key myogenesis associated genes (MSTN, GHR, MEF2C, MYOD1, MYOG, MYH1, and MYF5), quantitative real-time PCR was used. Results: We found that myogenesis associated genes expressed in the breast and thigh muscles in a coordinated manner showing breed specificity as a genetic diversity signature among the breeds studied. Notably, coordinated ("accord") expression patterns of MSTN, GHR, and MEFC2 were observed both in the breast and thigh muscles. Also, associated expression vectors were identified for MYOG and MYOD1 in the breast muscles and for MYOG and MYF5 genes in the thigh muscles. Indices of NO oxidation and post-hatch growth were generally concordant with utility types of breeds, with meat-types breeds demonstrating higher NO oxidation levels and greater GR values as compared to egg-type, dual purpose, game and fancy breeds. Discussion: The results of this study suggest that differences in early myogenesis, NO metabolism and post-hatch growth are breed-specific; they appropriately reflect genetic diversity and accurately capture the evolutionary history of divergently selected chicken breeds.

Keywords: breeds; chicken; differential gene expression; divergent selection; early myogenesis; genetic diversity; nitric oxide oxidation; post-hatch growth.


Conflict of interest statement

Author EB was employed by the company BIOTROF+ Ltd. The remaining authors declare that the research was conducted in the absence of any commercial or financial relationships that could be construed as a potential conflict of interest.

Figures

FIGURE 1
FIGURE 1
PCA plots generated using the ggplot2 library for the DGE Type I data for the seven genes in the breast (A) and thigh (B) muscles in the eight breeds studied. X and Y-axes show principal component 1 (PC1) and principal component 2 (PC2) that explain 44.7% and 26.1% (A), and 53.8% and 30.4% (B) of the total variance, respectively. N = 8 data points (breeds).
FIGURE 2
FIGURE 2
PCA plots generated using the ClustVis tool (Metsalu and Vilo, 2015) and the Type IIIa (A) and IIIb (B) datasets as inferred for the eight studied breeds and seven tested myogenesis associated genes expressed in the breast muscles. X and Y-axes show principal component 1 (PC1) and principal component 2 (PC2) that explain 64.9% and 31.2% (A), and 62.0% and 30.1% (B) of the total variance, respectively. N = 8 data points (breeds).
FIGURE 3
FIGURE 3
PCA plots generated using the Phantasus tool (Zenkova et al., 2018) and the data Type IIIa (A,C) and IIIb (B,D) as inferred for the eight studied breeds and seven tested myogenesis associated genes expressed in the breast (A,B) and thigh (C,D) muscles. X and Y-axes show principal component 1 (PC1) and principal component 2 (PC2) that explain respective percentage values of the total variance. N = 8 data points (breeds).
FIGURE 4
FIGURE 4
Heatmaps and hierarchical clustering trees based on Euclidean distance metric (with the average option selected for the linkage method) and using the Type IIIa (A) and IIIb (B) data as inferred for the eight studied breeds and seven tested myogenesis associated genes expressed in the breast muscles.
FIGURE 5
FIGURE 5
Heatmaps and hierarchical clustering trees based on Euclidean distance metric (with the average option selected for the linkage method) and using the Type IIIa (A,C) and IIIb (B,D) data as inferred for the eight studied breeds and seven tested myogenesis associated genes expressed in the breast muscles. For constructing the trees, precomputed similarity matrices were built using Euclidean distance (A,B) and Pearson correlation (C,D) as metrics.
FIGURE 6
FIGURE 6
Analysis of the distribution of 13 breeds by early growth traits, including EW and BW of chicks at three ages, as generated in the Phantasus program (Zenkova et al., 2018). (A) PCA plot. X and Y-axes show principal component 1 (PC1) and principal component 2 (PC2) that explain 86.8% and 8.4% of the total variance, respectively. N = 13 data points (breeds). (B) Heatmap and hierarchical clustering tree using Euclidean distance-based similarity matrix. For clustering, matrix values (for a precomputed distance matrix) were applied as metrics (with the average linkage method option selected).
FIGURE 7
FIGURE 7
Analysis of the distribution of 13 the breeds by traits of E7 NO oxidation and postnatal growth, including EW and BW of chicks at three ages, performed in the Phantasus program (Zenkova et al., 2018). (A) PCA plot. X and Y-axes show principal component 1 (PC1) and principal component 2 (PC2) that explain 74.6% and 15.6% of the total variance, respectively. N = 13 data points (breeds). (B) Heatmap and hierarchical clustering tree based on Euclidean distance metric (with the average option selected for the linkage method). (C) Heatmap and hierarchical clustering tree using one minus Pearson’s correlation metric (with the average option as linkage method).
FIGURE 8
FIGURE 8
Distribution of the eight breeds based on the analysis of relationships between 21 traits (DGE of myogenesis associated genes and NO metabolism in embryos, as well as indicators of early chick growth) as performed in the ClustVis program (Metsalu and Vilo, 2015). (A) PCA plot. Unit variance scaling was applied to rows; singular value decomposition with imputation was used to calculate principal components. X and Y-axes show principal component 1 (PC1) and principal component 2 (PC2) that explain 43.6% and 24.9% of the total variance, respectively. N = 8 data points (breeds). (B) Heatmap and clustering trees using Euclidean distances (with the average option selected as linkage method).
FIGURE 9
FIGURE 9
Analysis of the distribution of the eight breeds for 21 traits (DGE of myogenesis associated genes and NO metabolism in embryos, as well as indicators of early chick growth) performed in the Phantasus program (Zenkova et al., 2018). (A) PCA plot. X and Y-axes show principal component 1 (PC1) and principal component 2 (PC2) that explain 86.6% and 8.3% of the total variance, respectively. N = 8 data points (breeds). (B) Heatmap and hierarchical clustering tree based on Euclidean distance metric (with the average option as linkage method).
FIGURE 10
FIGURE 10
Scheme of relationship between the embryonic myogenesis processes, postnatal growth and genetic diversity in chicken breeds.

References

    1. Abdelmanova A. S., Dotsev A. V., Romanov M. N., Stanishevskaya O. I., Gladyr E. A., Rodionov A. N., et al. (2021). Unveiling comparative genomic trajectories of selection and key candidate genes in egg-type Russian White and meat-type White Cornish chickens. Biology 10 (9), 876. 10.3390/biology10090876 - DOI - PMC - PubMed
    1. Anderson J. E. (2000). A role for nitric oxide in muscle repair: Nitric oxide–mediated activation of muscle satellite cells. Mol. Biol. Cell. 11 (5), 1859–1874. 10.1091/mbc.11.5.1859 - DOI - PMC - PubMed
    1. Auradé F., Pinset C., Chafey P., Gros F., Montarras D. (1994). Myf5, MyoD, myogenin and MRF4 myogenic derivatives of the embryonic mesenchymal cell line C3H10T1/2 exhibit the same adult muscle phenotype. Differentiation 55 (3), 185–192. 10.1046/j.1432-0436.1994.5530185.x - DOI - PubMed
    1. Bernini F., Bagnato A., Marelli S. P., Zaniboni L., Cerolini S., Strillacci M. G. (2021). Genetic diversity and identification of homozygosity-rich genomic regions in seven Italian heritage Turkey (Meleagris gallopavo) breeds. Genes. 12 (9), 1342. 10.3390/genes12091342 - DOI - PMC - PubMed
    1. Bhalla U. S., Iyengar R. (1999). Emergent properties of networks of biological signaling pathways. Science 283 (5400), 381–387. 10.1126/science.283.5400.381 - DOI - PubMed