. 2022 Dec 28;2(1):pgac300.
doi: 10.1093/pnasnexus/pgac300. eCollection 2023 Jan.

Development of an in-vitro high-throughput screening system to identify modulators of genitalia development

Affiliations

Development of an in-vitro high-throughput screening system to identify modulators of genitalia development

Yan Yin et al. PNAS Nexus. .

Erratum in

Abstract

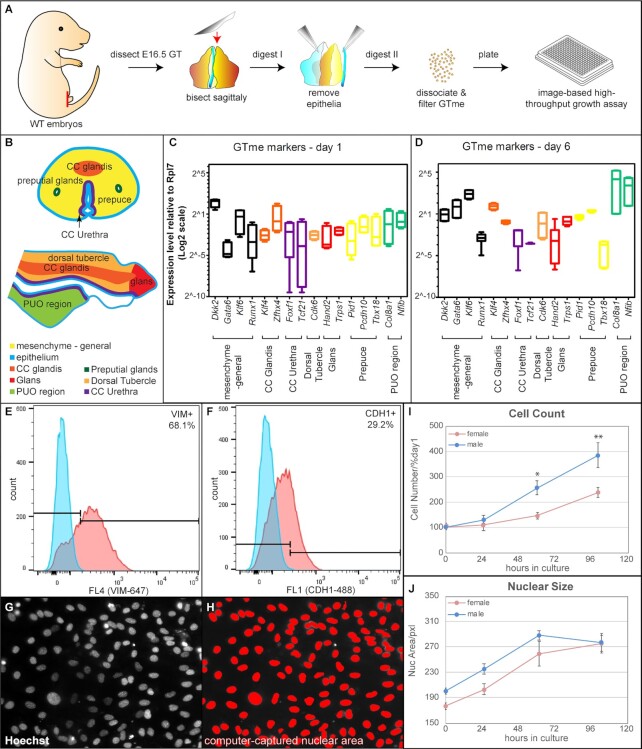
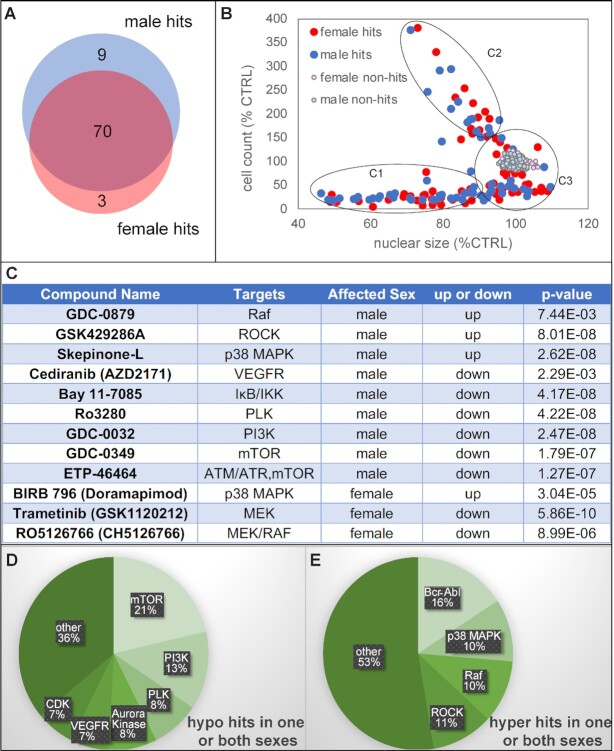
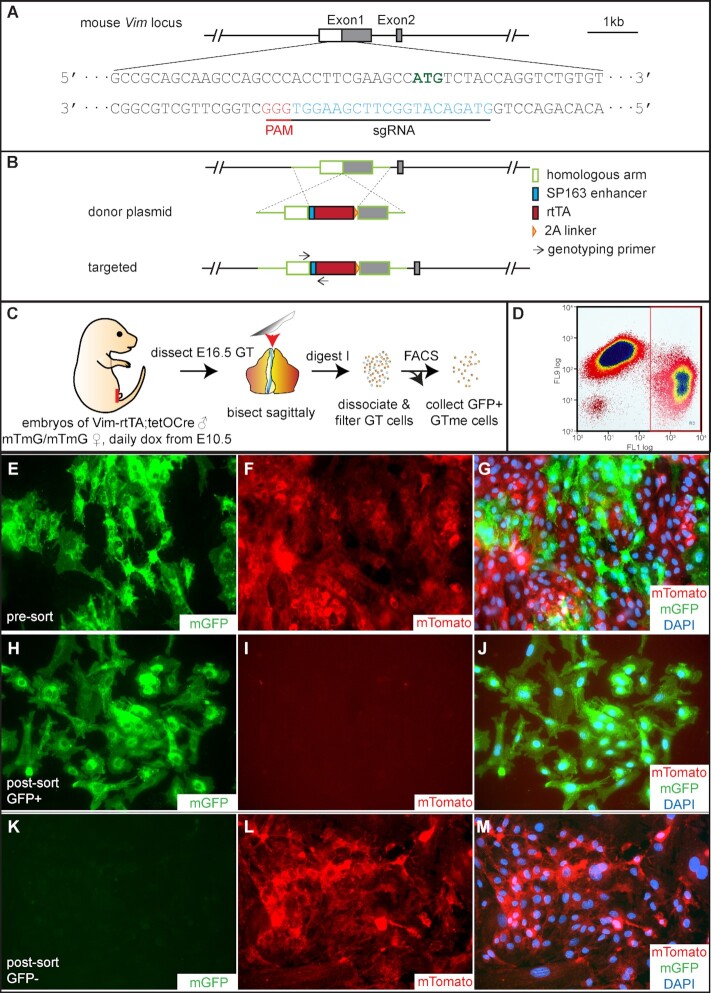
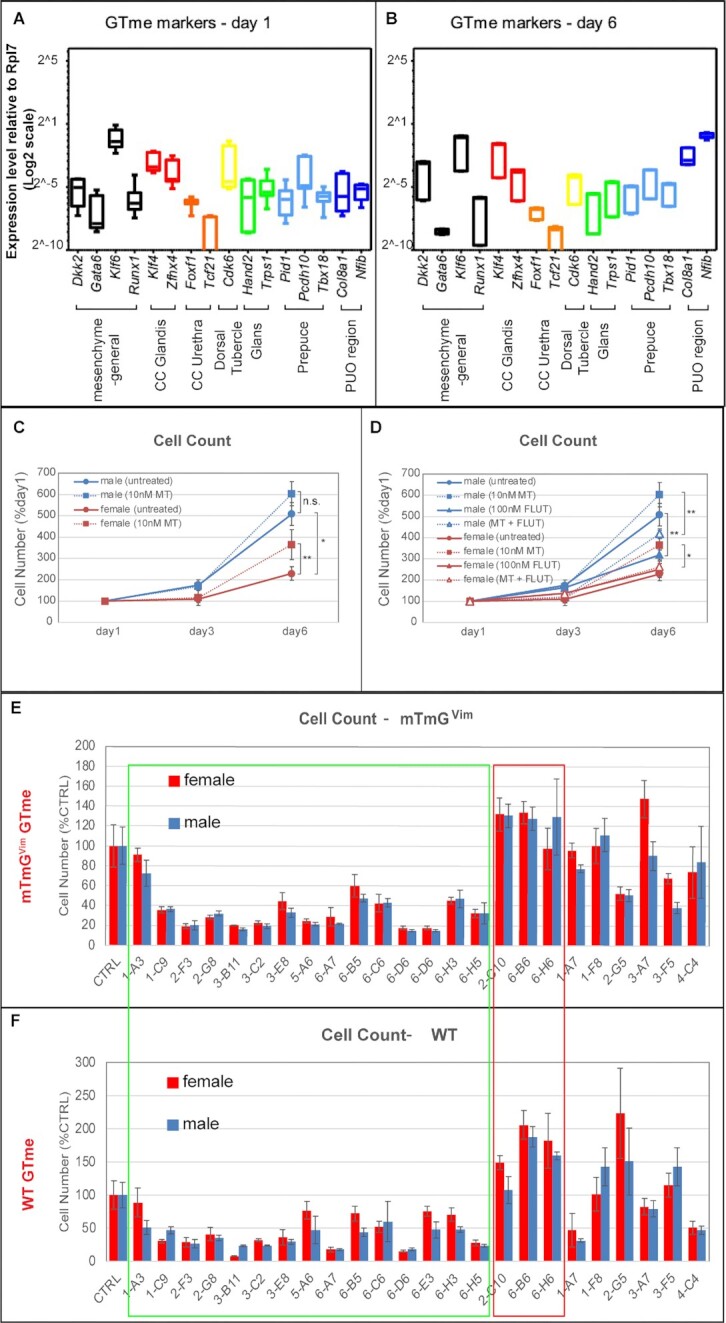
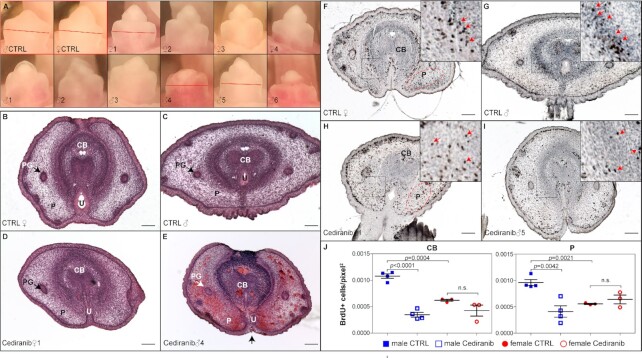
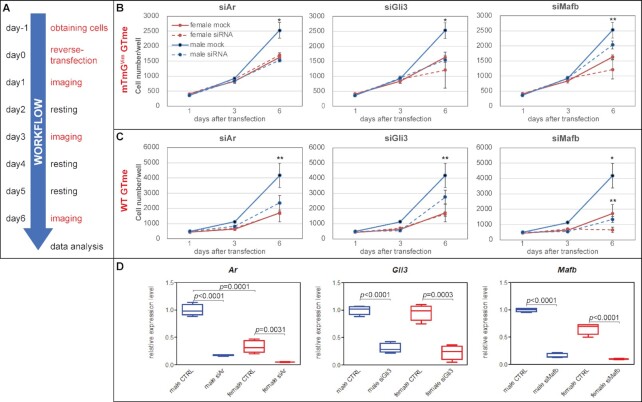
Sexually dimorphic outgrowth and differentiation of the embryonic genital tubercles (GTs) give rise to the penis in males and the clitoris in females. Defects in androgen production or in response to androgen signaling can lead to various congenital penile anomalies in both mice and humans. Due to lack of a high-throughput screening system, identification of crucial regulators of GT sexual differentiation has been slow. To overcome this research barrier, we isolated embryonic GT mesenchymal (GTme) cells to model genitalia growth and differentiation in vitro. Using either a mechanical or fluorescence-activated cell sorting-assisted purification method, GTme cells were isolated and assayed for their proliferation using a microscopy and image analysis system, on a single cell level over time. Male and female GTme cells inherently exhibit different cellular dynamics, consistent with their in-vivo behaviors. This system allows for the rapid quantitative analyses of numerous drug treatments, and enables the discovery of potential genetic modulators of GT morphogenesis on a large scale. Using this system, we completed a 438-compound library screen and identified 82 kinase inhibitor hits. In mice, in-utero exposure to one such candidate kinase inhibitor, Cediranib, resulted in embryos with severe genitalia defects, especially in males. Gene silencing by RNAi was optimized in this system, laying the foundation for future larger-scale genetic screenings. These findings demonstrate the power of this novel high-throughput system to rapidly and successfully identify modulators of genitalia growth and differentiation, expanding the toolbox for the study of functional genomics and environmental factors.

Keywords: VEGFR; external genitalia; genital tubercle mesenchyme; high-throughput screening; proliferation.


Figures

Fig. 1.
Fig. 1.
Isolation and in-vitro proliferation of WT GTme cells. (A) Schematic illustration of the GTme isolation process from WT embryos. (B) Transverse and sagittal diagrams of the subpopulations of E16.5 GT (adapted from Armfield and Cohn). (C and D) Gene expression of mesenchymal and subpopulation markers in GTme cells after 1 day (C) and 6 days (D) in culture, assayed by real-time RT-PCR. (E and F) Representative histograms of the FACS of isolated GTme cells stained with antibodies against mesenchymal marker VIM (E) and epithelial marker cadherin1 (CDH1, F), respectively; blue, isotype control; red, antibody-stained. (G and H) Fluorescence microscopic image of Hoechst-stained GTme nuclei (G) was analyzed by IN Cell Developer to computationally capture individual nucleus for accurate counting and measuring (H). (I) Growth curves and (J) average nuclear size curves of GTme cells in culture. *< 0.05; **< 0.01.
Fig. 2.
Fig. 2.
Identification of kinase inhibitors that affect GTme growth in vitro. (A) Venn diagram of the 82 hits. (B) Scatterplot of all CPDs on cell count vs. nuclear size categorizing all hits into three groups (C1, C2, and C3). (C) List of hits that exhibited a sex-dimorphic response in GTme proliferation. (D and E) Functional clusters of hypo and hyperhits.
Fig. 3.
Fig. 3.
Generation of Vim-rtTA mouse and isolation of mTmGVim GTme cells. (A) Location and sequence of sgRNA in relation to the mouse Vim genomic locus. (B) Schematics of donor plasmid design, homologous recombination event, and targeted Vim allele. (C) Schematic illustration of the GTme isolation process from mTmGVim embryos. (D) Representative FACS dot plot showing separation of green GFP+ (FL1) and red Tomato+ (FL9) populations. (E to M) Fluorescence microscopy of GTme cells before (E to G) and after sorting (H to J, gated for GFP; I to M, gated for Tomato). Cells were allowed to attach to cover glass in culture before imaging.
Fig. 4.
Fig. 4.
Characterization and in-vitro proliferation of mTmGVim GTme cells. (A and B) Gene expression of mesenchymal and subpopulation markers in mTmGVim GTme cells after 1 day (A) and 6 days (B) in culture, by real-time RT-PCR. (C and D) Growth curves of mTmGVim GTme cells, with or without treatment of MT and/or FLUT. *< 0.05; **< 0.01. (D and E) Comparison of 24 kinase inhibitor hits on proliferation of mTmGVim (D) and WT GTme cells (E). Green box outlines hypohits with similar responses in both cell lines and red box outlines hyperhits with similar results.
Fig. 5.
Fig. 5.
Adverse effect of Cediranib on male GT development in vivo. (A) Gross morphology of control E17.5 GTs (red outline), and that of a litter of 10 pups treated daily with Cediranib from E14.5 to E16.5. Red lines indicate planes of sections shown in B to I. (B to E) H&E staining of transverse sections of control- and Cediranib-treated E17.5 GT. PG, preputial glands; P, prepuce; U, urethra. (F to I) BrdU staining of transverse sections of control- and Cediranib-treated GT. Insets showed magnified view of boxed areas. Red arrows point to BrdU+ cells. (J) Quantification of BrdU+ cells per unit area in corpus body (white-dotted regions in F and H) and prepuce (red-dotted regions in F an H). CB, CTRL male 0.001079 ± 4.346e-005, N = 4 vs. Cediranib male 0.0003480 ± 4.444e-005, N = 4, < 0.0001; CTRL female 0.0006211 ± 2.044e-005 N = 3, vs. Cediranib female 0.0004279 ± 0.0001056, N = 3, = 0.1467; P, CTRL male 0.0009609 ± 5.790e-005 vs. Cediranib male 0.0004110 ± 0.0001081, N = 4, = 0.0042; CTRL female 0.0009609 ± 5.790e-005, N = 4 vs. Cediranib female 0.0005567 ± 1.158e-005, N = 3, = 0.14.
Fig. 6.
Fig. 6.
siRNA silencing of genes critical to GTme growth. (A) Experimental design for gene silencing and proliferation assay in isolated GTme cells. (B and C) Growth curves of GTme cells reverse-transfected with siRNA against Ar, Gli3, and Mafb. *< 0.01, siRNA vs. mock of same sex; **< 0.05. (D) Real-time qPCR confirming efficient knockdowns of respective genes. Note the sex-dimorphic expression of Ar in the control GTme cells (male 0.9987 ± 0.0526 vs. female 0.3290 ± 0.0568, N = 4, = 0.0001).

References

    1. Cohn MJ. 2011. Development of the external genitalia: conserved and divergent mechanisms of appendage patterning. Dev Dyn. 240:1108–1115. - PMC - PubMed
    1. Perriton CL, Powles N, Chiang C, Maconochie MK, Cohn MJ. 2002. Sonic hedgehog signaling from the urethral epithelium controls external genital development. Dev Biol. 247:26–46. - PubMed
    1. Haraguchi R, et al. 2001. Unique functions of Sonic hedgehog signaling during external genitalia development. Development. 128:4241–4250. - PubMed
    1. Satoh Y, et al. 2004. Regulation of external genitalia development by concerted actions of FGF ligands and FGF receptors. Anat Embryol (Berl). 208:479–486. - PubMed
    1. Miyagawa S, et al. 2009. Dosage-dependent hedgehog signals integrated with wnt/beta-catenin signaling regulate external genitalia formation as an appendicular program. Development. 136:3969–3978. - PMC - PubMed