. 2023 Jan 11;2(1):pgac291.
doi: 10.1093/pnasnexus/pgac291. eCollection 2023 Jan.

Customizable, reconfigurable, and anatomically coordinated large-area, high-density electromyography from drawn-on-skin electrode arrays

Affiliations

Customizable, reconfigurable, and anatomically coordinated large-area, high-density electromyography from drawn-on-skin electrode arrays

Faheem Ershad et al. PNAS Nexus. .

Erratum in

Abstract

Accurate anatomical matching for patient-specific electromyographic (EMG) mapping is crucial yet technically challenging in various medical disciplines. The fixed electrode construction of multielectrode arrays (MEAs) makes it nearly impossible to match an individual's unique muscle anatomy. This mismatch between the MEAs and target muscles leads to missing relevant muscle activity, highly redundant data, complicated electrode placement optimization, and inaccuracies in classification algorithms. Here, we present customizable and reconfigurable drawn-on-skin (DoS) MEAs as the first demonstration of high-density EMG mapping from in situ-fabricated electrodes with tunable configurations adapted to subject-specific muscle anatomy. The DoS MEAs show uniform electrical properties and can map EMG activity with high fidelity under skin deformation-induced motion, which stems from the unique and robust skin-electrode interface. They can be used to localize innervation zones (IZs), detect motor unit propagation, and capture EMG signals with consistent quality during large muscle movements. Reconfiguring the electrode arrangement of DoS MEAs to match and extend the coverage of the forearm flexors enables localization of the muscle activity and prevents missed information such as IZs. In addition, DoS MEAs customized to the specific anatomy of subjects produce highly informative data, leading to accurate finger gesture detection and prosthetic control compared with conventional technology.


Figures

Fig. 1.
Fig. 1.
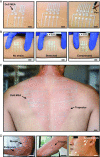
DoS electronics are configured as high-density, muscle-specific MEAs. (A) DoS MEA drawing process showing customized positions of electrodes and interconnects being fabricated (left to right) directly on the skin with a ballpen and DoS Ag-PEDOT:PSS ink (scale bar = 5 mm). (B) Deformability of DoS MEAs on skin when at 0% strain (left), 10% stretching, and 10% compressing (scale bar = 1 cm). (C) Large-area, high-density DoS MEA and interconnection pattern on the trapezius muscle of a human subject (scale bar = 1 cm). (D) DoS MEAs customized to the biceps brachii and forearm muscles (left, scale bar = 5 cm), triceps brachii (middle, scale bar = 5 cm), and facial muscles, including the zygomaticus and risorius muscles (right, scale bar = 2 cm).
Fig. 2.
Fig. 2.
DoS MEA SEI characterization. (A) Photograph of the DoS MEA fabricated on the forearm of a subject in a 3 × 5 (row × column) array, 3 mm electrode diameter, and 5 mm interelectrode spacing (scale bar = 2 cm). (B) The average normalized SEI over time from all subjects at EMG relevant frequencies after drawing all electrodes of the DoS MEAs. Data are presented as mean ± SD. (C) Average normalized SEI spectrum from all subjects after adding additional electrodes to the DoS MEAs at 0, 20, and 40 min. Data are presented as mean ± SD. (D) Images of the DoS MEA (top), stretchable Au MEA (middle), and PEDOT: PSS (bottom) on the forearms of subjects. The labeling of “A to D” and “1 to 3” in the DoS MEA camera image indicates the rows and columns which correspond to the heatmaps (scale bar = 5 mm). (E) Average SEI heatmaps from each of the three MEAs at different measurement frequencies (50, 250, and 500 Hz). (F) EMG data recorded with three flexions of the flexor group of muscles in the forearm using the DoS MEA. The initial flexion was done without any skin deformation to the MEA. The following two flexions were performed with skin deformation, first stretching the skin around the edge of the DoS MEA and then compressing the skin.
Fig. 3.
Fig. 3.
High-density DoS MEA usage for muscle activity assessments. (A) High-density DoS MEA on the flexor muscle group of a subject, inset shows the orientation of the layout (“A to D” for rows and “1 to 8” for columns, scale bar = 1 cm) for motor unit propagation mapping and innervation zone localization (scale bar = 2 cm). (B) Propagation map of a single row of the high-density DoS MEA. The change in the inflection of the wave in the third trace from the bottom (indicated by the red star) denotes the innervation zone, and the red arrows indicate the characteristic “V” pattern indicating propagation of the MUAP in different directions from the innervation zone. (C) Complete propagation maps for the entire DoS MEA and innervation zone band indicated by the red stars connected with dotted lines. (D) Setup for DoS MEA and conventional FPC grid comparison of EMG measurement during seated resistance band bicep curls. The labeling of the rows is used to calculate average EMG signals across each of the rows of the respective MEAs for signal quality examination. (E) Signal-to-noise ratios of averaged EMG signals from each row of the DoS MEA and FPC grid during 30 min of exercise.
Fig. 4.
Fig. 4.
Reconfigurable DoS MEAs implemented with a conventional grid for muscle activity localization during hand flexions. (A) Vrms heatmaps of EMG signals acquired from DoS electrodes arranged in 8 × 2 arrays beside the FPC grid to cover the forearm in lateral and medial directions to confine the center of activity during four different hand gestures, including (1) hand closed; (2) thumb, index, middle flexion; (3) middle, ring flexion; and (4) ring, little flexion. These gestures are shown along the bottom of the whole figure. (B) Vrms heatmaps of EMG signals acquired from DoS electrodes arranged in 2 × 8 arrays beside the FPC grid to cover the forearm in proximal and distal directions. (C) Vrms heatmaps of EMG signals acquired from DoS electrodes arranged in a 4 × 8 array beside the FPC grid to cover the forearm in the distal direction.
Fig. 5.
Fig. 5.
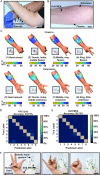
Subject-customized DoS MEAs for finger gesture classification and prosthetic hand control. (A) Custom stencils of linear eight-electrode arrays placed as four rows (to form a 4 × 8 array) around the varying circumferences (indicated by the four labeled positions) of the forearm of a subject (scale bar = 2 cm). (B) Camera image of a completed and customized DoS MEA over the flexor and extensor groups for flexion and extension-based finger gesture classification (scale bar = 2 cm). (C) Vrms feature maps of different gestures on lateral views of the forearm. (D) The confusion matrix from a linear discriminant analysis (LDA) classifier after offline analysis of EMG data obtained with two FPC grids having 128 channels. These grids only covered a portion of the circumference of the forearm. The numbers on the axes correspond to the labels in the feature maps above. (E) Confusion matrix from a LDA classifier after offline analysis of EMG data obtained with DoS MEAs having 32 channels. The DoS MEAs covered the entire circumference of the forearm. The numbers on the axes correspond to the labels in the feature maps above. (F) Near real-time control of a prosthetic hand by a human subject wearing the customized DoS MEA to mimic ring, little flexion (left, scale bar = 5 cm); thumb, index, middle flexion (middle, scale bar = 5 cm); and hand closed (right, scale bar = 5 cm).

Similar articles

Cited by

References

    1. Milosevic B, Benatti S, Farella E. 2017. Design challenges for wearable EMG applications. Des Aut Test Europe. 2017:1432–1437.
    1. Drost G, Stegeman DF, van Engelen BG, Zwarts MJ. 2006. Clinical applications of high-density surface EMG: a systematic review. J Electromyogr Kines. 16:586–602. - PubMed
    1. Afsharipour B, Soedirdjo S, Merletti R. 2019. Two-dimensional surface EMG: the effects of electrode size, interelectrode distance and image truncation. Biomed Signal Proces. 49:298–307.
    1. Vigotsky AD, Halperin I, Lehman GJ, Trajano GS, Vieira TM. 2017. Interpreting signal amplitudes in surface electromyography studies in sport and rehabilitation sciences. Front Physiol. 8:985. - PMC - PubMed
    1. Jahanmiri-Nezhad F, Barkhaus PE, Rymer WZ, Zhou P. 2015. Innervation zones of fasciculating motor units: observations by a linear electrode array. Front Hum Neurosci. 9:239. - PMC - PubMed