. 2022 Dec 9;2(1):pgac290.
doi: 10.1093/pnasnexus/pgac290. eCollection 2023 Jan.

2,3,7,8-Tetrachlorodibenzo-p-dioxin induces multigenerational alterations in the expression of microRNA in the thymus through epigenetic modifications

Affiliations

2,3,7,8-Tetrachlorodibenzo-p-dioxin induces multigenerational alterations in the expression of microRNA in the thymus through epigenetic modifications

Narendra P Singh et al. PNAS Nexus. .

Erratum in

Abstract

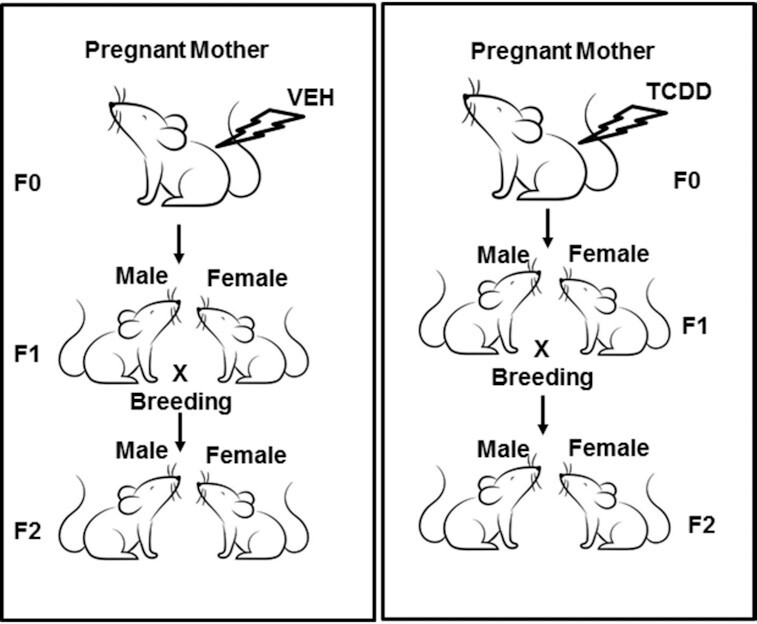
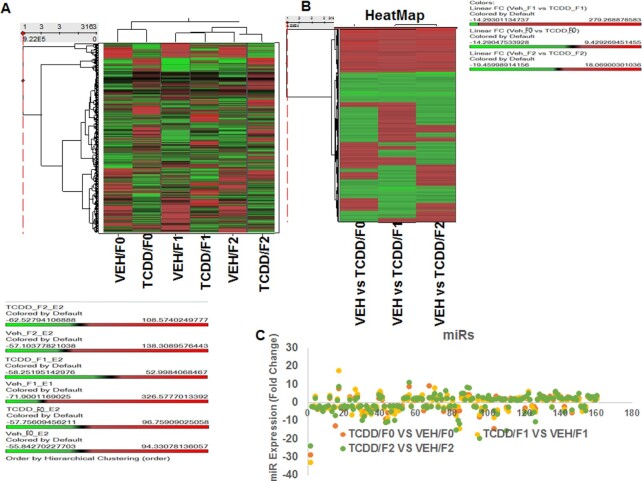
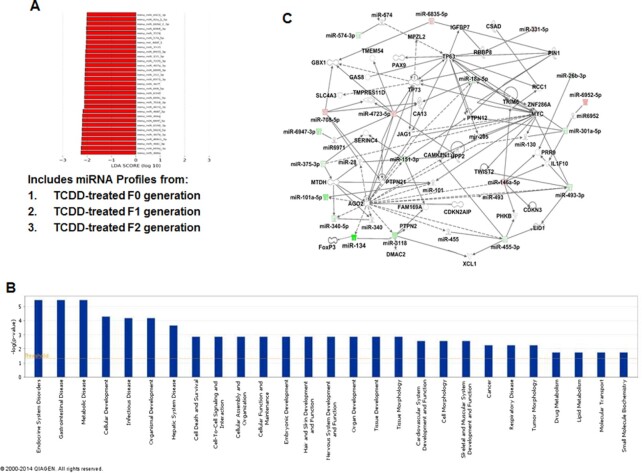
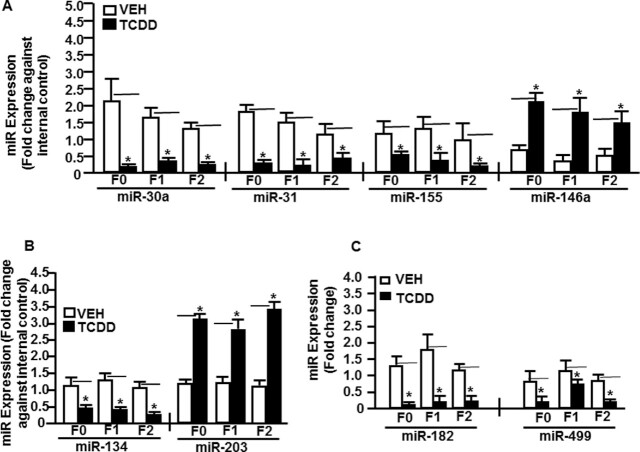
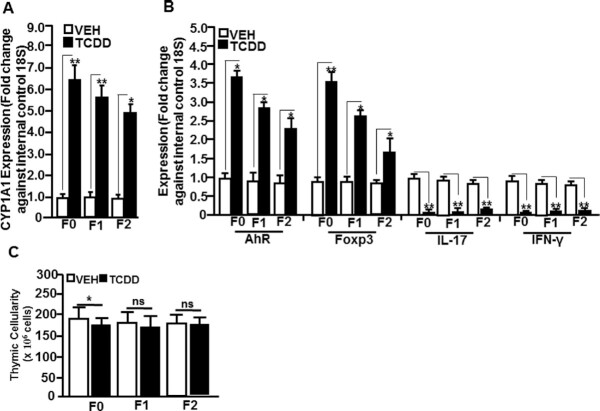
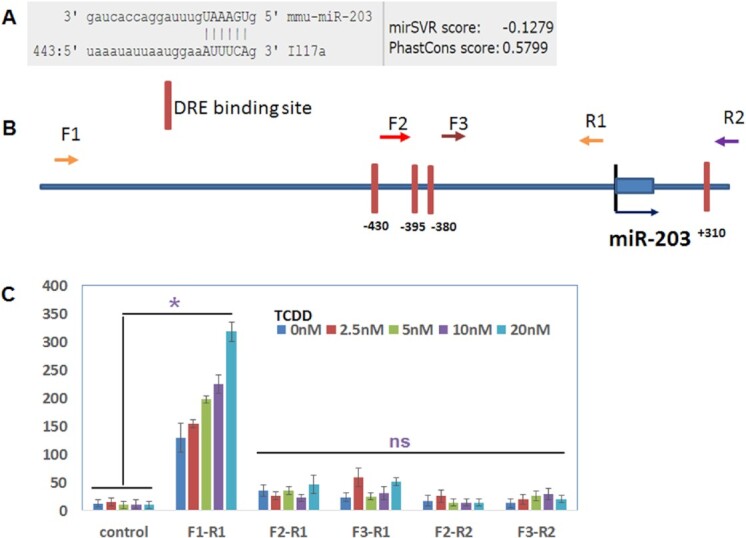
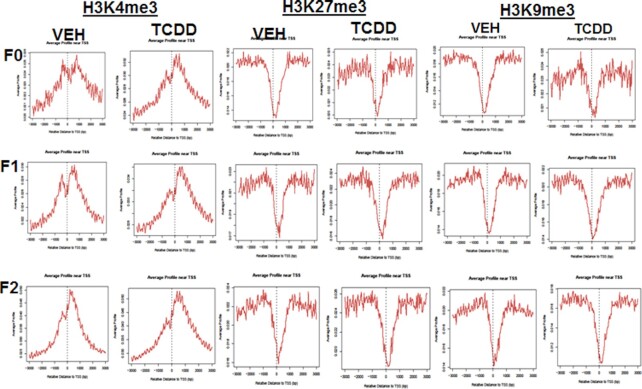
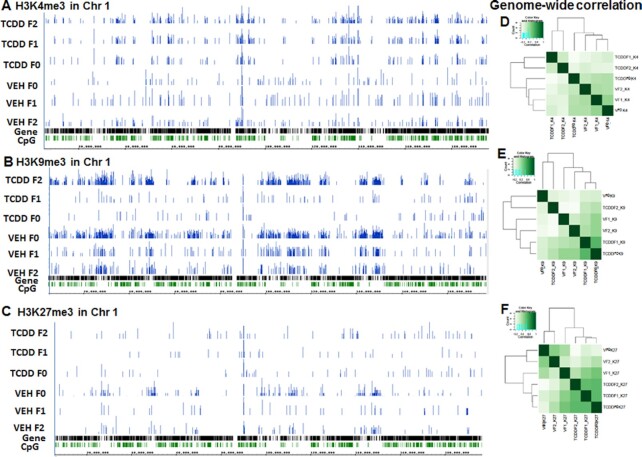
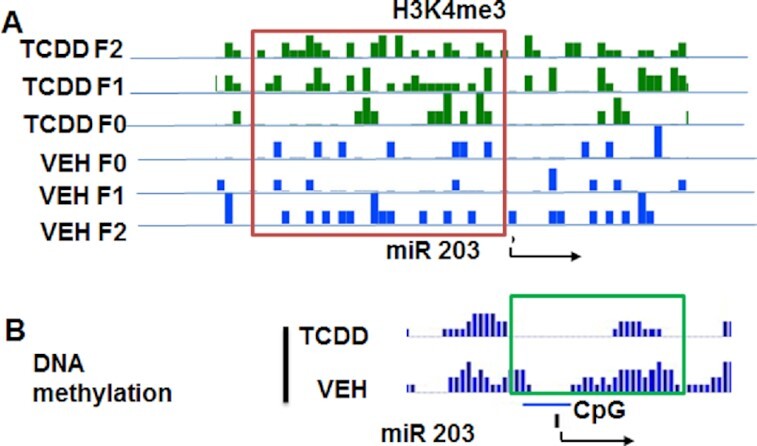
2,3,7,8-Tetrachlorodibenzo-p-dioxin (TCDD), a potent AhR ligand, is an environmental contaminant that is known for mediating toxicity across generations. However, whether TCDD can induce multigenerational changes in the expression of microRNAs (miRs) has not been previously studied. In the current study, we investigated the effect of administration of TCDD in pregnant mice (F0) on gestational day 14, on the expression of miRs in the thymus of F0 and subsequent generations (F1 and F2). Of the 3200 miRs screened, 160 miRs were dysregulated similarly in F0, F1, and F2 generations, while 46 miRs were differentially altered in F0 to F2 generations. Pathway analysis revealed that the changes in miR signature profile mediated by TCDD affected the genes that regulate cell signaling, apoptosis, thymic atrophy, cancer, immunosuppression, and other physiological pathways. A significant number of miRs that showed altered expression exhibited dioxin response elements (DRE) on their promoters. Focusing on one such miR, namely miR-203 that expressed DREs and was induced across F0 to F2 by TCDD, promoter analysis showed that one of the DREs expressed by miR-203 was functional to TCDD-mediated upregulation. Also, the histone methylation status of H3K4me3 in the miR-203 promoter was significantly increased near the transcriptional start site in TCDD-treated thymocytes across F0 to F2 generations. Genome-wide chromatin immunoprecipitation sequencing study suggested that TCDD may cause alterations in histone methylation in certain genes across the three generations. Together, the current study demonstrates that gestational exposure to TCDD can alter the expression of miRs in F0 through direct activation of DREs as well as across F0, F1, and F2 generations through epigenetic pathways.

Keywords: TCDD; epigenetics; histone; microRNA; multigenerational.


Figures

Fig. 1.
Fig. 1.
Showing a graphical sketch of the breeding protocol after gestational exposure to TCDD or vehicle control.
Fig. 2.
Fig. 2.
Showing analysis of thymic miRs of F0, F1, and F2 generations exposed to VEH or TCDD. Total miRs from groups of five pooled mouse thymi of F0, F1, and F2 generations of control or TCDD groups were analyzed. (A) Heat map depicting miR expression in thymi of VEH- or TCDD-exposed F0, F1, and F2 generations. The spectrum of downregulated to the upregulated expression pattern of miRs expression is shown from green to red. (B) Showing fold change (>1.5) expression profile of miRs of F0, F1, and F2 generations between the two groups (VEH- or TCDD-exposed). (C) Showing upregulation or downregulation (>1.5-fold change) of miRs regulated by TCDD, when compared to miRs of VEH-treated groups.
Fig. 3.
Fig. 3.
Pathway analysis of TCDD-regulated miRs and their association with functional networks. (A) LDA of miRs in the TCDD group. TCDD group included miR profiles from TCDD-treated F0, F1, and F2 generations. LDA analysis, which was set at a threshold of 2.0 led to the identification of 31 miRs as possible biomarkers, unique to the TCDD group. (B) TCDD-mediated changes in miRs by 1.5-fold or higher were analyzed using IPA software and their database. The bars in the graph demonstrate various pathways regulated by TCDD-induced miRs. The –log (P-value) on Y-axis represents the significance of function by random chance (IPA software, Qiagen Inc.). (C) Showing miRs involved in a pathway with various functions. Pink color represents upregulated mature miRs and green color represents downregulated miRs in TCDD vs VEH-treated groups.
Fig. 4.
Fig. 4.
Validation of miRs expression in thymocytes of F0, F1, and F2 generations. Mice were treated with VEH- or TCDD as described in Fig. 1 legend from groups of five pooled mouse thymi that were analyzed by quantitative real-time PCR (qRT-PCR). Total miRs of F0, F1, and F2 generations of control or TCDD groups were analyzed. (A) Thymi exposed to VEH or TCDD of F0, F1, and F2 generations were analyzed for the expression of Th1 (IFN-γ), Th17 (IL-17), and Tregs (FoxP3)-specific miRs (miR-30a, -31, -155, and -146a). (B) Expression of CYP1A1-specific miRs (miR-134 and miR-203). (C) Expression of AhR-specific miRs (miR-182 and miR-499). SNORD96A was used as an internal control for miRs. Data are depicted as mean ± SEM of technical triplicates from pooled thymi of five mice per group. Asterisk (*) in (A) to (C) indicates statistically significant (P < 0.05) differences between the groups compared.
Fig. 5.
Fig. 5.
Determination of select miR-specific gene expression in thymocytes of F0, F1, and F2 generations of VEH- or TCDD-treated groups using qRT-PCR. (A) Thymi exposed to VEH or TCDD of F0, F1, and F2 generations were analyzed for the expression of CYP1A1 (miR-134-specific). (B) Expression of AhR (miR-182 and -499-specific), FoxP3 (miR-31-specific), IL-17 (miR-203-specific), and IFN-γ (miR-146-specific). A housekeeping gene, 18S, was used as an internal control. (C) Thymic cellularity shows data expressed as mean ± SEM of five individual mice per group. The qRT-PCR data are depicted as mean ± SEM of technical triplicates from pooled thymi of five mice per group. Asterisk (*) in panels (A) and (B) indicates statistically significant (P < 0.05) difference between the groups compared.
Fig. 6.
Fig. 6.
TCDD regulates the expression of miR-203 through DRE present in its promoter. (A) Showing binding affinity of miR-203 with IL-17 (microRNA.org). (B) Schematic diagram of the promoter and DRE sites in the promoter of miR-203. Arrows indicate the PCR primers and their relative locations (F, forward primer; R, reverse primer). (C) The PCR products generated with the combination of different forward and reverse primers were cloned into a luciferase reporter vector. Luciferase activities were measured after the addition of the indicated amounts of TCDD. The empty luciferase vector was used as the control. Data presented in panel (C) are depicted areas mean ± SEM of three technical replicates from pooled thymi of five mice per group. Asterisks (*) in panel (C) indicate a statistically significant (P < 0.05) difference between the groups compared.
Fig. 7.
Fig. 7.
Analysis of H3K4me3, H3k9me3, and H3K27me3 in TCDD-treated and VEH-treated samples. Showing signals for H3K4me3, H3K27me3, and H3K9me3 F0, F1, and F2 generations. The data presented are representative of one of the three experiments.
Fig. 8.
Fig. 8.
Analysis of H3K4me3, H3k9me3, and HK27me3 by performing chromatin immunoprecipitation sequencing (ChIP-seq). VEH- or TCDD-treated thymocyte samples from F0, F1, and F2 generations were analyzed. A representative of histones mark, H3K4me3 (A), H3k9me3 (B), and HK27me3 (C) ChIP-seq signal obtained after visualization of the sequencing data in Integrated Genome Browser (IGB) for mouse chromosome 1 are shown. The data presented depict a representative experiment out of three.
Fig. 9.
Fig. 9.
Histone methylation of H3K4me3 in the promoter of miR-203. (A) Showing the status of H3K4me3 in thymocyte samples exposed to TCDD or VEH from F0, F1, and F2 generations. (B) Showing DNA methylation status of CpG islands present in miR-203 promoter in thymocyte samples treated with TCDD or VEH. The data presented depict a representative experiment out of three.

References

    1. Gluckman PD, Cutfield W, Hofman P, Hanson MA. 2005. The fetal, neonatal, and infant environments—the long-term consequences for disease risk. Early Hum Dev. 81(1):51–59. - PubMed
    1. Gluckman PD, Hanson MA, Pinal C. 2005. The developmental origins of adult disease. Matern Child Nutr. 1(3):130–141. - PMC - PubMed
    1. Gluckman PD, Hanson MA, Spencer HG, Bateson P. 2005. Environmental influences during development and their later consequences for health and disease: implications for the interpretation of empirical studies. Proc Biol Sci. 272(1564):671–677. - PMC - PubMed
    1. Heindel JJ. 2005. The fetal basis of adult disease: role of environmental exposures—introduction. Birth Defects Res A Clin Mol Teratol. 73(3):131–132. - PubMed
    1. Heindel JJ, Levin E. 2005. Developmental origins and environmental influences—introduction. Birth Defects Res A Clin Mol Teratol. 73(7):469. - PubMed