. 2022 Dec 9;2(1):pgac288.
doi: 10.1093/pnasnexus/pgac288. eCollection 2023 Jan.

Pharmacological potentiators of the calcium signaling cascade identified by high-throughput screening

Affiliations

Pharmacological potentiators of the calcium signaling cascade identified by high-throughput screening

Michele Genovese et al. PNAS Nexus. .

Erratum in

Abstract

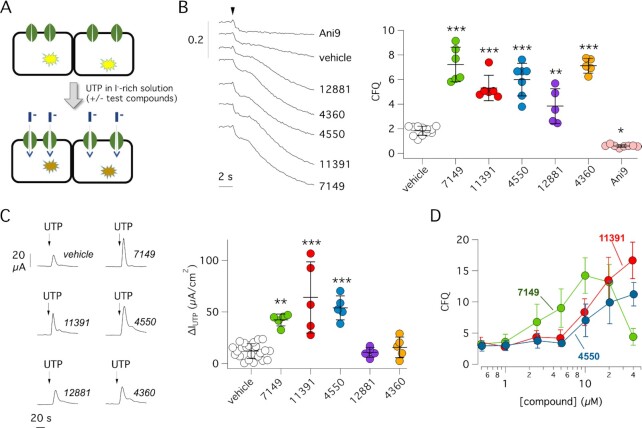
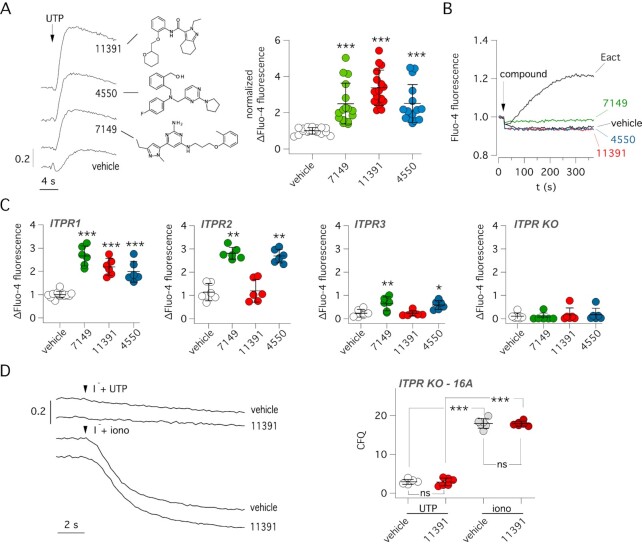
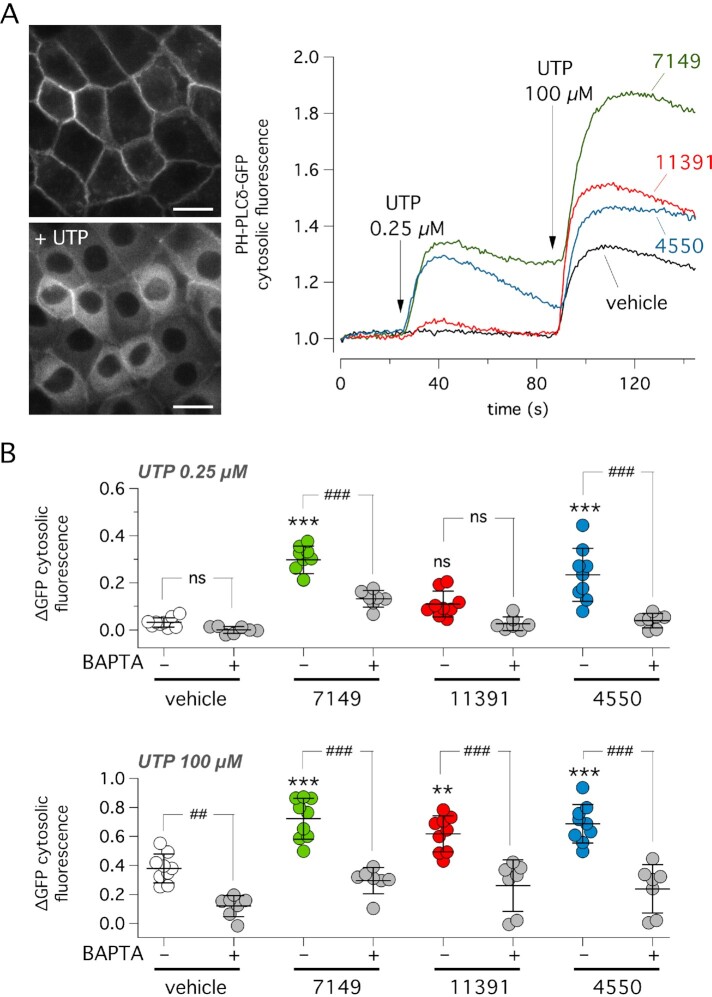
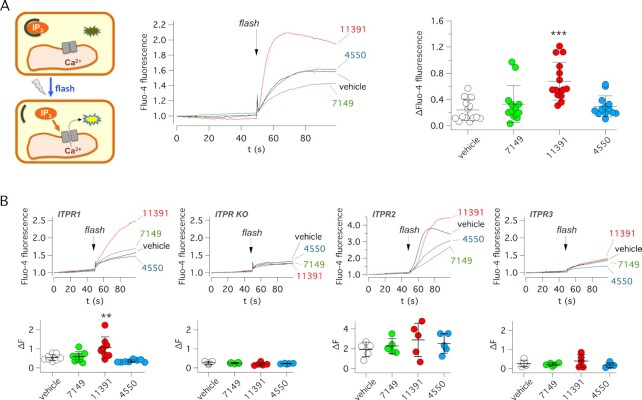
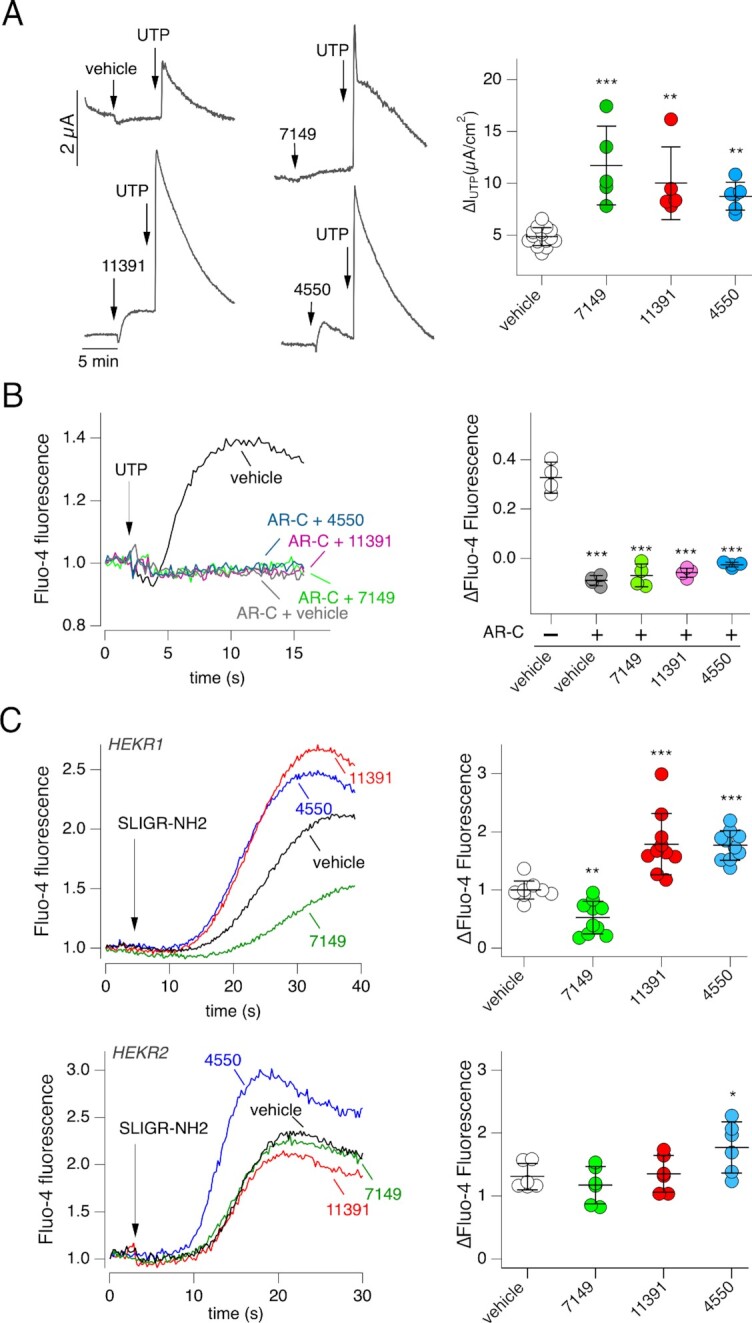
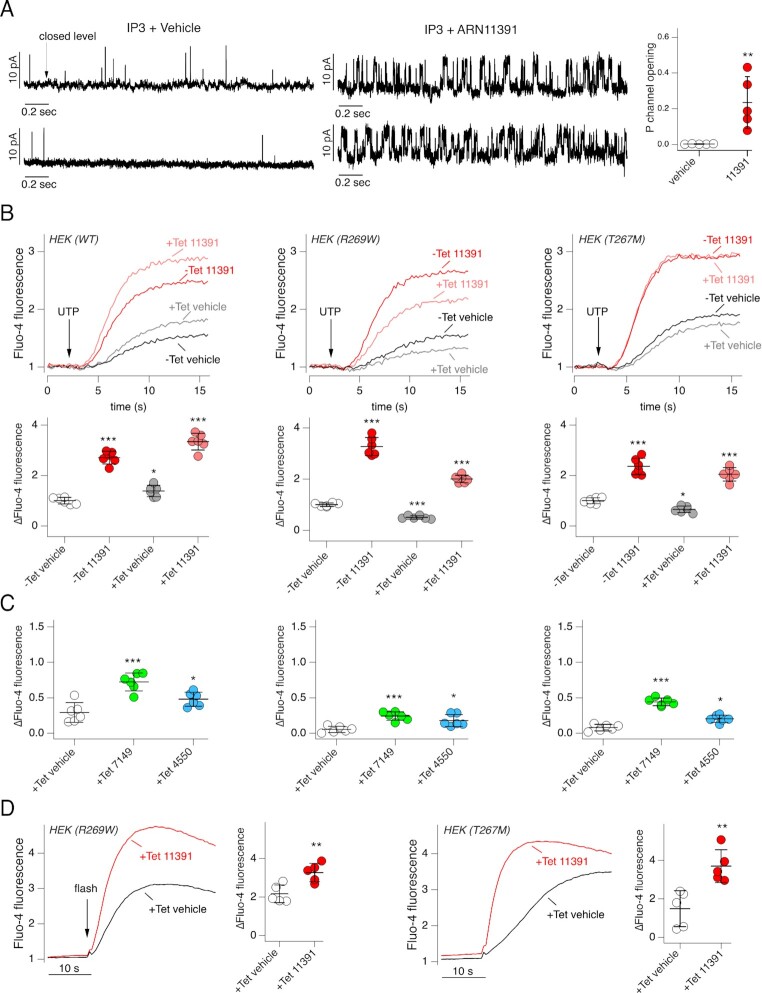
Pharmacological modulators of the Ca2+ signaling cascade are important research tools and may translate into novel therapeutic strategies for a series of human diseases. We carried out a screening of a maximally diverse chemical library using the Ca2+-sensitive Cl- channel TMEM16A as a functional readout. We found compounds that were able to potentiate UTP-dependent TMEM16A activation. Mechanism of action of these compounds was investigated by a panel of assays that looked at intracellular Ca2+ mobilization triggered by extracellular agonists or by caged-IP3 photolysis, PIP2 breakdown by phospholipase C, and ion channel activity on nuclear membrane. One compound appears as a selective potentiator of inositol triphosphate receptor type 1 (ITPR1) with a possible application for some forms of spinocerebellar ataxia. A second compound is instead a potentiator of the P2RY2 purinergic receptor, an activity that could promote fluid secretion in dry eye and chronic obstructive respiratory diseases.

Keywords: calcium signaling; high throughput screening; inositol triphosphate receptor; phospholipase C; purinergic receptor.


Figures

Fig. 1.
Fig. 1.
Identification of Ca2+ signaling cascade potentiators by high-throughput screening. (A) Scheme of the screening assay. FRT cells with co-expression of the TMEM16A Cl channel and HS-YFP were preincubated for 20 min with compounds in 96-well microplates. For the assay, the microplate reader continuously recorded cell fluorescence before and after addition of a saline solution containing I instead of Cl plus a submaximal UTP concentration (0.25 µM). TMEM16A channel activation by UTP resulted in I influx and HS-YFP quenching. Presence of an active compound in the well was detected by faster and larger quenching. (B) Detection of active compounds by HS-YFP assay. Representative traces (left) and summary of data (right) obtained for indicated compounds. The scatter dot plot reports activity as cumulative fluorescence quenching (CFQ). *P <0.05; **P <0.01; ***P <0.001 vs. vehicle (ANOVA with Dunnett’s post-hoc test). (C) Representative traces (left) and summary of data (right) from short-circuit current (Isc) recordings on FRT cells with stable expression of TMEM16A. Cells were briefly pre-incubated with indicated compounds (10 µM) or vehicle and then stimulated with 0.25 µM UTP (on the apical side) to induce TMEM16A-dependent Cl transport. The scatter dot plot reports the value of maximal UTP effect. The current activated by UTP is significantly enhanced by ARN7149, ARN11391, and ARN4550 compared to vehicle. **P <0.01; ***P <0.001 (ANOVA with Dunnett’s post-hoc test). (D) Dose-response of ARN7149, ARN11391 and ARN4550 by HS-YFP assay in FRT cells expressing TMEM16A.
Fig. 2.
Fig. 2.
Effect of active compounds on Ca2+ mobilization. (A) Left: representative traces showing effect of 0.25 µM UTP (with/without indicated compounds, 10 µM) on Fluo-4 fluorescence in null FRT cells. The chemical structures of compounds are shown. Right: summary of UTP effect on Fluo-4 fluorescence. The symbols report the normalized maximal change in fluorescence caused by UTP with vehicle or compounds (10 µM). ***, P < 0.001 vs. vehicle (ANOVA with Dunnett's post-hoc test). (B) Representative traces showing the time-course of Fluo-4 fluorescence following acute addition (arrow) of vehicle, indicated compounds from the screening (10 µM), or Eact (5 µM) as a TRPV4 agonist. (C) Summary of data obtained with the Fluo-4 assay in HEK293 cells with selective expression of ITPR1, ITPR2, ITPR3 or totally devoid of ITPR expression (ITPR KO). Ca2+ elevation was induced by UTP. *P <0.05; **P <0.01; ***P <0.001 vs. vehicle (ANOVA with Dunnett’s post-hoc test). (D) Representative traces (left) and summary of data (right) from HS-YFP assay carried out in ITPR-defective HEK293 cells transiently transfected with TMEM16A. Cells were stimulated with 5 µM UTP or 1 µM ionomycin (iono) with/without 10 µM ARN11391. ***P <0.001 (ANOVA with Tukey’s post-hoc test).
Fig. 3.
Fig. 3.
Effect of active compounds on PLC activity. (A) Representative images (left) and GFP fluorescence traces (right) showing relative changes in cytosolic GFP fluorescence in FRT cells stably expressing PH-PLCδ-GFP probe. During the assay, cells were sequentially stimulated with low (0.25 µM) and high (100 µM) UTP concentration. PLC activation, causing PIP2 breakdown, results in detachment of the probe from the plasma membrane and redistribution to the cytosol. Vehicle or indicated compounds (10 µM) were added to the cells 20 min before the assay. (B) Summary of data showing the increase in cytosolic PH-PLCδ-GFP localization elicited by the addition of UTP (0.25 µM, top; 100 µM, bottom) in presence of vehicle or compounds. Where indicated, cells were pre-incubated with the membrane-permeable BAPTA/AM to chelate cytosolic Ca2+. ***P <0.001 vs. vehicle without BAPTA. ##P <0.01; ###P <0.001 vs. indicated condition. ns: not significant (ANOVA with Tukey’s post-hoc test).
Fig. 4.
Fig. 4.
Evaluation of active compounds on ITPR function. (A) Left: scheme of IP3 uncaging experiments. Cells were loaded with ci-IP3/PM and Fluo-4. Ca2+ release from IP3 sensitive stores was elicited with a light flash. Middle: representative traces from experiments on FRT cells showing intracellular Ca2+ increase by ci-IP3 photolysis. Experiments were done in the presence of vehicle or indicated compounds (10 µM). Right: summary of data. Each symbol shows the maximal amplitude of Fluo-4 increase for indicated conditions. ***P <0.001 vs. vehicle (ANOVA with Dunnett's post-hoc test). (B) IP3 uncaging experiments in HEK293 cells with expression of a specific ITPR or totally devoid of ITPR expression (ITPR KO). Top: representative traces. Bottom: summary of data. Each symbol shows the maximal amplitude of Fluo-4 increase for indicated conditions. **P <0.01 vs. vehicle (ANOVA with Dunnett’s post-hoc test).
Fig. 5.
Fig. 5.
Mechanism of action of ARN7149. (A) Representative traces (left) and summary of data (right) from short-circuit current recordings on human cultured bronchial epithelia. Ca2+-dependent Cl secretion mediated by TMEM16A was triggered with 0.25 µM UTP on the apical side, in the presence of vehicle or indicated compounds: ARN7149 (10 µM), ARN11391 (20 µM), or ARN4550 (20 µM). To avoid the confounding effect of other channels, recordings were done in the presence of: amiloride (10 µM) to block ENaC; paxillin (10 µM) to block large conductance Ca2+-dependent K+ channels; inh-172 (10 µM, apical) to block CFTR. **P <0.01; ***P <0.001 vs. vehicle (ANOVA with Dunnett’s post-hoc test). (B) Role of P2RY2 in mediating the effect of UTP on Ca2+ mobilization. Left: representative traces showing Fluo-4 fluorescence time-course in null FRT cells following extracellular addition of UTP (0.25 µM). Cells were preincubated with/without AR-C118925XX (10 µM) antagonist ± ARN7149, ARN11391, or ARN4550. Right: summary of data. The symbols report the maximal change in Fluo-4 fluorescence. ***P <0.001 vs. experiments without AR-C118925XX (ANOVA with Dunnett’s post-hoc test). (C) Effect of compounds on Ca2+ mobilization triggered by SLIGR-NH2 (protease-activate receptor agonist) in HEKR1 (top) and HEKR2 (bottom) cells. Left: representative traces showing Fluo-4 fluorescence time-course following extracellular addition of SLIGR-NH2 (10 µM for HEKR1 and 4 µM for HEKR2). Cells were preincubated with vehicle or indicated compounds (10 µM). Right: summary of data. The symbols report the maximal change in fluorescence. *P <0.05; **P <0.01; ***P <0.001 vs. vehicle (ANOVA with Dunnett’s post-hoc test).
Fig. 6.
Fig. 6.
Mechanism of action of ARN11391. (A) Effect of ARN11391 on ITPR1 channel activity. Left: representative single-channel currents recorded in on-nucleus patch-clamp experiments from HEK293 (HEKR1) cells stably expressing ITPR1-YFP (Vp = + 40-mV). Each trace is from a separate experiment. Right: open channel probability for experiments with vehicle or ARN11391 (20 µM) in the pipette solution. **P <0.01 vs. vehicle (Student’s t-test). (B) Effect of ARN11391 on HEK293 cells with inducible (tetracycline) expression of wild type or mutant ITPR1. Top: representative traces showing changes in Fluo-4 fluorescence elicited by UTP (5 µM). Cells were preincubated with vehicle (DMSO) or ARN11391 (10 µM). Where indicated, tetracycline (Tet) was added to cells to induce IPTR1 expression. Bottom: summary of data. The symbols report the maximal change in fluorescence. *P <0.05; **P <0.01. ***P <0.001 vs. vehicle (ANOVA with Dunnett’s post-hoc test). (C) Data from Fluo-4 experiments done on HEK293 cells expressing wild type (left), R269W (middle), and T267M (right) ITPR1. Cell were previously treated with tetracycline and then stimulated with 5 µM UTP as in (B). *P <0.05; ***P <0.001 (ANOVA with Dunnett's post-hoc test). (D) IP3 uncaging experiments carried out in HEK293 cells expressing the indicated mutant ITPR1. Cells were treated with tetracycline before experiments. Uncaging was done in the presence and absence of 10 µM ARN11391. **P <0.01 (Student’s t-test).

References

    1. Berridge MJ. 2016. The inositol trisphosphate/calcium signaling pathway in health and disease. Physiol Rev.96:1261–1296. - PubMed
    1. Prole DL, Taylor CW. 2016. Inositol 1,4,5-trisphosphate receptors and their protein partners as signalling hubs. J Physiol. 594:2849–2866. - PMC - PubMed
    1. Taylor CW, Genazzani AA, Morris SA. 1999. Expression of inositol trisphosphate receptors. Cell Calcium. 26:237–251. - PubMed
    1. Foskett JK, White C, Cheung KH, Mak DO. 2007. Inositol trisphosphate receptor Ca2+ release channels. Physiol Rev. 87:593–658. - PMC - PubMed
    1. Brini M, Calì T, Ottolini D, Carafoli E. 2014. Neuronal calcium signaling: function and dysfunction. Cell Mol Life Sci. 71:2787–2814. - PMC - PubMed