. 2022 Dec 16;2(1):pgac295.
doi: 10.1093/pnasnexus/pgac295. eCollection 2023 Jan.

Watershed memory amplified the Oroville rain-on-snow flood of February 2017

Affiliations

Watershed memory amplified the Oroville rain-on-snow flood of February 2017

Kayden Haleakala et al. PNAS Nexus. .

Erratum in

Abstract

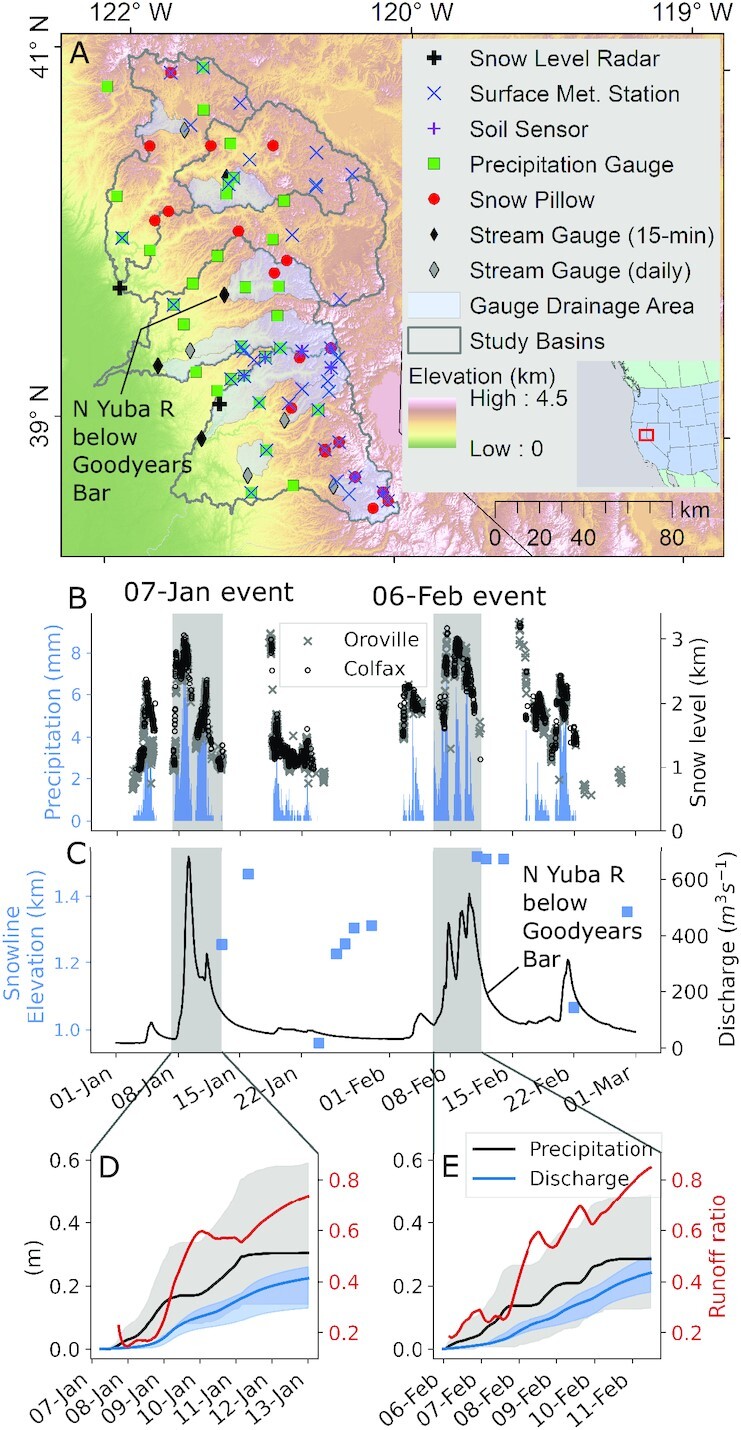
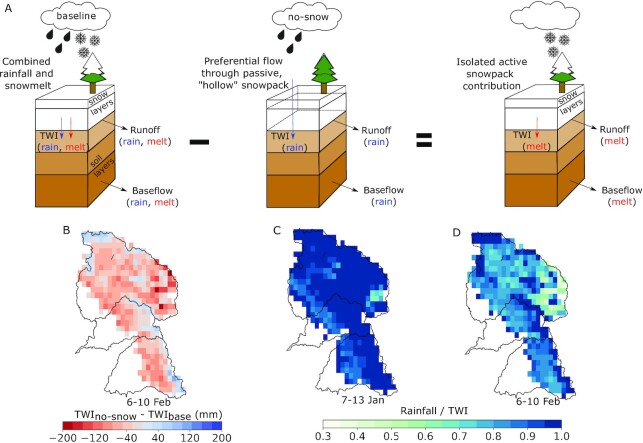
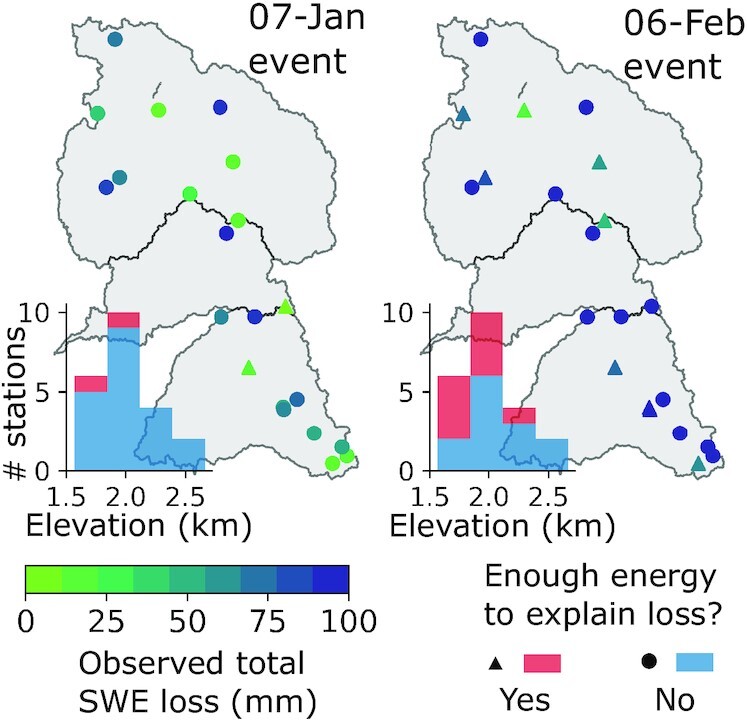
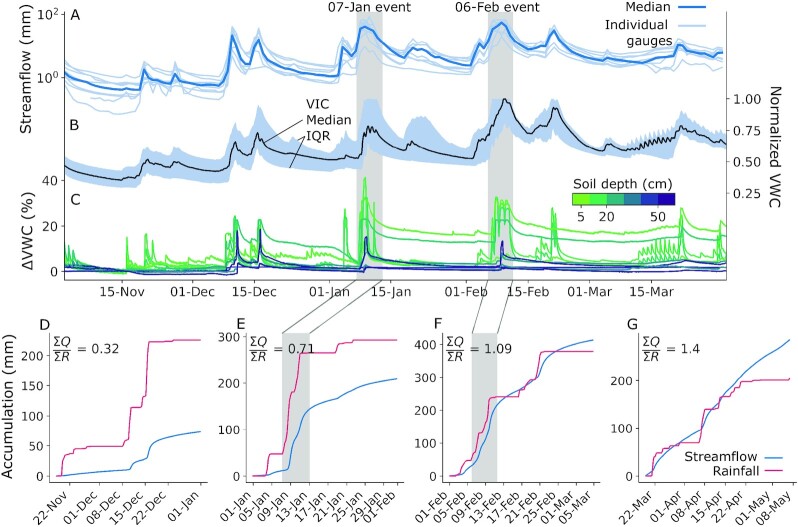
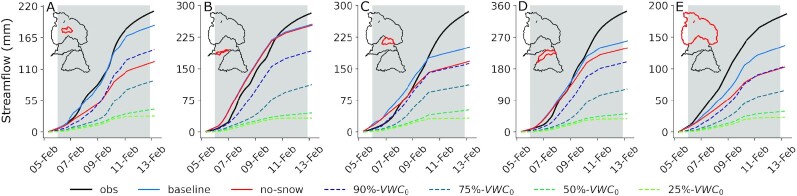
Mountain snowpacks are transitioning to experience less snowfall and more rainfall as the climate warms, creating more persistent low- to no-snow conditions. This precipitation shift also invites more high-impact rain-on-snow (ROS) events, which have historically yielded many of the largest and most damaging floods in the western United States. One such sequence of events preceded the evacuation of 188,000 residents below the already-damaged Oroville Dam spillway in February 2017 in California's Sierra Nevada. Prior studies have suggested that snowmelt during ROS dramatically amplified reservoir inflows. However, we present evidence that snowmelt may have played a smaller role than previously documented (augmenting terrestrial water inputs by 21%). A series of hydrologic model experiments and subdaily snow, soil, streamflow, and hydrometeorological measurements demonstrate that direct, "passive" routing of rainfall through snow, and increasingly efficient runoff driven by gradually wetter soils can alternatively explain the extreme runoff totals. Our analysis reveals a crucial link between frequent winter storms and a basin's hydrologic response-emphasizing the role of soil moisture "memory" of within-season storms in priming impactful flood responses. Given the breadth in plausible ROS flood mechanisms, this case study underscores a need for more detailed measurements of soil moisture along with in-storm changes to snowpack structure, extent, energy balance, and precipitation phase to address ROS knowledge gaps associated with current observational limits. Sharpening our conceptual understanding of basin-scale ROS better equips water managers moving forward to appropriately classify threat levels, which are projected to increase throughout the mid-21st century.

Keywords: Oroville Dam; antecedent conditions; flood; rain-on-snow; terrestrial water input.


Figures

Fig. 1.
Fig. 1.
(A) Snow, river, and hydrometeorological monitoring stations in the Feather (North Fork, east branch of North Fork, and Middle Fork), Yuba, and American River basins. Gray-shaded areas drain to each US Geological Survey (USGS) stream gauge, which report daily or 15-minute measurements. (B) Median hourly incremental precipitation from the network in (A), and 10-minute brightband height (BBH) from snow level radars in January through February 2017. The 7 January and 6 February storm sequences are gray shaded. (C) Daily regional snowline elevation [calculated using Moderate Resolution Imaging Spectroradiometer (MODIS) fractional snow-covered area], and 15-minute stream discharge at USGS gauge 11413000. Cumulative discharge and precipitation median and range are shown for the (D) 7J and (E) 6F storm events, with median runoff ratios shown in red.
Fig. 2.
Fig. 2.
True-color evolution of the snow cover spans snowfall (A and B) and its ablation in late January (C) preceding the February 2017 ROS event (D and E). Orange contours show the regional snowline elevation as in Fig. 1C. The Alta station monitors both weather and soil, and is located in this ephemeral snow region transitioning from snow-covered to snow-free (F). Air and dewpoint temperatures at surface stations in this ephemeral elevation range (960 to 1,312m) gradually approach and exceed 0°C (G), with corresponding fluctuations in Alta’s soil moisture despite no responses in subdaily streamflow (H). These indicate that the ephemeral snow melted (as opposed to sublimated), a result corroborated by distributed model estimates of minimal snowmelt and soil moisture response (I).
Fig. 3.
Fig. 3.
(A) Conceptual diagram of a model experiment to isolate the role of “active” snowpack during the 6F ROS event. Simulating “no-snow” with the same baseline liquid precipitation effectively illustrates preferential flow through a “passive” snowpack. The difference in accumulated TWI between these two scenarios (B) represents the role of snowpack in augmenting TWI. Baseline rainfall to TWI ratios in the (C) 7J and (d) 6F events show a dominant rainfall contribution to TWI.
Fig. 4.
Fig. 4.
Snow pillow responses to the (A) 7J and (b) 6F ROS events show hourly SWE traces colored by air temperature (or wet-bulb temperature, if humidity measurements are available), and bulk snow density (if snow depth measurements are available). Vertical shading indicates periods when atmospheric snow levels were above or below snow pillow elevations. (C) Snow pillows and storms in (A) and (B) are plotted with respect to the winter 2017 at all snow pillows used in this study. (D) Two locations within our study basins have collocated SWE and soil moisture (≤10 cm depth) during these storm events, showing in-phase responses to rainfall.
Fig. 5.
Fig. 5.
Energy balance approximations at the nearest VIC grid cell to snow pillows indicate whether observed losses in SWE (Fig. 4A and B, and S3 to S5) could be completely explained as snowmelt in the (left) 7J and (right) 6F events. Inset histograms show the elevation distribution of snow pillows.
Fig. 6.
Fig. 6.
Winter (A) observed daily streamflow at nine gauges and (B) modeled soil moisture in our study basins. (C) Departure in observed soil moisture at high-elevation stations (n  = 6 above 1,600 m) from values preceding the 16 November 2016 storm. Note that the deep soil moisture at certain stations (e.g., at CSL) became saturated before this period and, therefore, display no change. (D) Streamflow and estimated rainfall (the liquid portion of total precipitation) accumulations at the stream gauge in the central Feather (USGS gauge 11402000). Rainfall values are aggregated from gridded precipitation over the catchment area upstream of the gauge (Fig.   1A).
Fig. 7.
Fig. 7.
Observed and modeled cumulative streamflow during the 6F ROS event at stream gauges in the (A) Central Feather, (B) South Yuba (USGS gauge 11418500), (C) North Yuba, (D) North Fork American (USGS gauge 11427000), and (E) the Feather River basin (observed full-natural flow into Lake Oroville). Scenarios compare the baseline run to experiments removing the 5 February snowpack (“no-snow”) and those systematically lowering the 5-February soil moisture (“N%-VWC0”). Drainage areas are outlined in red.

References

    1. Li D, Lettenmaier DP, Margulis SA, Andreadis KM. 2019. The role of rain-on-snow in flooding over the conterminous United States. Water Resour Res. 55(11):8492–8513.
    1. Welty J, Zeng X. 2021. Characteristics and causes of extreme snowmelt over the conterminous United States. Bull Am Meteorol Soc. 102(8):E1526–E1542.
    1. Tarouilly E, Li D, Lettenmaier DP. 2021. Western U.S. superfloods in the recent instrumental record. Water Resour Res. 57(9):e2020WR029287.
    1. Kattelmann R. 1997. Flooding from rain-on-snow events in the Sierra Nevada. In: Series of proceedings and reports-intern association hydrological sciences. Vol. 239. Anaheim, California: IAHS Publications. p. 59–65.
    1. Ingram LB. 2013. California megaflood: lessons from a forgotten catastrophe. Sci Am. 308. [accessed 2021 Aug 30]. https://www.scientificamerican.com/article/atmospheric-rivers-california....