. 2022 Dec 10;2(1):pgac286.
doi: 10.1093/pnasnexus/pgac286. eCollection 2023 Jan.

Information maximization explains state-dependent synaptic plasticity and memory reorganization during non-rapid eye movement sleep

Affiliations

Information maximization explains state-dependent synaptic plasticity and memory reorganization during non-rapid eye movement sleep

Kensuke Yoshida et al. PNAS Nexus. .

Erratum in

Abstract

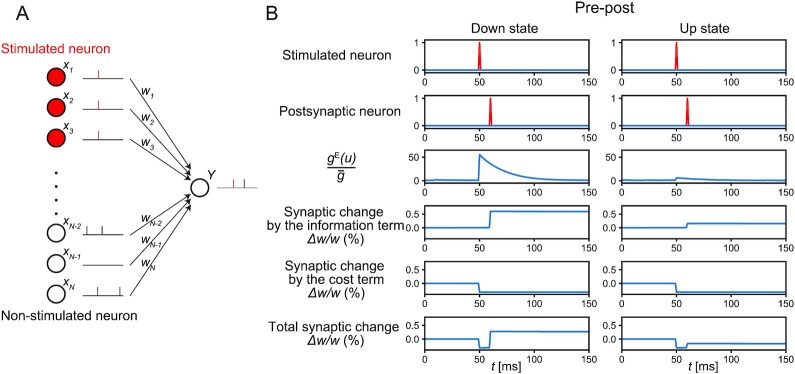
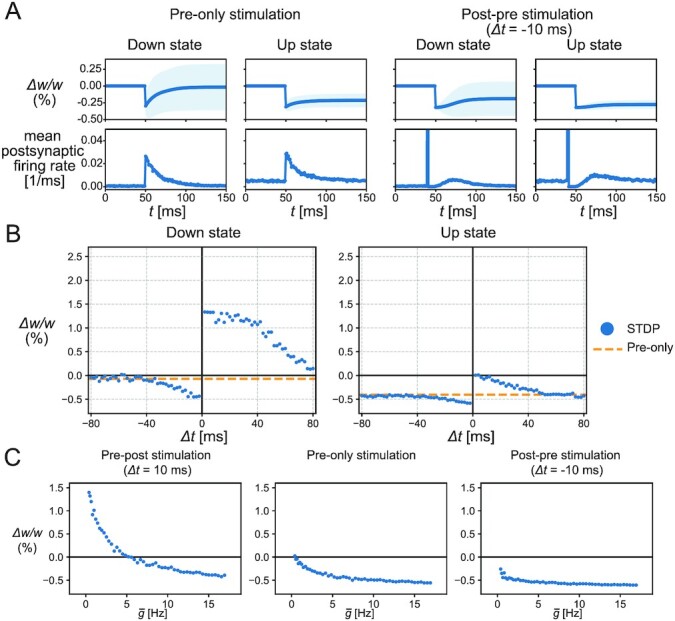
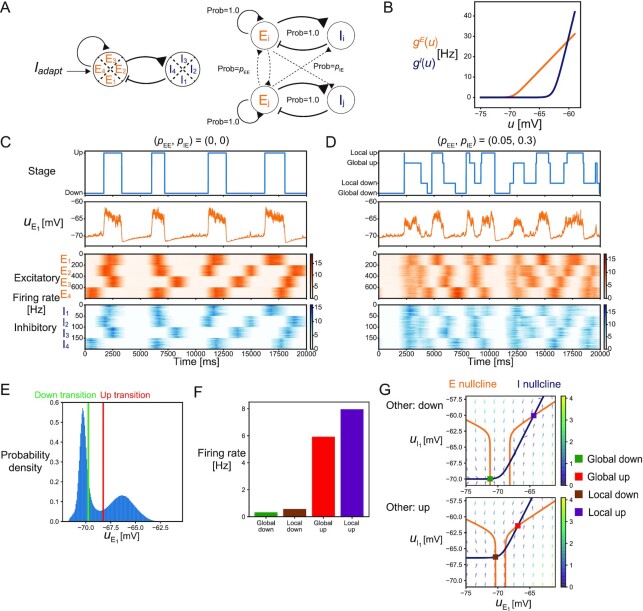
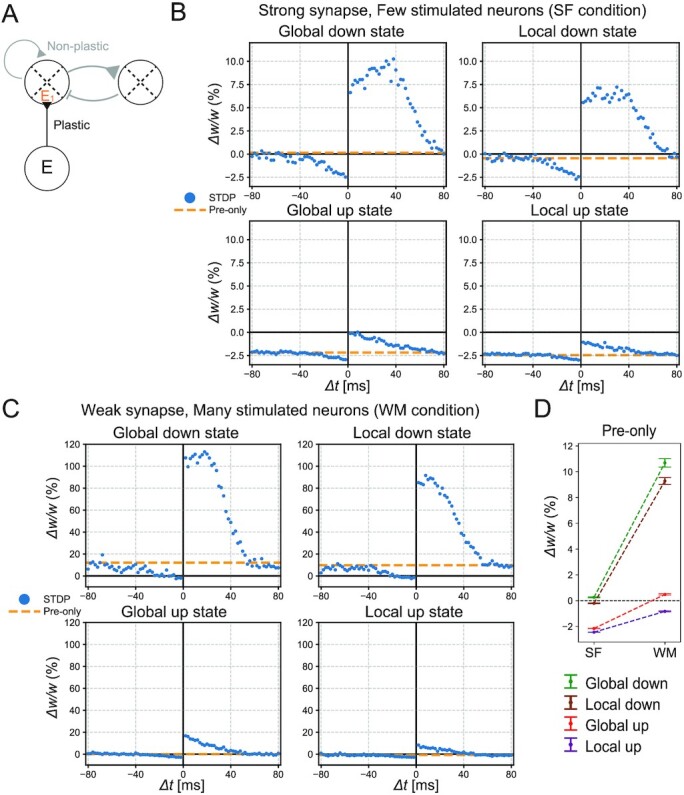
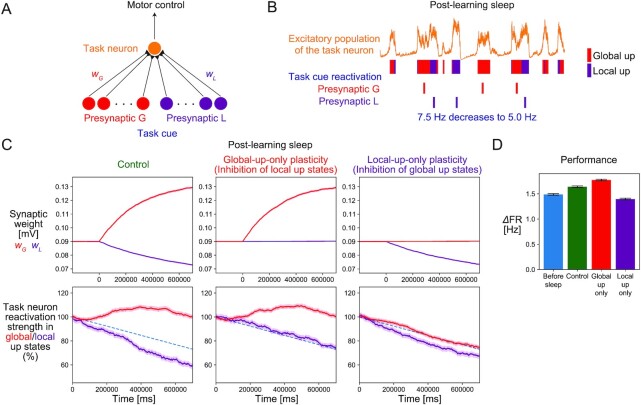
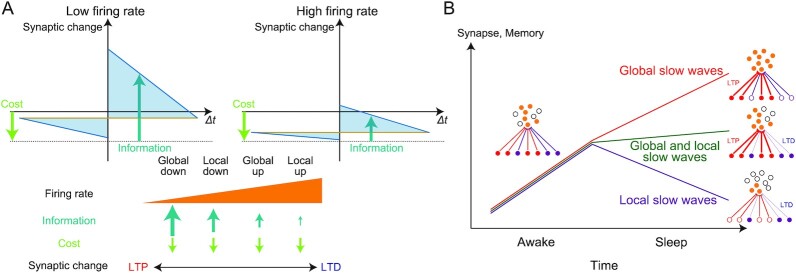
Slow waves during the non-rapid eye movement (NREM) sleep reflect the alternating up and down states of cortical neurons; global and local slow waves promote memory consolidation and forgetting, respectively. Furthermore, distinct spike-timing-dependent plasticity (STDP) operates in these up and down states. The contribution of different plasticity rules to neural information coding and memory reorganization remains unknown. Here, we show that optimal synaptic plasticity for information maximization in a cortical neuron model provides a unified explanation for these phenomena. The model indicates that the optimal synaptic plasticity is biased toward depression as the baseline firing rate increases. This property explains the distinct STDP observed in the up and down states. Furthermore, it explains how global and local slow waves predominantly potentiate and depress synapses, respectively, if the background firing rate of excitatory neurons declines with the spatial scale of waves as the model predicts. The model provides a unifying account of the role of NREM sleep, bridging neural information coding, synaptic plasticity, and memory reorganization.

Keywords: efficient coding hypothesis; learning rule; normative model; slow wave; spike-timing-dependent plasticity.


Figures

Fig. 1.
Fig. 1.
The infomax rule in the single-neuron model. (A) A single-neuron model of synaptic plasticity. Stimulated neurons synchronously emit spikes upon external presynaptic stimulation, and their synaptic weights change according to the infomax rule, whereas nonstimulated neurons spontaneously emit Poisson spikes and their synaptic weights are fixed for simplicity. A postsynaptic neuron emits both spontaneous spikes and evoked spikes upon external postsynaptic stimulation. The red vertical bars represent evoked spikes. (B) Representative traces of a stimulated neuron’s activity, the postsynaptic neuron’s activity, the ratio of the momentary and mean activation intensity formula image, and changes of a synaptic weight from a stimulated neuron in the down and up states. Synaptic changes by the infomax rule were computed by summing the effects of the information term formula image and cost term formula image. The synaptic increase by the information term was smaller in the up state than that in the down state.
Fig. 2.
Fig. 2.
The synaptic plasticity induced by the STDP stimulations. (A) The mean traces of a synaptic weight and the mean postsynaptic firing rate in the pre-only stimulations or the post-pre stimulations with Δt = −10 ms, where the stimulated neurons emitted a synchronous spike upon the external stimulation at t = 50 ms. In the post-pre stimulations, the postsynaptic neuron emitted an evoked spike at t = 40 ms and also responded to the presynaptic stimulation at t = 50 ms with some delay due to refractoriness. After the pre-only stimulations, the synaptic weight changed little in the down state, but was depressed in the up state. In the post-pre stimulation, the synaptic weight was depressed in both the down and up states. The lines and shadows of the weight traces represent the means and SDs, respectively. (B) The synaptic changes by the STDP stimulations (blue points) and pre-only stimulations (orange dotted lines). As the value of Δt increased or decreased, the synaptic changes by the STDP stimulations converged to the change by the pre-only stimulations. Synaptic plasticity was biased towards depression in the up state. (C) Synaptic changes were dependent on mean activation intensity. The synaptic changes in pre-post stimulation with Δt = 10 ms and pre-only stimulation decreased with increasing mean activation intensity, whereas the synaptic changes in post-pre stimulation with Δt = −10 ms were less sensitive to mean activation intensity.
Fig. 3.
Fig. 3.
The cortical network model exhibiting global and local slow waves. (A) The schematic description of the model. (Left) Model composed of four local networks. Each local network included 200 excitatory and 50 inhibitory neurons. (Right) Within a network, connections existed between two excitatory neurons, and between excitatory and inhibitory neurons, while two inhibitory neurons had no connections between them. Between different networks, there were sparse connections from excitatory to excitatory or inhibitory neurons but none from the inhibitory neurons. (B) The activation functions of excitatory and inhibitory neurons. Both functions were softplus functions, but the threshold and slope were greater for inhibitory neurons than those for the excitatory neurons. (C) The dynamics of the slow-wave model in the case of no connections between different local networks. The up and down states of the E1 population were classified using the mean membrane potential formula image. The four networks independently transited between the up and down states. (D) The dynamics of the slow-wave model in the case that there exist sparse connections between different networks. The up and down states of the E1 population were classified into the global or local states depending on the states of the other populations. (E) The probability density of the membrane potential. The transition thresholds to the up and down states are indicated by red and green lines, respectively. (F) The mean firing rates of the E1 population in global down, local down, global up, and local up states. (G) The phase plane of the E1 and I1 population in the case that other populations are in down states (upper) or in up states (lower) (see SI Appendix Methods for details). Excitatory and inhibitory nullclines are shown as orange and blue lines, respectively. The four steady points corresponding to global down, local down, global up, and local up states are shown; the up state of E1 population is global or local when the other populations are in the up or down states, respectively, while the down state of E1 population is global or local when the other populations are in the down or up states, respectively. The formula image values of four steady points followed global down < local down < global up < local up in ascending order.
Fig. 4.
Fig. 4.
STDP in different sleep states. (A) The schematic description of the simulation. Presynaptic neurons had a feedforward projection onto an excitatory postsynaptic neuron in the E1 population. The feedforward synaptic weights were plastic, whereas the recurrent synaptic weights were fixed. (B) The synaptic changes caused by the STDP stimulations (blue points) and pre-only stimulations (orange dotted lines) during each sleep state in the case of strong synapses (formula image mV) and few stimulated neurons (Next = 20) (SF condition). As the value of Δt increased or decreased, the synaptic changes by the STDP stimulations converged to the change by the pre-only stimulations. The amount of synaptic changes follows global down > local down > global up > local up, in descending order. (C) The synaptic changes caused by the STDP stimulations (blue points) and pre-only stimulations (orange dotted lines) during each sleep state in the case of weak synapses ( formula image mV) and many stimulated neurons (Next = 40) (WM condition). The synapses tend to be potentiated even in up states, while the amount of synaptic changes follows global down > local down > global up > local up, in descending order, as with (B). Note that the scale is different from (B). (D) The synaptic changes caused by the pre-only stimulations. Error bars represent SEM. The synaptic changes were dominated by synaptic potentiation in the WM condition. Especially in the WM condition, the pre-only stimulations during global and local up states induced synaptic potentiation and depression, respectively.
Fig. 5.
Fig. 5.
Changes in synaptic weights and task performance during post-learning NREM sleep. (A) The schematic description of the neuronal networks related to the task. Presynaptic neurons were divided into two populations G and L. Both G and L populations emitted synchronous spikes (“task cue”) during the task. The postsynaptic neuron (“task neuron”) is an excitatory neuron in the E1 population that is projected by the presynaptic neurons. Task performance is defined as the firing rate increase of the task neuron during the task period. (B) As neuronal reactivation, the G and L populations emitted synchronous spikes during the global and local up states of the E1 population during the post-learning NREM sleep, respectively, at the firing rates decreasing from 7.5 Hz at the beginning of sleep to 5.0 Hz at the end of sleep. (C) The changes of the synaptic weights and the task neuron reactivation strength during the post-learning sleep. The synaptic changes of the G and L populations are shown in red and purple, respectively (upper). The synapses of the population G were potentiated by reactivation during the global up states, whereas the synapses of the population L were depressed by reactivation during the local up states. When synaptic plasticity during the local-up or global-up is blocked, the synaptic changes of the corresponding population were inhibited. Hence, the sum of synaptic weights in two populations was global-up blocked < control < local-up blocked in ascending order. The reactivation strength of the task neuron in global and local up states are shown in red and purple, respectively (lower). The blue dotted line represents the assumed decrease in the task cue reactivation rate. The reactivation strengths of the task neuron in global and local up states were preserved and diminished, respectively, reflecting the synaptic changes of the corresponding population. In the local-up-blocked and global-up-blocked plasticity conditions, the reactivation strength of the task neuron in local and global up states became the same as the time-course of the task cue reactivation, respectively. The lines and shadows represent the means and SEMs in the 600 trials, respectively. (D) The comparison of task performance before and after synaptic changes during sleep. This tendency is the same as that of the sum of synaptic weights in the G and L populations shown in Fig. 5C. Error bars represent SEM.
Fig. 6.
Fig. 6.
The proposed role of NREM sleep is to bridge neural information coding, synaptic plasticity, and memory reorganization. (A) The relationship between the mean firing rate and synaptic changes by the infomax rule. Synaptic potentiation by the information term was decreased at a high firing rate owing to many background spikes, whereas synaptic depression by the cost term was unaffected. Therefore, the high firing rate induced synaptic depression. Because the mean firing rates are global down < local down < global up < local up in ascending order, the amount of synaptic changes follows the opposite order. (B) The possible distinct roles of global and local slow waves. Reactivated patterns during global slow waves induced synaptic potentiation, whereas those during local slow waves induced synaptic depression. This could cause selective memory consolidation and forgetting of the reactivated patterns during the global and local slow waves, respectively.

References

    1. Diekelmann S, Born J. 2010. The memory function of sleep. Nat Rev Neurosci. 11:114–126. - PubMed
    1. Klinzing JG, Niethard N, Born J. 2019. Mechanisms of systems memory consolidation during sleep. Nat Neurosci. 22:1598–1610. - PubMed
    1. Tononi G, Cirelli C. 2014. Sleep and the price of plasticity: from synaptic and cellular homeostasis to memory consolidation and integration. Neuron. 81:12–34. - PMC - PubMed
    1. Steriade M, Timofeev I, Grenier F. 2001. Natural waking and sleep states: a view from inside neocortical neurons. J Neurophysiol. 85:1969–1985. - PubMed
    1. Huber R, Ghilardi MF, Massimini M, Tononi G. 2004. Local sleep and learning. Nature. 430:78–81. - PubMed