Prognostic and Immunological Potential of Ribonucleotide Reductase Subunits in Liver Cancer
- PMID: 36713030
- PMCID: PMC9883104
- DOI: 10.1155/2023/3878796
Prognostic and Immunological Potential of Ribonucleotide Reductase Subunits in Liver Cancer
Abstract
Background: Ribonucleotide reductase (RR) consists of two subunits, the large subunit RRM1 and the small subunit (RRM2 or RRM2B), which is essential for DNA replication. Dysregulations of RR were implicated in multiple types of cancer. However, the abnormal expressions and biologic functions of RR subunits in liver cancer remain to be elucidated.
Methods: TCGA, HCCDB, CCLE, HPA, cBioPortal, and GeneMANIA were utilized to perform bioinformatics analysis of RR subunits in the liver cancer. GO, KEGG, and GSEA were used for enrichment analysis.
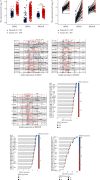
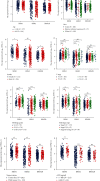
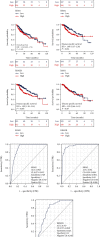
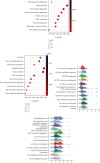
Results: The expressions of RRM1, RRM2, and RRM2B were remarkably upregulated among liver cancer tissue both in mRNA and protein levels. High expression of RRM1 and RRM2 was notably associated with high tumor grade, high stage, short overall survival, and disease-specific survival. Enrichment analyses indicated that RRM1 and RRM2 were related to DNA replication, cell cycle, regulation of nuclear division, DNA repair, and DNA recombination. Correlation analysis indicated that RRM1 and RRM2 were significantly associated with several subsets of immune cell, including Th2 cells, cytotoxic cells, and neutrophils. RRM2B expression was positively associated with immune score and stromal score. Chemosensitivity analysis revealed that sensitivity of nelarabine was positively associated with high expressions of RRM1 and RRM2. The sensitivity of rapamycin was positively associated with high expressions of RRM2B.
Conclusion: Our findings demonstrated high expression profiles of RR subunits in liver cancer, which may provide novel insights for predicting the poor prognosis and increased chemosensitivity of liver cancer in clinic.
Copyright © 2023 Xin Yin et al.
Conflict of interest statement
All authors declare that there are no conflicts of interest.
Figures


Similar articles
-
Identifying ribonucleotide reductase subunit genes as potential lung adenocarcinomas biomarkers using integrated bioinformatics analysis.Malawi Med J. 2024 Jul 30;36(2):134-143. doi: 10.4314/mmj.v36i2.11. eCollection 2024 Jul. Malawi Med J. 2024. PMID: 40191558 Free PMC article.
-
Ribonucleotide Reductase Requires Subunit Switching in Hypoxia to Maintain DNA Replication.Mol Cell. 2017 Apr 20;66(2):206-220.e9. doi: 10.1016/j.molcel.2017.03.005. Epub 2017 Apr 13. Mol Cell. 2017. PMID: 28416140 Free PMC article.
-
P53 suppresses ribonucleotide reductase via inhibiting mTORC1.Oncotarget. 2017 Jun 20;8(25):41422-41431. doi: 10.18632/oncotarget.17440. Oncotarget. 2017. PMID: 28507282 Free PMC article.
-
Cancer Fighting SiRNA-RRM2 Loaded Nanorobots.Pharm Nanotechnol. 2020;8(2):79-90. doi: 10.2174/2211738508666200128120142. Pharm Nanotechnol. 2020. PMID: 32003677 Review.
-
Inhibiting RRM2 to enhance the anticancer activity of chemotherapy.Biomed Pharmacother. 2021 Jan;133:110996. doi: 10.1016/j.biopha.2020.110996. Epub 2020 Nov 20. Biomed Pharmacother. 2021. PMID: 33227712 Review.
Cited by
-
RRM2 promotes liver metastasis of pancreatic cancer by stabilizing YBX1 and activating the TGF-beta pathway.iScience. 2024 Aug 31;27(10):110864. doi: 10.1016/j.isci.2024.110864. eCollection 2024 Oct 18. iScience. 2024. PMID: 39398252 Free PMC article.
-
Creatine kinase elevation in chronic hepatitis B patients with telbivudine therapy: influence of telbivudine plasma concentration and single nucleotide polymorphisms of TK2, RRM2B, and NME4.Eur J Clin Pharmacol. 2024 Jul;80(7):1029-1038. doi: 10.1007/s00228-024-03674-w. Epub 2024 Mar 19. Eur J Clin Pharmacol. 2024. PMID: 38502357
-
DLD is a potential therapeutic target for COVID-19 infection in diffuse large B-cell lymphoma patients.Apoptosis. 2024 Oct;29(9-10):1696-1708. doi: 10.1007/s10495-024-01959-0. Epub 2024 Apr 6. Apoptosis. 2024. PMID: 38581529 Free PMC article.
-
Exploring Ribosomal Genes as Potential Biomarkers of the Immune Microenvironment in Respiratory Syncytial Virus Infection.Biochem Genet. 2025 Apr;63(2):1839-1861. doi: 10.1007/s10528-024-10778-6. Epub 2024 Apr 17. Biochem Genet. 2025. PMID: 38630357
-
Exploring the effect and mechanism of fucoidan on liver cancer depending on network pharmacology and experimental verification.Front Chem. 2025 Jul 16;13:1638785. doi: 10.3389/fchem.2025.1638785. eCollection 2025. Front Chem. 2025. PMID: 40740310 Free PMC article.
References
MeSH terms
Substances
LinkOut - more resources
Full Text Sources
Medical
Miscellaneous

