. 2022 Oct:1:882-899.
doi: 10.1038/s44161-022-00128-3. Epub 2022 Oct 6.

Cooperative ETS Transcription Factors Enforce Adult Endothelial Cell Fate and Cardiovascular Homeostasis

Affiliations

Cooperative ETS Transcription Factors Enforce Adult Endothelial Cell Fate and Cardiovascular Homeostasis

Jesus M Gomez-Salinero et al. Nat Cardiovasc Res. 2022 Oct.

Abstract

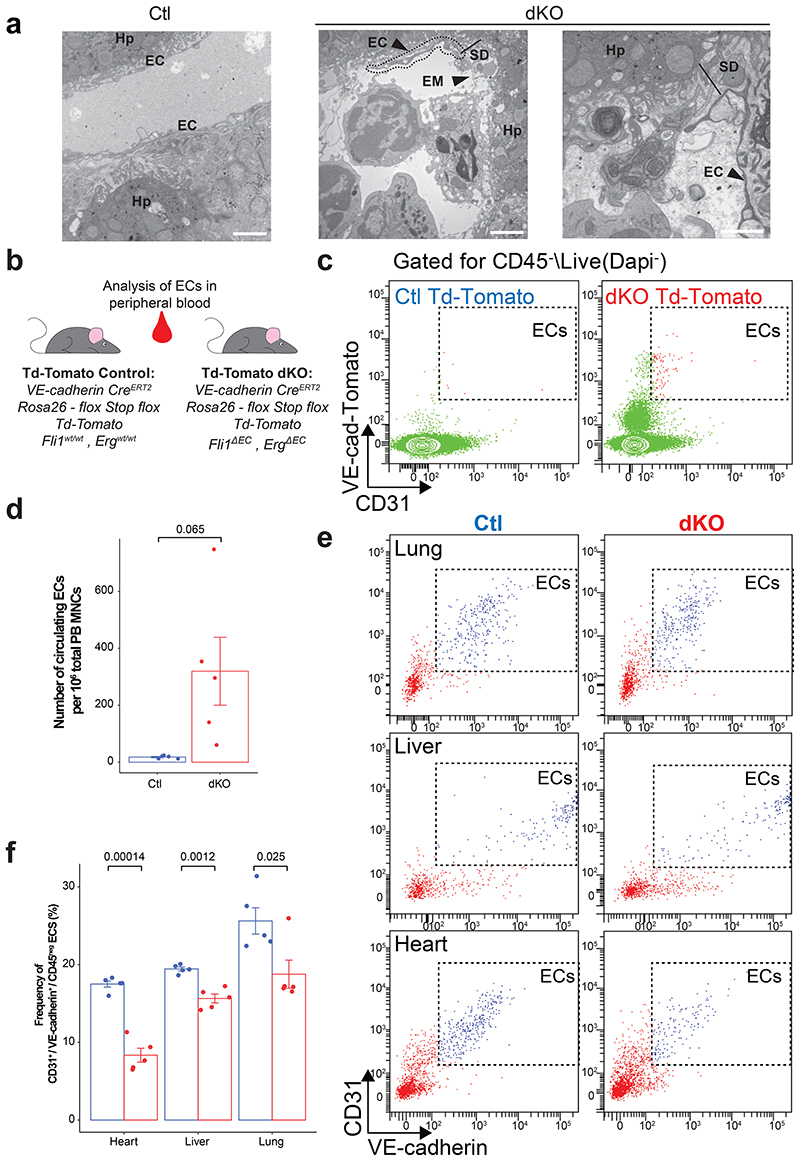
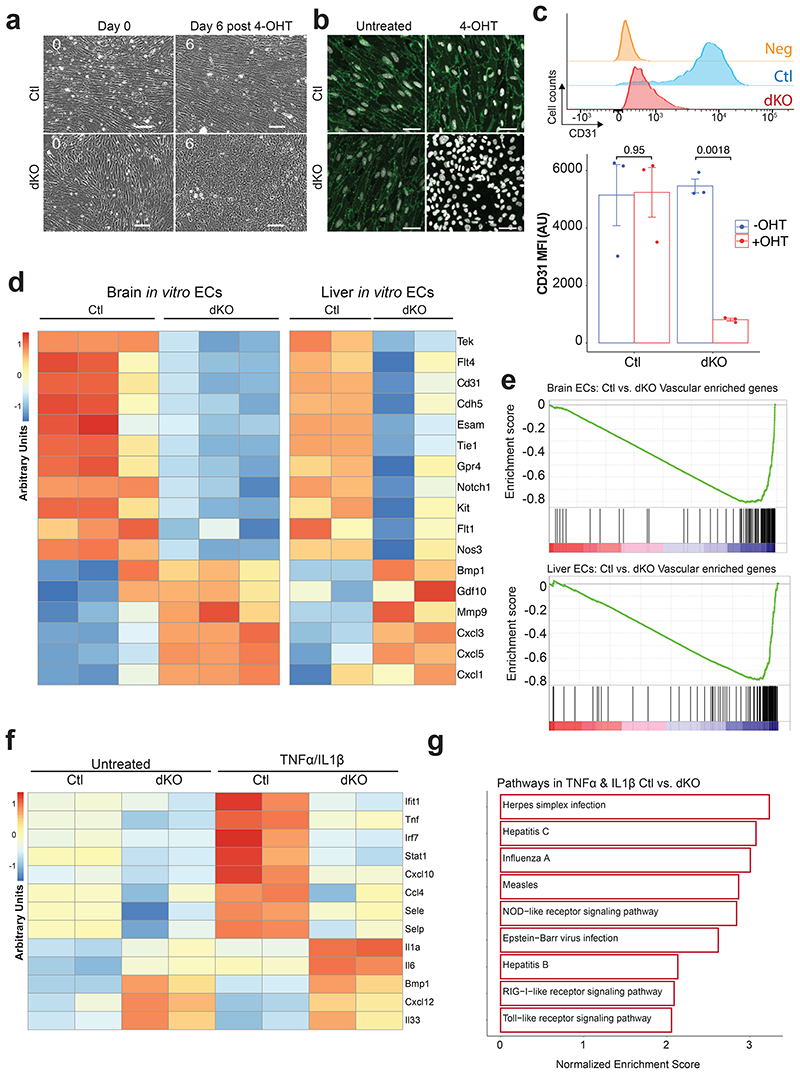
Current dogma dictates that during adulthood, endothelial cells (ECs) are locked in an immutable stable homeostatic state. By contrast, herein we show that maintenance of EC fate and function are linked and active processes, which depend on the constitutive cooperativity of only two ETS-transcription factors (TFs) ERG and Fli1. While deletion of either Fli1 or ERG manifest subtle vascular dysfunction, their combined genetic deletion in adult EC results in acute vasculopathy and multiorgan failure, due to loss of EC fate and integrity, hyperinflammation, and spontaneous thrombosis, leading to death. ERG and Fli1 co-deficiency cause rapid transcriptional silencing of pan- and organotypic vascular core genes, with dysregulation of inflammation and coagulation pathways. Vascular hyperinflammation leads to impaired hematopoiesis with myeloid skewing. Accordingly, enforced ERG and FLI1 expression in adult human mesenchymal stromal cells activates vascular programs and functionality enabling engraftment of perfusable vascular network. GWAS-analysis identified vascular diseases are associated with FLI1/Erg mutations. Constitutive expression of ERG and Fli1 uphold EC fate, physiological function, and resilience in adult vasculature; while their functional loss can contribute to systemic human diseases.


Conflict of interest statement

Competing Interest Statement: Shahin Rafii is the co-founder and non-paid consultant to Angiocrine Bioscience, CA.

Figures

Extended Data Figure 1
Extended Data Figure 1. Endothelial in vivo deletion of ERG is achieved at a multiorgan level.
a-h, Immunofluorescence analysis of ERG (green) expression at day 12 after tamoxifen administration in the endothelium counterstained with VE-cadherin (magenta), Endomucin (Emcn, cyan) and Dapi (white), a-b, brain, c-d, heart, e-f, kidney, g-h, liver, ERGΔECFli1ΔEC dKO mice are represented as dKO, Control WT mice are represented as Ctl, Representative image of n=5 mice stained in the liver, Bar size = 50μm.
Extended Data Figure 2
Extended Data Figure 2. Endothelial in vivo deletion of Fli1 is achieved at a multiorgan level.
a-h, Immunofluorescence analysis of Fli1 (green) expression at day 12 after tamoxifen administration in the endothelium counterstained with VE-cadherin (magenta), Endomucin (Emcn, cyan) and Dapi (white), a-b, brain, c-d, heart, e-f, kidney, g-h, liver, ERGΔECFli1ΔEC dKO mice are represented as dKO, Control WT mice are represented as Ctl, Representative image of n=5 mice stained in the liver, Bar size = 50μm.
Extended Data Figure 3
Extended Data Figure 3. Endothelial deletion of ERG and Fli1 leads to multiorgan alterations.
a-e, Blood parameters were analyzed in Control and Fli1ΔECERGΔEC dKO mice 12 days post tamoxifen administration, Hematocrit – HCT (a), Red blood cells – RBC (b), Hemoglobin – HGB (c), Mean corpuscular volume – MCV (d), mean corpuscular hemoglobin concentration – MCHC (e), Student t-test analysis was performed comparing Ctl and ERGΔECFli1ΔEC dKO mice ±SEM, f-q, Plasma parameters were measured in Control and ERGΔECFli1ΔEC dKO mice 12 days post tamoxifen administration, Alanine aminotransferase – ALT (f), Aspartate aminotransferase – AST (g), Alkaline phosphatase – ALP (h), Albumin – ALB (i), Globin – GLOB (j), Albumin / Globin ratio – A/G ratio (k), Blood urea nitrogen – BUN (l), Creatinine – CREA (m), Blood urea nitrogen/ Creatinine ratio – BUN/CREA ratio (n), Lactic acid dehydrogenase – LDH (o), Cholesterol – CHOL (p), Glucose – GLU (q), Student t-test analysis was performed comparing Ctl and ERGΔECFli1ΔEC dKO mice ±SEM, r, Brain tissue of Control and Fli1ΔECERGΔEC dKO mice 12 days post tamoxifen administration injected IV with Evans Blue, Representative image of n = 5, Blood and serum parameters were measured in n = 10 mice per group.
Extended Data Figure 4
Extended Data Figure 4. Expression of ERG and Fli1 in endothelium is essential for proper cardiac and circulatory function.
a, b, Left ventricular internal dimension in diastole (LVIDd) or systole (LVIDs), c, d, Left ventricular cardiac volume in diastole (LV Vol d) or systole (LV Vol s), e, Ejection fraction, measured as the percentage of ejected blood (EF), Student t-test analysis was performed comparing Ctl and ERGΔECFli1ΔEC dKO mice ±SEM from n = 6 Ctl mice and 8 dKO mice.
Extended Data Figure 5
Extended Data Figure 5. Endothelial deletion of ERG and Fli1 disrupts the vascular program in favor of a maladapted inflammatory phenotype.
a, Endothelial cells from Control (Ctl) and ERGΔECFli1ΔEC dKO mice were collected at day 7, 10 and 12 following tamoxifen administration as indicated before, Cells were sorted based on CD45neg, CD31+, and VE-cadherin$ markers followed by RNA-seq analysis, b-n, Representation of genes involved in EC signaling pathways based on their expression pattern in ERGΔECFli1ΔEC dKO versus Ctl ECs, All genes with an FDR < 0,05 were colored based on their Fold induction < ±2 or > ±2, as indicated in the color legend at the top right, b, Cell membrane and cell junction genes, c, Gap junction genes, d, Vascular permeability genes, e, Tip cell markers, f, Coagulation genes, g, Integrin genes, h, Matrix genes classified in the subfamilies of MMPs, Collagens, Adam family and Crosslinkers, i, Inflammation, j, BMP/TGFp, k, Lamins, l, Glycolysis, m, Notch, n, Igfbp genes, o, Shear stress, p, Graphical representation of the physiological model based on the alterations observed in ERGΔECFli1ΔEC dKO versus Ctl ECs.
Extended Data Figure 6
Extended Data Figure 6. Deletion of ERG and Fli1 alters chromatin accessibility landscape.
a, Principal component analysis of ATAC-seq analysis of control (Ctl) and dKO mice at day 10 after been treated with tamoxifen as indicated before, b, ATAC-seq distance matrix showing association between subclusters.
Extended Data Figure 7
Extended Data Figure 7. In vivo deletion of ERG and Fli1 induces early hematopoietic mobilization and multiorgan myeloid infiltration.
a, BM H&E images of Control and Fli1ΔECERGΔEC dKO mice 7 days post tamoxifen administration, Representative image of n = 5 mice, Enlarged areas display perivascular megakaryocytes, Scale bar = 100 μm, b, c, Number of PB white blood cells (WBC)(b) and platelets (c) at day 7, as determined by HESKA veterinary hematology system, n = 5 mice, Student t-test analysis was performed comparing Ctl and ERGΔECFli1ΔEC dKO mice ±SEM, d, Immunofluorescence of VE-cadherin (magenta) and CD45 (cyan) in control ERGAECFli1AEC dKO mice in liver, heart and kidney, Representative images of n = 5 mice, bar represents 100μm, e-g, Flow cytometry quantification for the frequency of total CD45+ cells (hematopoietic), myeloid (CD45+Gr-1+CD11b+), B-cells (CD45+B220+) or T-cells (CD45+CD3+) present in the heart (e), kidneys (f) and liver (g) of control and ERGΔECFli1ΔEC dKO mice. n = 5 mice per group. Student t-test analysis was performed comparing Ctl and ERGΔECFli1ΔEC dKO mice.
Extended Data Figure 8
Extended Data Figure 8. ERG and FLI1 are associated to diverse cardiovascular disorders in GWAS.
a-b, Analysis of the FinnGen and Uk Biobank GWAS associated pathologies common to both studies, Several vascular and vascular associated pathologies are label, Identification of associated GWAS was performed by selectin ±100kb of ERG and FLI1 genes and significantly enriched pathologies within the FinnGen were included and compared to the Uk biobank.
Extended Data Figure 9
Extended Data Figure 9. ERG and FLI1 cooperatively induce a vascular EC program in non-vascular human MSCs.
a, RNA-seq analysis was performed after 3 weeks in culture for isolated Ctl and ERG/FLI1 MSCs and for cultured HUVECs, Heatmaps of normalized raw counts expression levels of coagulation pathway related genes, n = 4 donors per each MSC group and n = 3 HUVEC donors, b, Schema of experimental design for panels c, d, After 3 weeks of culture control (Ctl) and VE-cadherin+ ERG/FLI1 MSCs were isolated, plated in transwells (8 fM pore size for transmigration assays (e) and 0,4 fM pore size for permeability assays (f)) and in regular culture plate wells, and incubated in EC media until confluency was observed in all culture plate wells, Media in lower well and upper transwell was exchanged for O/N with fresh EC media (control) or with fresh EC media supplemented with both IL-1 (10 ng/mL) and TNFα (10 ng/mL), c, Following incubation, for migration assays, lower well media was replaced with fresh serum free media supplemented with CXCL12/SDF-1 (125 ng/mL), and upper transwell media was exchanged with serum free media containing isolated CD34+ HSPCs from mobilized peripheral blood donors, n = 3 BM MSC donors and n = 2 HSPC donors, HSPCs were allowed to migrate for 4 hours and then collected for flow analysis to determine frequency of migration in lower well relatively to loaded HSPCs in the upper transwell, Two independent experiments were performed each time with a different HSPC donor, Each mark represents an average of n = 3 technical repeats, Two-way ANOVA statistical analysis was performed comparing all groups, d, For permeability assays, lower well media was replaced with fresh serum free media, and upper transwell media was exchanged with serum free media containing FITC-dextran 70 kDa (1ng/mL), n = 3 BM MSC donors, FITC-dextran was allowed to diffuse for 4 hours and then collected for analysis by fluorescent plate reader to determine FITC-dextran concentration in lower well, Two independent experiments were performed, Each mark represents an average of n = 3 technical repeats, Two-way ANOVA statistical analysis was performed comparing all groups, e, Representative stromal monolayer images from n = 3 MSC donors displaying each experimental condition at the time point of beginning of either transmigration or permeability assays, after achieving full confluency, Bars indicate 1000 μm, f, Representative images from n = 4 donors of tube network formation assay 24h post seeding in Matrigel, Ctl and ERG/FLI1 MSCs were isolated after 7 days in culture, Bars indicate 1000 μm.
Extended Data Figure 10
Extended Data Figure 10. Cooperative ERG and Fli1 co-expression is essential for sustaining and induction of endothelial genetic core programs and physiological vascular functions.
a, In vivo deletion of ERG and Fli1 (dKO) induces acute systemic coagulopathy and death in adult mice, associated with a decrease in vascular junctional proteins, EC detachment, increase in vascular leakiness, aberrant expression of cytokines/chemokines and abnormal inflammatory response, b, ERG and Fli1 (in vitro) sustain the expression of the EC core program and ERG/Fli1 combined genetic deletion leads to acquisition of a non-endothelial cell fate which exhibits inadequate response to inflammatory stimulation, c, Overexpression of ERG and FLI1 is sufficient for the induction of a transcriptional vascular EC core programs in human adult non-vascular mesenchymal stromal cells, conferring them with functional vascular tubulogenic network capacity in vitro and in vivo, with the acquisition of an anti-coagulation gene signature, and with the capacity to mount an immune response to facilitate transmigration of hematopoietic cells following inflammatory stimulation.
Figure 1
Figure 1. ERG and Fli1 are essential for the maintenance of in vivo vascular and circulatory homeostatic functions.
a, Schematic representation of the experimental setup for the analysis of ERGΔECFli1ΔEC dKO deletion in adult mice at 12 weeks of age (Control=Ctl). b, Survival curve after the induction of ERGΔECFli1ΔEC dKO in mice using tamoxifen. n = 11 Ctl mice and 10 dKO mice. Student t-test two sided ±SEM. c, Number of circulating platelets (PLT) in control and ERGΔECFli1ΔEC dKO mice at day 12, as determined by HESKA veterinary hematology system. n = 10 mice. Student t-test analysis was performed comparing Ctl and ERGΔECFli1ΔEC dKO mice. d-f, Hematoxylin and eosin (H&E) staining of brain, kidney, and heart from Ctl and ERGΔECFli1ΔEC dKO mice. Arrows indicate thrombosis and microanatomical defects in the endothelium. n = 5 mice. Bar size represents 200μm. g, H&E staining of liver from Ctl and ERGΔECFli1ΔEC dKO mice. n = 5 mice, bar size represents 500μm. h-k, Quantification of Evans Blue dye leakage in the brain, kidney, heart, and liver of Ctl and ERGΔECFli1ΔEC dKO mice. n = 5 mice. Student t-test analysis was performed comparing Ctl and ERGΔECFli1ΔEC dKO mice ±SEM. l, Echography M-mode image of Control and ERGΔECFli1ΔEC dKO mice showing cardiac contraction across time. m, Fractional shortening of cardiac function measure as percentage of blood volume ejected from the heart. n = 6 Ctl mice and 8 dKO mice. Student t-test two sided analysis was performed comparing Ctl and ERGΔECFli1ΔEC dKO mice ±SEM.
Figure 2
Figure 2. ERG and Fli1 enforce multiorgan and tissue-specific vascular transcriptional programs.
a, Control (Ctl) and dKO mice were treated with tamoxifen as indicated before. At day 10, lung, heart and livers were harvested, and ECs were sorted based on CD45neg, CD31+, VE-cadherin+ markers expression. b, Principal component analysis identifying PC3 as the main driver contributing to the differences between Control and dKO samples. c, Gene ontology analysis of the pathways contributing to the global differences between Control (Right) and dKO (Left) mice, based on the genes composing PC3. d, Gene set enrichment analysis (GSEA) of the vascular enriched list of genes in lung, heart and liver. Results show a decreased expression of vascular set of genes in the dKO mice compared to the Controls across tissues. e, GSEA of the vascular organ specific list of genes set in lung, heart and liver. Results show a decreased expression of these unique sets of genes in the dKO mice compared to the Controls across all tissues. f, Heatmaps representation of pan (upper panel) and organotypic (lower panel) specific vascular genes taken from the endothelial cell enriched and organotypic specific gene set lists. Results exhibit a decreased expression of most pan and tissue specific genes, although a level of heterogenic organotypic response to ERG/Fli1 deletion is noted for distinct tissues.
Figure 3
Figure 3. ERG and Fli1 maintain vascular homeostasis and coagulation.
a, Control (Ctl) and dKO mice were treated with tamoxifen as indicated before. At days 7, 10 and 12 livers were collected, and ECs were sorted based on CD45neg, CD31+, VE-cadherin+ markers expression. Principal component analysis shows PC1 separating the samples between Ctl and dKO mice. b, Gene ontology analysis of the pathways contributing to the global differences between Control (Left) and dKO (Right) mice, based on the genes composing PC1. c, Gene ontology analysis of the differentially expressed pathways at days 7, 10 and 12, between Controls and dKO mice. Graphs show pathways enriched in the dKO mice. d, Heatmap analysis presenting the expression pattern of vascular integrity and remodeling genes, glycolysis pathway, and coagulation genes (split as: pro-thrombosis and anti-thrombosis genes), differentially expressed between Ctl and dKO mice. e, Schematic image illustrating the model for the altered signaling pathways between Control and dKO mice, that contribute to dysregulated thrombosis and coagulation cascades.
Figure 4
Figure 4. ERG and Fli1 safeguard vascular chromatin accessibility.
ATAC-seq analysis was performed in control (Ctl) and dKO mice at day 10 after been treated with tamoxifen as indicated before. a, Pie representation of overlapping and uniquely accessible elements among Ctl (blue) and dKO (red) ATAC-seq combined replicates. b, Distribution of peak annotations using ChlPseeker in Ctl and dKO across different genomic locations. Student t-test *p<0.05, **p<0.01, ***p<0.001. c, Top 6 identified enriched domains by HOMER in Ctl and dKO differentially enriched peaks (P-adjusted < 0.01). d, Top 4 Molecular functions associated to Ctl and dKO differentially accessible peaks using GREAT. e, Volcano plot demonstrating highlighted factors from footprinting analysis of dKO samples versus Ctl. The threshold is set at transcription factors with -log10(p-value) above the 95% quantile, a differential binding scores smaller than the 5% quantile, or a differential binding score greater than the 95% quantile. Note increased predicted activity of inflammatory AP-1 TF family members Jun:Fos. f, Aggregate footprint signal plot of Jun:Fos family of genes that are associated with an overall increase inflammatory signaling of flanking chromatin activation in dKO samples (red) and Ctl samples (blue). g, Representative IGV plots demonstrating peaks appearance from RNA-seq, ATAC-seq, and ATAC-seq based footprinting analysis over the genomic locus of the inflammatory induced vascular gene Serpine1. Area labeled with a dotted line mark predicted regulatory enhancer regions upstream to the transcriptional start site (TSS). Note an increased chromatin accessibility for enhancer regions predicted with a footprint target of Fos:Jun motif in dKO samples vs. Ctl samples.
Figure 5
Figure 5. ERG and Fli1 are necessary to maintain in vivo vascular and circulatory integrity.
a, Transmission electron microscopy (TEM) images of Control (Ctl) and ERGΔECFli1ΔEC dKO mouse livers. Hp = hepatocyte, EC = endothelial cells, EM = extracellular matrix exposition, SD = Space of Disse. n = 3, bar size represents 1μm. b, Schematic representation of the experimental setup to generate Td-tomato-ERGAECFli1AEC dKO mice. c-d, Flow cytometry analysis and quantification of circulating ECs following deletion of ERG and Fli1 (Td-tomato-ERGΔECFli1ΔEC dKO mice). n = 5 mice per genotype group. c, Representative flow dot plots cells double positive for CD31 and TdTomato. d, Number of circulating ECs per million of peripheral blood (PB) mononuclear cells (MNCs) as quantified by flow cytometry. Student t-test two sided analysis was performed comparing Ctl and ERGΔECFli1ΔEC dKO mice ±SEM. e-f, Representative dot plots for tissue resident ECs and quantification of EC frequency per tissue following ERG and Fli1 deletion, as determined by flow cytometry. n = 5 mice per genotype group. Student t-test two sided analysis was performed comparing Ctl and ERGΔECFli1ΔEC dKO mice ±SEM.
Figure 6
Figure 6. Maintenance of proper BM hematopoiesis by the vascular niche requires endothelial ERG and Fli1 expression.
Samples from control (Ctl) mice are labeled in blue and from dKO mice are labeled in red. n = 5 mice. Student t-test two sided analysis was performed ±SEM. a, Bone tissues of Control and dKO mice at day 12 injected i.v. with EBD. EBD Quantification in the BM of Ctl and dKO mice. b, Number of PB white blood cells (WBC) at day 12 as determined by HESKA veterinary hematology system. c, Number of colony forming units (CFU) per 2X10 PB WBC plated in methylcellulose as scored after 1 week. d, Frequency of PB LSK HSPC was determined by flow cytometry and numbers were calculated relatively to PB WBC counts per mouse. e, Frequency of PB SLAM LSK HSPC was determined by flow cytometry and numbers were calculated relatively to PB WBC counts per mouse. Representative flow dot plot images for the SLAM markers CD150 and CD48 after pre-gating for Ter-119negLSK cells. Red labeled dots represent CD150+CD48neg LSK HSPCs in the PB. f, BM H&E images of of Control and dKO mice at day 12. Enlarged areas display perivascular megakaryocytes. Scale bar = 100 μm. g, Number of BM white blood cells (WBC) as determined by haematocytometer counting using Turk dye. h, Frequency of BM LSK HSPC was determined by flow cytometry and numbers were calculated relatively to BM WBC counts per mouse. i, Frequency of BM SAM LSK HSPC was determined by flow cytometry and numbers were calculated relatively to BM WBC counts per mouse. j, Representative flow density plot images for the SLAM markers CD150 and CD48 after pre-gating for Ter-119negLSK cells. Green labeled areas surrounded by a dotted line represent CD150+CD48neg LSK HSPCs in the BM. k-m, Frequencies of PB lymphocytes, monocytes, and granulocytes as determined by HESKA veterinary hematology system.
Figure 7
Figure 7. ERG and Fli1 are essential for in vitro vascular programs and function maintenance.
a, Time-lapse analysis of the morphological changes observed in ERGΔECFli1ΔEC dKO cells compared to control (Ctl) during 6 days of culture. Images were acquired from the same spatial spots in wells for 6 days. Representative images of ECs isolated from n=3 mice. Scale bar = 100 μm. b, Immunofluorescence of CD31 in ECs from Ctl and ERGΔECFli1ΔEC dKO mice treated with tamoxifen (4-OHT). Representative images of ECs isolated from n=3 mice. Scale bar = 50 μm. c, Bar plots indicating CD31 mean fluorescent intensity (MFI) as measured by flow cytometry and representative flow cytometry histogram plots analysis for the expression levels of CD31 after Tamoxifen (4-OHT) treatment. Ctl and dKO ECs were isolated from n=3 mice. Student t-test analysis was performed comparing Ctl and ERGΔECFli1ΔEC dKO mice ±SEM. d, Analysis of vascular gene expression levels in Ctl and dKO brain and liver ECs by RNA-seq, 7-days post 4-OHT treatment. Data is represented as a heatmap of the averaged normalized raw counts per row from n=3 biological replicates per group in the brain samples and n=2 in the liver samples. e, GSEA analysis for the expression levels of EC enriched vascular genes set (see Figure 2), performed on 4-OHT treated Ctl and ERGΔECFli1ΔEC dKO brain and liver ECs. f, Heatmap representation of the average expression levels of vascular inflammatory genes in Ctl and dKO liver ECs following stimulation with 4-OHT, 10 ng/mL IL1β, and 10 ng/mL TNFα. n=2 biological repeats per sample. g, Cultured Ctl and dKO liver ECs were in vitro treated with 10 ng/mL IL1β and 10 ng/mL TNFα for 16 hours and analyzed by RNA-seq. KEGG GO pathway analysis of differentially expressed genes enriched in Ctl versus dKO liver ECs is presented.
Figure 8
Figure 8. ERG and FLI1 overexpression induces a vascular transcriptional program in adult human mesenchymal stromal cells.
Human BM derived MSC (n=4 healthy donors) were transfected with ERG and FLI1 (ERG/FLI1) or with “empty”-cassette (Ctl) Lentivectors. a, UMAP analysis plot for distinct MSC sub-populations at day 4. b, Identification of genes differentially expressed by each cluster. c, proportions plot showing the differential contribution of Ctl and ERG/FLI1 samples to each cluster. d, SingleR analysis identifies distinct populations of cell types associated to each sample. e, Dot plot analysis demonstrating that cluster 7 has an increased and preferential expression signature of vascular EC genes. f, Representative and Frequencies of VE-cadherin and CD31 expression in treated MSCs. Student t-test two sided analysis was performed comparing Ctl and ERG/Fli1 overexpressing MSCs ±SEM. n = 4 biological samples from independent donors. g, RNA-seq heatmap analysis performed for Ctl and ERG/FLI1 transfected MSCs and for HUVECs at week 3. n = 4 donors each. n = 3 for HUVEC donors. h, Gene Ontology analysis of signaling pathways differentially expressed between ERG/FLI1 MSCs vs. Ctl MSCs. i-k Representative images from n = 3 donors exhibiting tube formation in fibrin gel assay embedded with ERG/FLI1 MSCs and introduced in microfluidics chip devices for 3 days. Bars = 100 μm. (h) Stained with UEA-1 (purple), (i) Stained with anti V-cadherin (BV9 clone, red), and (j) bright field image of blood perfused tubes. l, Transplantation of Matrigel plugs containing Ctl and ERG/FLI1 transfected MSCs into NSG mice. Mice were i.v. injected with anti-human-VE-cadherin antibody (clone BV9, blue color). Matrigel plugs were stained with anti-human-CD31 antibody (green color). Images represent plugs embedded with either Ctl or ERG/FLI1 transfected cells from n=4 donors. Bars = 1000 μM.

References

    1. Rafii S, Butler J, Ding B. Angiocrine functions of organ-specific endothelial cells. Nature. 2016;529:316–325. - PMC - PubMed
    1. Gomez-Salinero JM, Rafii S. Endothelial cell adaptation in regeneration. Science. 2018;362:1116–1117. - PubMed
    1. Nolan D, et al. Molecular signatures of tissue-specific microvascular endothelial cell heterogeneity in organ maintenance and regeneration. Dev Cell. 2013;26:204–219. - PMC - PubMed
    1. Sabbagh Mv, et al. Transcriptional and Epigenomic Landscapes of CNS and non-CNS Vascular Endothelial Cells. Elife. 2018;7 - PMC - PubMed
    1. Barry Dv, et al. Molecular Determinants of Nephron Vascular Specialization in the Kidney. Nat Commun. 2019;10 - PMC - PubMed