. 2023 Jan 11:13:959138.
doi: 10.3389/fimmu.2022.959138. eCollection 2022.

CK2β-regulated signaling controls B cell differentiation and function

Affiliations

CK2β-regulated signaling controls B cell differentiation and function

Laura Quotti Tubi et al. Front Immunol. .

Abstract

Serine-Threonine kinase CK2 supports malignant B-lymphocyte growth but its role in B-cell development and activation is largely unknown. Here, we describe the first B-cell specific knockout (KO) mouse model of the β regulatory subunit of CK2. CK2βKO mice present an increase in marginal zone (MZ) and a reduction in follicular B cells, suggesting a role for CK2 in the regulation of the B cell receptor (BCR) and NOTCH2 signaling pathways. Biochemical analyses demonstrate an increased activation of the NOTCH2 pathway in CK2βKO animals, which sustains MZ B-cell development. Transcriptomic analyses indicate alterations in biological processes involved in immune response and B-cell activation. Upon sheep red blood cells (SRBC) immunization CK2βKO mice exhibit enlarged germinal centers (GCs) but display a limited capacity to generate class-switched GC B cells and immunoglobulins. In vitro assays highlight that B cells lacking CK2β have an impaired signaling downstream of BCR, Toll-like receptor, CD40, and IL-4R all crucial for B-cell activation and antigen presenting efficiency. Somatic hypermutations analysis upon 4-Hydroxy-3-nitrophenylacetyl hapten conjugated to Chicken Gamma Globulin (NP-CGG) evidences a reduced NP-specific W33L mutation frequency in CK2βKO mice suggesting the importance of the β subunit in sustaining antibody affinity maturation. Lastly, since diffuse large B cell lymphoma (DLBCL) cells derive from GC or post-GC B cells and rely on CK2 for their survival, we sought to investigate the consequences of CK2 inhibition on B cell signaling in DLBCL cells. In line with the observations in our murine model, CK2 inactivation leads to signaling defects in pathways that are essential for malignant B-lymphocyte activation.

Keywords: B cell development; B cell receptor signaling; B lymphocyte; Diffuse large B cell lymphoma; germinal center; marginal zone; protein kinase CK2.


Conflict of interest statement

CWS is employed at Genentech, Inc. The remaining authors declare that the research was conducted in the absence of any commercial or financial relationships that could be construed as a potential conflict of interest.

Figures
Figure 1
Figure 1
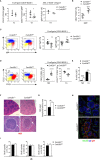
CK2β KO in B cells affects B cell number and Igs production. (A) CD19+ sorted marrow and splenic B cells analyzed for the expression of Csnk2b by qRT-PCR. The expression was corrected for Actin levels and normalized to CTRL B cells. Data are shown as mean ± SD (n=4 BM, n=5 spleen). Statistical significance was determined by Student’s t test (**p < 0.01; ***p < 0.001). (B) CK2α and β levels in CK2βCTRL and CK2βκO marrow and splenic purified B cells were assessed by WB. GAPDH was used as loading control (whole cell lysates; one representative of 3 independent experiments). Band quantitation was calculated using Quantity One 4.6.6 software; obtained values are reported on top of each band. (C) CK2 kinase activity in purified splenic B cells from CK2βCTRL and CK2βκO mice. Data are shown as mean ± SD (n=3 mice per genotype, 2 independent experiments). Statistical significance was determined by Student’s t test (*p < 0.05). In (A-C) the purity of sorted B cells was ≥94%. (D) p65/RELA and AKT phosphorylation in purified splenic B cells obtained by magnetic separation from CK2βCTRL and CK2βκO mice was assessed by WB. GAPDH was used as a loading control (whole cell lysates, one representative of 3 independent experiments). Band quantitation was calculated using Quantity One 4.6.6 software; obtained values are reported on top of each band. (E) Right, Scatter plots representing the percentage of CD19+B220+ cells in BM and spleen of CK2βCTRL and CK2βκO mice, with each symbol representing a mouse. Left, for each genotype one representative dot plot is shown, numbers in gates indicate the percentage of CD19+B220+ cells. Statistical significance was determined by Student’s t test (**p < 0.01). (F) Graphs summarizing absolute counts of B220+ cells in BM, spleen and PB. Data are reported as mean ± SD, statistical significance was determined by Student’s t test (**p < 0.01). (G) Bottom, Scatter plots summarizing the percentages of recirculating, immature, and Pre/Pro B cell subsets in the BM of CK2βCTRL and CK2βκO mice, with each symbol representing a mouse. Data are shown as mean ± SD. Statistical significance was determined by Student’s t test (**p < 0.01; *p < 0.05). Top, one representative contour plot per genotype shows the gating strategy. (H) Pro-B (CD19+B220lowIgM-c-Kit+) and Pre-B (CD19+B220lowIgM-CD25+) cell percentages in the BM of CK2βCTRL and CK2βκO mice. Data are shown as mean ± SD. Statistical significance was determined by Student’s t test (ns). (I) Bottom, Graphs representing the percentages of BM mature (B220+CD19+IgM+/-IgD+) and immature (B220+CD19+IgM+IgD-) B cells in CK2βCTRL and CK2βκO mice. Data are shown as mean ± SD. Statistical significance was determined by Student’s t test (***p < 0.001). Top, one representative dot plot is shown for each genotype. (J) Graphs showing percentages of T1-like (B220+AA4.1+IgMhiCD23-) and T2-like (B220+AA4.1+IgMhiCD23+) B cells in the BM of CK2βCTRL and CK2βκO mice. Values are reported as mean ± SD. Statistical analysis was performed with Mann-Whitney test (ns). (K) IgH production quantified by ELISA in the sera of CK2βCTRL and CK2βκO mice. Data are shown as mean ± SD (n=4). Statistical significance was determined by Student’s t test (**p < 0.01; *p < 0.05). BM, bone marrow.
Figure 2
Figure 2
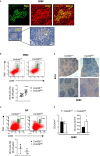
Phenotypic characterization of splenic B cell subsets in CK2βCTRL and CK2βκO mice. (A) Scatter plots summarizing the percentage of T1 (B220+CD19+CD21lowCD23-IgMhi), T2 (B220+CD19+CD21lowCD23+IgMhi) and T3 (B220+AA4.1+IgMlowCD23+) B cells in the spleen of CK2βCTRL and CK2βκO mice, with each symbol representing a mouse. Statistical significance was determined by Student’s t test (*p < 0.05). (B) Scatter plots showing the percentages of MZP (CD21hiCD23+) B cells in the spleen of CK2βCTRL and CK2βκO mice. Data are represented as mean± SD. Statistical significance was determined by Student’s t test (***p < 0.001). (C) Right, Scatter plots representing the percentage of splenic B220+CD19+IgM+/-IgD+ and B220+CD19+IgM+IgD- B cells of CK2βCTRL and CK2βκO mice, with each symbol representing a mouse. Data are shown as mean ± SD. Statistical significance was determined by Student’s t test (**p < 0.01). Left, one representative dot plot is shown for each genotype. (D) (Right) Scatter plots summarizing the percentage of MZ (B220+CD19+CD21hiCD23-) and Fo (B220+CD19+CD21dim/-CD23+) B cells in the spleen of CK2βCTRL and CK2βκO mice. Statistical significance was determined by Student’s t test (***p < 0.001; ****p < 0.0001). Left, one dot plot is presented for each genotype, numbers in gates indicate the percentages of Fo and MZ B cells. (E) Histogram summarizing the absolute number of Fo and MZ B cells in CK2βCTRL and CK2βκO mice. Data are shown as mean ± SD (n=7). Statistical significance was determined by Student’s t test (*p < 0.05; ***p < 0.001). (F) Spleen sections from CK2βCTRL and CK2βκO mice were stained with H&E. Bar, 500μm upper panels; 100μm lower panels. Image acquisition was performed using the Leica DMD108 Digital Microimaging Device and Software (Leica Microsystems, Germany). Data show results from one representative mouse out of 3. Arrows indicate the MZ. (G) Ratio between MZ and lymphoid follicle areas in the spleen of CK2βCTRL and CK2βκO mice was calculated using the Leica DMD108 Digital Microimaging Device and Software (2 mice per genotype; 2 independent experiments; +/+= 32 follicles; fl/fl= 54 follicles). Data are shown as mean ± SD. Statistical significance was determined by Student’s t test (*p < 0.05). (H) CD169 (green), IgD (blue) and IgM (red) expression in spleen sections from CK2βCTRL and CK2βκO mice was analyzed by IF. One representative mouse out of 3 per genotype is shown; 3 independent experiments. Bar, 50μm. Images were acquired with Zeiss LSM 700 confocal microscope and ZEN software. Pictures were acquired using 10x/0.3 dry and 20x/0.8 dry objectives at room temperature and merged in three-color images with ImageJ software. (I) Quantification of the percentage of T1, MZ and Fo B cells that incorporated BrdU after continuous administration for 6 days in CK2βCTRL (n=5) and CK2βκO (n=4) mice. Three independent experiments. MZ, marginal zone.
Figure 3
Figure 3
GSEA by gene set permutations of RNAseq data in CK2βCTRL and CK2βκO B cells in basal condition. (A) Heatmap of the top 50 features for each phenotype in GSE89082 as accessed by gene markers analysis. Expression values are represented as colors, where the range of colors (red, pink, light blue, dark blue) shows the range of expression values (high, moderate, low, lowest). (B-D) Heatmaps showing leading edge features (scores >0.5 and <-0.5) related to Gene Set GO biological process Ig production, Regulation of B-cell activation and Somatic Diversification of Igs respectively. (E) Enrichment score curves of significantly enriched Gene Set GO biological process Ig production. (F) Enrichment score curves of significantly enriched Gene Set GO biological process Regulation of B-cell activation. (G) Enrichment score curves of significantly enriched Gene Set GO biological process Somatic Diversification of Igs. In (A, B) genes of interest are flanked by a symbol: a blue dot for Csnk2b, red stars for over-expressed genes and blue stars for down-regulated genes in CK2βKO samples. In this figure the purity of B cells isolated through sorting was >95%.
Figure 4
Figure 4
Activation of the NOTCH2 pathway determines an expansion of the MZ. (A) Splenic CD19+ B cells analyzed for the expression of Hes1 and Dtx1 by qRT-PCR. The expression is corrected for Gapdh levels and normalized to CK2βCTRL B cells. Data are shown as mean ± SD (n=4, three independent experiments). Statistical significance was determined by Student’s t test (***p < 0.001). (B) Splenic B cells analyzed for the expression of Notch2 by qRT-PCR. The expression is corrected for Gapdh levels and normalized to CK2βCTRL B cells. Data are shown as mean ± SD (n=5, three independent experiments). (C) Top, NOTCH2 expression in CK2βCTRL and CK2βKO splenic B lymphocytes was determined by WB (whole cell lysates, one representative experiment out of three). Bottom, Mean relative density of three experiments relative to CK2βCTRL B cells. Data are shown as mean ± SD. Statistical significance was determined by Student’s t test (*p < 0.05). In (A-C) the B cell fraction was purified using EasySep™ Mouse B Cell isolation kit (Stemcell) and the purity was ≥97%. (D) Flow cytometry analysis of NOTCH2 expression through intracytoplasmic staining. Top, NOTCH2 MFI in CK2βCTRL and CK2βKO mice, Bottom, graphs summarizing the percentage of NOTCH2 positive cells in the gate of MZ and Fo B cells shown as mean ± SD (two independent experiments). Statistical significance was determined by Student’s t test (*p < 0.05). (E) MZ B cells (CD21hiCD23-) from CK2βCTRL and CK2βκO mice were analyzed by flow cytometry after IgG or α-NRR2 administration. Top, representative dot plots indicating the MZ B cell gate. Bottom, Histograms summarizing the data of two independent experiments shown as mean ± SD. Statistical significance was determined by Student’s t test (*p < 0.05). (F) IF images of spleen sections showing CD169 (green), IgD (blue) and IgM (red) expression in IgG and α-NRR2 treated mice. Bar, 50μm. One representative mouse out of two per group is shown. Images were acquired with Zeiss LSM 700 confocal microscope and analyzed with ZEN software. Pictures were acquired using objectives 10x/0.3 dry and 20x/0.8 dry at room temperature and merged in three-color images with ImageJ software.
Figure 5
Figure 5
GC expansion after SRBC immunization in CK2βκO mice. CK2βCTRL and CK2βκO mice immunized with SRBC or NP-CGG and analyzed 14 days post-immunization. (A) CK2β expression and localization in the GCs of CK2βCTRL spleens after immunization with SRBC. Top, IF images of spleen sections showing PNA (green) and CK2β (red). Images were acquired with Zeiss LSM 700 confocal microscope and analyzed with ZEN software. Pictures were acquired using objectives 20X, zoom1, and merged in two-color images with ImageJ software. Bottom, IHC of CK2β (Abcam) counterstained with hematoxylin; the magnification highlights the GC region. (B) GCs by Flow Cytometry in CK2βCTRL and CK2βκO mice after immunization with SRBC or (C) with NP. In (B, C) at the bottom, representative scatter plots of the percentage of splenic GC B cells (B220+CD95hiPNAhi) with each symbol representing a mouse. Data are shown as mean ± SD. Statistical significance was determined by Student’s t test (***p < 0.001). Top, a representative dot plot per genotype is depicted, numbers near gates indicate the percentage of B220+CD95hiPNAhi cells. (D) GCs in spleen sections from mice of the corresponding genotypes identified through BCL6 staining and counterstained with hematoxylin. Image acquisition was performed using the Leica DMD108 Digital Microimaging Device and Software (Leica Microsystems, Germany). One representative mouse out of 3 per group is shown. Upper panels: bar, 500μm, lower panels: bar, 200μm (3 independent experiments). (E) Histograms summarizing the number of GCs per unit area (n=4 mice per genotype) and the area of selected GCs (n=3 mice per genotype, 7 GCs per mouse) of spleen sections stained with H&E from CK2βCTRL and CK2βκO mice. Data are shown as mean ± SD. Statistical significance was determined by Student’s t test (*p < 0.05).
Figure 6
Figure 6
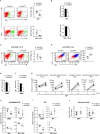
Impaired isotype-switch and Plasmablasts generation in CK2βκO mice after in vitro stimulation and in vivo immunization. (A) CK2βCTRL and CK2βκO purified splenic B cells stimulated in vitro with LPS or LPS+IL-4 and analyzed after 72h. Right, Scatter plot of the percentage of B220+ IgG3+ or B220+ IgG1+ cells measured by Flow Cytometry, with each symbol representing a mouse. Data are shown as mean ± SD. Statistical significance was determined by Student’s t test (**p < 0.01; ***p < 0.001). Left, One representative dot plot per genotype is depicted. (B) IgG3 or IgG1 production quantified by ELISA in the cell media of CK2βCTRL and CK2βκO splenic B cells after exposure for 72h to LPS and LPS+IL4. Data are shown as mean ± SD (n=3 mice per genotype). Statistical significance was determined by Student’s t test (*, p < 0.05). (C) CD19+ IgG1+ and (D) CD19+IgM+ cells from CK2βCTRL and CK2βκO purified splenic B cells stimulated in vitro for 48h with anti-CD40+IL-4. In detail: For both (C, D) Right, Graphs showing the percentage of each gated population, Left, A representative dot plot per genotype. Data are shown as mean ± SD. Statistical significance was determined by Student’s t test (*p < 0.05). (E) Flow Cytometry and (F) ELISA in CK2βCTRL and CK2βKO mice after 14 days of immunization with SRBC. In detail: (E) Histogram summarizing the percentage of splenic IgG1+ GC B cells. Data are shown as mean ± SD (n=3). Statistical significance was determined by Student’s t test (*p < 0.05) and (F) IgG1 production in the serum. Data are shown as mean ± SD. Statistical significance was determined by Student’s t test (**p < 0.01). (G) Evaluation of NP-specific serum Ig titers after 14 days of NP immunization. Data were obtained through direct ELISA test, coating plates with NP23-BSA or NP4-BSA antigens to quantify total and high affinity NP-specific Abs. The concentration of total NP-specific IgM or IgG1 and high-affinity IgM and IgG1 Ab levels against NP23 and NP4 antigens are shown in Spaghetti Graphs that report Ig values before and after immunization. 4 mice per each genotype. Statistical significance was determined by Mann-Whitney U test (ns). (H) Graphs representing plasmablast (B220hiCD138+) percentages in the spleens of mice immunized with SRBC or NP (top) and after in vitro stimulation of purified splenic B cells with LSP or LPS+IL4 (bottom). Data are shown as mean ± SD. Statistical significance was determined by Student’s t test (*p< 0.05; **p < 0.01). (I) Percentages of PCs upon immunization of CK2βCTRL and CK2βKO mice with SRBC or NP (top) and after exposure of purified B cells to LPS or LPS+IL4 (bottom). Scatter plots indicate mean ± SD. Statistical significance was determined by Student’s t test (**p < 0.01). (J) Scatter plots showing memory B cells (CD19+CD27+) in the spleen of CK2βCTRL and CK2βκO mice after immunization with SRBC (left) and NP (right) for 14 days. Data are shown as mean± SD. Statistical significance is determined by Mann-Whitney test (ns). In (A-C, H) B cells were purified with EasySep™ Mouse B Cell Isolation Kit (Stemcell) and purity was ≥97%.
Figure 7
Figure 7
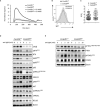
Impaired BCR signaling in CK2βκO mice. (A) Graph representing cytosolic Ca++ waves in CK2βCTRL and CK2βκO mice ± CX-4945 pre-treatment (5μM, 3h). Cells were stimulated with α-IgM at 30 sec and ionomycin at 420 sec (n=3 CK2βCTRL and 3 CK2βκO mice). (B) Expression of IgM on the surface of B cells (CD19+B220+) from CK2βCTRL and CK2βκO mice was assessed by flow cytometry. Numbers on the plot show average MFI ± SD (n=6). (C) Scatter plot of the maximum of fluorescence variation (ΔF/F0) in CK2βCTRL (n=86 individual cells from 2 mice) and CK2βκO (n= 122 individual cells from 3 mice) B cells. Median with interquartile range is shown. Statistical significance was determined by Mann-Whitney test. (D, E) Study of the signaling pathways downstream of the BCR on B cells purified from the spleens of CK2βCTRL and CK2βκO mice treated in vitro for 1, 5 or 10 minutes with anti-IgM antibody. Blots are representative of four independent experiments where at least two spleens were pooled together. In (D, E) the B cell fraction was purified with EasySep™ Mouse B Cell Isolation Kit (Stemcell) and the purity was ≥98%.
Figure 8
Figure 8
Lack of CK2β alters the activation and expression of molecules important for the GC reaction. (A) WB of pERK1/2 and ERK1/2 in purified splenic B cells at d=0 and d=3 of LPS and LPS+IL4 stimulation. This figure is representative of three independent experiments. (B, C) WB analysis of purified splenic B cells unstimulated and after anti-CD40 ± IL-4. (B) Stimulation for 5 and 10 minutes and (C) for 48 hours. Blots are representative of four independent experiments. In (A-C) at least two spleens were pooled together in each experiment. (D, E) Evaluation by qRT-PCR of Aicda levels in purified splenic B cells after stimulation with LPS ± IL-4 (D) or anti-CD40 ± IL-4 (E). The expression is corrected for Gapdh levels and normalized to CK2βCTRL B cells. Data are shown as mean ± SD (CK2βCTRL n=3; CK2βκO n=3). Statistical significance is determined by Student’s t test (*p < 0.05). (F) Analysis of spleen sections from CK2βCTRL and CK2βκO mice after immunization with SRBC (14 days) stained with RNAscope probes to detect Aicda levels in GCs and counterstained with hematoxylin. In order from top to bottom 4X, 10X, 20X objective magnifications. Images are representative of three controls and three CK2βκO mice. (G) Quantitative analyses of Aicda in situ hybridization signals upon immunization with SRBC for 14 days. Graphs represent mean ± SD obtained by calculating the average percentage of positive signals in five non-overlapping fields for each mouse at high-power magnification using the Positive Pixel Count v9 ImageScope software, Leica Biosystems (n= 3 CK2βCTRL and 3 CK2βκO mice). Statistical significance is determined by Nested t test (*p < 0.05). (H) Bcl6, Irf4 and Prdm1 levels determined by qRT-PCR on purified B cells treated for 48h with anti-CD40 ± IL-4. Data were normalized over Gapdh and CTRL samples, and represented as mean ± SD (n=3). Statistical significance was determined by Student’s t test (*p < 0.05; **p < 0.01). In (A–E, H) the B cell fraction was purified with EasySep™ Mouse B Cell Isolation Kit (Stemcell) and purity was >97%.
Figure 9
Figure 9
CK2 chemical inhibition reduces the activation and expression of BCR signaling molecules in DLBCL cell lines. (A) WB of CK2α, CK2β, BCL6 and AID baseline expression in a panel of ABC- and GCB DLBCL cell lines. (B) OCI-LY1, OCI-LY18 and Pfeiffer cells treated with CX-4945 (1 and 2µM) for 6 hours. (A, B) are representative of at least three independent experiments. GAPDH was used as a loading control. (C) Evaluation of OCI-LY1, OCI-LY18 and Pfeiffer cell line viability after exposure to CX-4945 (1 and 2µM) for 6 hours. Bottom, Graphs showing the percentages of dead cells after staining with AnnV/PI. Data are represented as mean ± SD of values normalized over the mean of untreated samples. Statistical significance was determined by Mann-Withney test (*p < 0.05) (OCI-Ly1 n=4; OCI-Ly18 n=5; Pfeiffer n=4). Top, representative WB of PRO-CASPASE 3 expression. GAPDH was used as a loading control. (D) Cell cycle analysis in OCI-LY1, OCI-LY18 and Pfeiffer cells upon treatment with CX-4945 (1 and 2µM) for 6 hours. Histograms represent the four phases of the cell cycle. Data are represented as mean ± SD. Statistical significance was determined by Mann-Withney test (*p < 0.05) (OCI-Ly1 n=4; OCI-Ly18 n=5; Pfeiffer n=4).

References

    1. Monroe JG, Dorshkind K. Fate decisions regulating bone marrow and peripheral b lymphocyte development. Adv Immunol (2007) 95:1–50. doi: 10.1016/S0065-2776(07)95001-4 - DOI - PubMed
    1. Pillai S, Cariappa A. The follicular versus marginal zone b lymphocyte cell fate decision. Nat Rev Immunol (2009) 9(11):767–77. doi: 10.1038/nri2656 - DOI - PubMed
    1. Casola S, Otipoby KL, Alimzhanov M, Humme S, Uyttersprot N, Kutok JL, et al. . B cell receptor signal strength determines b cell fate. Nat Immunol (2004) 5(3):317–27. doi: 10.1038/ni1036 - DOI - PubMed
    1. Pieper K, Grimbacher B, Eibel H. B-cell biology and development. J Allergy Clin Immunol (2013) 131(4):959–71. doi: 10.1016/j.jaci.2013.01.046 - DOI - PubMed
    1. Miao Y, Medeiros LJ, Li Y, Li J, Young KH. Genetic alterations and their clinical implications in DLBCL. Nat Rev Clin Oncol (2019) 16(10):634–52. doi: 10.1038/s41571-019-0225-1 - DOI - PubMed

Publication types

Substances