. 2023 Jan 11:12:1068979.
doi: 10.3389/fonc.2022.1068979. eCollection 2022.

Defining biomarkers in oral cancer according to smoking and drinking status

Affiliations

Defining biomarkers in oral cancer according to smoking and drinking status

Juliette Rochefort et al. Front Oncol. .

Abstract

Introduction: Oral Squamous Cell Carcinomas (OSCC) are mostly related to tobacco consumption eventually associated to alcohol (Smoker/Drinker patients: SD), but 25-30% of the patients have no identified risk factors (Non-Smoker/Non-Drinker patients: NSND). We hypothesized that these patients have distinguishable immune profiles that could be useful for prognosis.

Materials and methods: Cells present in immune tumor microenvironment (TME) and blood from 87 OSCC HPV-negative patients were analyzed using a multiparameter flow cytometry assay, in a prospective case-control study. Cytokine levels in tumor supernatants and blood were determined by a cytometric bead array (CBA) assay.

Results: Normal gingiva and blood from healthy donors (HD) were used as controls. A significant increase of granulocytes (p<0.05 for blood), of monocytes-macrophages (p<0.01 for blood) and of CD4+ T cells expressing CD45RO and CCR6 (p<0.001 for blood; p<0.0001 for TME) as well as higher levels of IL-6 (p<0.01 for sera, p<0.05 for tumor supernatant) were observed in SD patients as compared to NSND OSCC patients and HD. High percentages of CD4+ T cells expressing CD45RO and CCR6 cells in tumor tissue (p=0.05) and blood (p=0.05) of SD OSCC patients were also associated with a poorer prognosis while a high percentage of regulatory T cells (Treg) in tumor tissue was associated with a more favorable prognostic factor (p=0.05). Also, a higher percentage of blood CD8+ T lymphocytes among CD45+ cells in NSND patients was associated with a better disease-free survival (p=0.004).

Conclusion: Granulocytes, monocytes-macrophages, and CD4+ T cells expressing CD45RO and CCR6 in blood and TME as well as serum IL-6 can therefore distinguish OSCC SD and NSND patients. Quantifying the proportion of CD4+ T cells expressing CD45RO and CCR6 and of Treg in SD patients and CD8+ T cells in NSND patients could help defining the prognostic of OSCC patients.

Keywords: non-drinker; non-smoker; oral cancer; oral squamous cell carcinoma; prognostic biomarker; tumor microenvironment.


Conflict of interest statement

The authors declare that the research was conducted in the absence of any commercial or financial relationships that could be construed as a potential conflict of interest.

Figures

Figure 1
Figure 1
Age and gender distribution of NSND and SD OSCC patients depending on their risk factors. □: female, ■: male; OSCC, Oral Squamous Cell Carcinoma; NSND, Non-Smoker/Non-Drinker; SD, Smoker/Drinker.
Figure 2
Figure 2
Analysis of the innate immune contents of tumor tissue and blood samples from OSCC patients and healthy donors according to risk factors (SD vs NSND). Data are presented either as absolute number of cells per mg of tumor or gingival tissue, or as absolute number of cells per µL of blood. (A) Analysis of leukocytes, granulocytes and monocytes-macrophages (Mo-Mϕ) of OSCC patients and healthy donors (HD); data from OSCC patients (□, 44 tumors and 87 blood samples from OSCC patients) were compared to those obtained from healthy donors (○, 18 normal gingival tissues and 53 blood samples). (B) Analysis of leukocytes, granulocytes and monocytes-macrophages (Mo-Mϕ) of OSCC patients and healthy donors depending on risk factors exposition. Data from SD (■) and NSND (□) OSCC patients were compared to those obtained from SD (●) and NSND (○) healthy donors. 14 tumors and 28 blood samples from NSND OSSC patients and from 30 tumors and 59 blood samples from SD OSCC patients, and 9 normal gingival tissues and 19 blood samples from NSND healthy donors and from 9 normal gingival tissues and 34 blood samples from SD healthy donors were analyzed by flow cytometry. For statistical analysis, a Mann-Whitney test was used. Bars represent the standard error of the mean (SEM). *p ≤ 0.05; **p ≤ 0.01; *** p ≤ 0.001; ns: not significant.
Figure 3
Figure 3
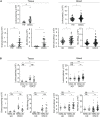
Analysis of the adaptive immune contents of tumor tissue and blood samples from OSCC patients and healthy donors according to risk factors (SD vs NSND). Data are presented either as percentages of cells among CD45+ cells or CD4+ T cells, or as absolute number of cells per µL of blood. (A) Tissue analysis and (B) Blood analysis, of B lymphocytes, CD4+ and CD8+ T cells among CD45+ cells (upper panels), and of Treg and CD45RO+CCR6+ cells among CD4+ T cells (lower panels) of OSCC patients and healthy donors depending on risk factors exposition. Data from SD (■) and NSND (□) patients were compared to those obtained from SD (●) and NSND (○) healthy donors (14 tumors and 28 blood samples from NSND OSSC patients; 30 tumors and 59 blood samples from SD OSCC patients; 9 normal gingival tissues and 19 blood samples from NSND healthy donors; 9 normal gingival tissues and 34 blood samples from SD healthy donors). For statistical analysis, a Mann-Whitney test was used. Bars represent the standard error of the mean (SEM). *p ≤ 0.05; *** p ≤ 0.001; ****p ≤ 0.0001; ns: not significant.
Figure 4
Figure 4
Analysis of IL-17+CD4+CD3+ T cells and of IL-6 production. (A) Percentage of IL-17+ blood cells detected in CD4+CD3+ gated cells analyzed by flow-cytometry as described in Materials and Methods. Data are presented as percentages of cells among CD4+ T cells or by pg IL-6 per mL of serum or tumor supernatant. Data from 15 SD OSCC patients (■) were compared to those from 22 NSND OSCC patients (□). (B) Detection of IL-6 in serums from 15 SD (■) and 11 NSND (□) OSCC patients were compared to 5 NSND (○) and 13 SD (●) healthy donors. (C) Detection of IL-6 in tumor supernatants from 7 SD (■) and 4 NSND (□) OSCC patients. For statistical analysis, a Mann-Whitney test was used. Bars represent the standard error of the mean (SEM). *p ≤ 0.05; **p ≤ 0.01; ns: not significant.
Figure 5
Figure 5
Analysis of circulating CD45RO+CCR6+ cells (left panel) and Treg (right panel) in patients at early and advanced OSCC stages. (A) The presence of circulating CD45RO+CCR6+ cells was analyzed in 28 NSND (□) (11 early and 17 advanced stages) and 52 SD (■) (15 early and 37 advanced stages) OSCC patients. (B) The presence of circulating Treg was analyzed in 27 NSND (□) (10 early and 17 advanced stages) and in 52 SD (■) (14 early and 38 advanced stages) OSCC patients were analyzed for Treg. Early stage: stages I and II; advanced stage (Adv): stages III and IV. For statistical analysis, a Mann-Whitney test was used. Bars represent the standard error of the mean (SEM). *p ≤ 0.05; ns: not significant.
Figure 6
Figure 6
Disease-Free Survival (DFS) of OSCC patients. (A) DFS of NSND patients (left panels) and SD patients (right panels), dichotomized to the medians of percentages of CD45RO+CCR6+CD4+ T cells (19.2%) (upper panels) and Treg (18.6%) (lower panels) in TME. (B) DFS of NSND patients (left panels) and SD patients (right panels), dichotomized to the medians of CD45RO+CCR6+CD4+ cells (30%) (upper panels), of granulocytes (66%) (middle panels) and of CD8+ T cells (4.7%) (lower panels) in blood. The cut-off for each cell subset is the median value obtained for the whole cohort of patients (87 OSCC). Kaplan-Meier Disease-Free Survival curves are presented. The blue and red lines represent patients exhibiting percentages of the indicated cell population above and below the cut-off value, respectively. The Log-Rank test was used to calculate the differences observed between the groups of patients. p ≤ 0.05 was considered as significant.

References

    1. Mello FW, Melo G, Pasetto JJ, Silva CAB, Warnakulasuriya S, Rivero ERC. The synergistic effect of tobacco and alcohol consumption on oral squamous cell carcinoma: a systematic review and meta-analysis. Clin Oral Invest (2019) 23:2849–59. doi: 10.1007/s00784-019-02958-1 - DOI - PubMed
    1. Dahlstrom KR, Little JA, Zafereo ME, Lung M, Wei Q, Sturgis EM. Squamous cell carcinoma of the head and neck in never smoker-never drinkers: a descriptive epidemiologic study. Head Neck (2008) 30:75–84. doi: 10.1002/hed.20664 - DOI - PubMed
    1. Hussein AA, Helder MN, de Visscher JG, Leemans CR, Braakhuis BJ, de Vet HCW, et al. . Global incidence of oral and oropharynx cancer in patients younger than 45 years versus older patients: A systematic review. Eur J Cancer (2017) 82:115–27. doi: 10.1016/j.ejca.2017.05.026 - DOI - PubMed
    1. Mneimneh WS, Xu B, Ghossein C, Alzumaili B, Sethi S, Ganly I, et al. . Clinicopathologic characteristics of young patients with oral squamous cell carcinoma. Head Neck Pathol (2021) 15:1099–108. doi: 10.1007/s12105-021-01320-w - DOI - PMC - PubMed
    1. Satgunaseelan L, Allanson BM, Asher R, Reddy R, Low HTH, Veness M, et al. . The incidence of squamous cell carcinoma of the oral tongue is rising in young non-smoking women: An international multi-institutional analysis. Oral Oncol (2020) 110:104875. doi: 10.1016/j.oraloncology.2020.104875 - DOI - PubMed