Treatment attrition rates and relevant risk factors in multiple myeloma: A real-world study in China
- PMID: 36713847
- PMCID: PMC9877623
- DOI: 10.3389/fphar.2023.979111
Treatment attrition rates and relevant risk factors in multiple myeloma: A real-world study in China
Abstract
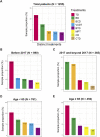
Background: For multiple myeloma (MM), the proportions of patients reaching the subsequent line of therapy (LOT) decline gradually and real-world data describing the attrition rates of LOT in Chinese MM were limited. Herein, we investigated the attrition rates by subsequent LOTs and their relevant risk factors in MM patients in China. Methods: MM patients who had been hospitalized and received at least one LOT from January 2008 to August 2019 in West China Hospital Sichuan University were retrospectively recruited. Demographic and clinical characteristic data were obtained from the "HemaTank" Chinese Multiple Myeloma Database. The Cox proportional hazards regression model was applied to analyze the risk factors of frontline treatment attrition. Results: A total of 1,255 newly diagnosed MM were enrolled, with 573 (45.7%) patients receiving only one LOT and 682 (54.3%) patients receiving more than one LOT. Thalidomide with dexamethasone/prednisone was the most common frontline treatment before 2017, while bortezomib-based regimens constituted the majority of frontline treatment in 2017 and beyond. The attrition rates from the first to the fifth LOT exhibited a gradual upward trend (45.7%, 48.7%, 58.9% and 62.5%, respectively). Meanwhile, 54.3%, 27.9%, 11.5%, and 4.3% of all the enrolled MM patients received a second, third, fourth and fifth LOT. MM who underwent autologous stem cell transplantation (ASCT) showed lower attrition rates across all LOTs (range 12%-56.8%) than MM without ASCT (range 49.1%-64.5%). The multivariate Cox regression model revealed that ISS stage III (HR 2.07, p < .001), elevated LDH (HR 1.47, p = .006), and comorbidities such as amyloidosis (HR 1.63, p = 0 .01), hepatic disease (HR 1.36, p = .022), pulmonary disease (HR 1.38, p = .022), and cardiac disease (HR 1.62, p = .004) were independent risk factors for MM patients attritted from the frontline treatment. Conclusion: In this study, the attrition rates were generally high and increased gradually across all LOTs. Nearly half of MM patients received only one LOT, and higher tumor burden and more comorbidities may be associated with fewer subsequent LOTs. The high attrition rates highlight the importance of applying the most optimal frontline treatment regimen rather than salvaging subsequent LOTs.
Keywords: attrition rate; frontline treatment; line of therapy; multiple myeloma; transplant.
Copyright © 2023 Tang, Yang, Li, Zhang, Li, Wang, Liao, Zhang, Qu, Zheng and Niu.
Conflict of interest statement
The authors declare that the research was conducted in the absence of any commercial or financial relationships that could be construed as a potential conflict of interest.
Figures


References
LinkOut - more resources
Full Text Sources

