. 2023 Apr:103:101983.
doi: 10.1016/j.socec.2023.101983. Epub 2023 Jan 24.

Expectations, reference points, and compliance with COVID-19 social distancing measures

Affiliations

Expectations, reference points, and compliance with COVID-19 social distancing measures

Guglielmo Briscese et al. J Behav Exp Econ. 2023 Apr.

Abstract

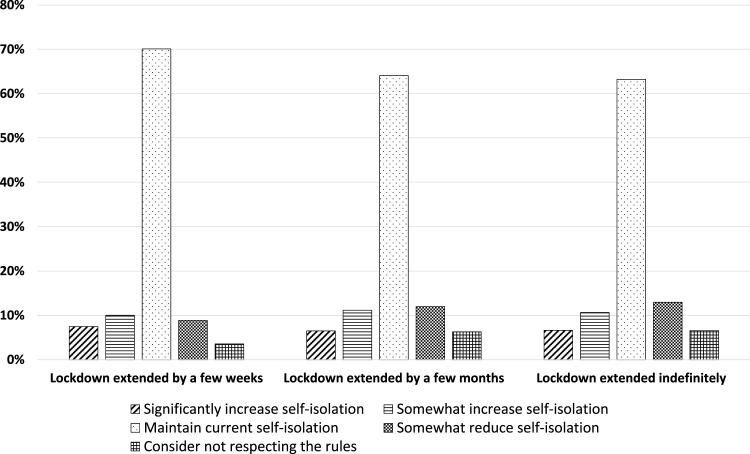
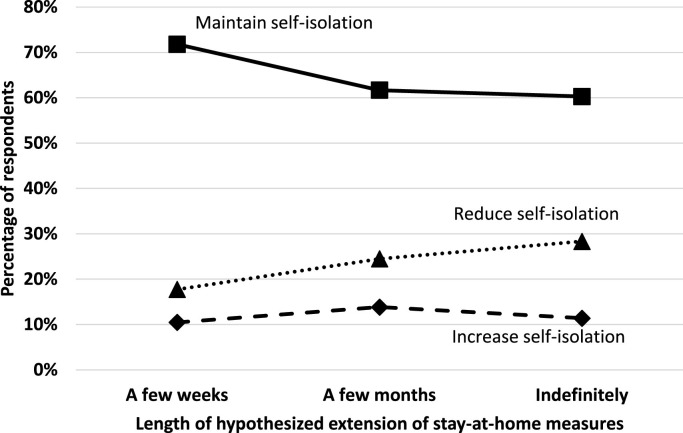
We study the behavioral impact of announcements about the duration of a policy and their relationship with people's expectations in the context of the COVID-19 lockdowns. We surveyed representative samples of Italian residents at three moments of the first wave of the pandemic to test how intentions to comply with social-isolation measures depend on the duration of their possible extension. Individuals were more likely to reduce, and less likely to increase, their compliance effort if the hypothetical extension was longer than they expected, whereas positive surprises had a lesser impact. The behavioral response to the (mis)match between expected versus hypothesized extensions is consistent with expectations acting as reference points and can help explain the increase in observed physical proximity in Italy following lockdown extension announcements. Our findings suggest that public authorities should consider citizens' expectations when announcing policy changes.

Keywords: COVID-19; Compliance; Expectations; Reference points.


Conflict of interest statement

The authors declare that they have no known competing financial interests or personal relationships that could have appeared to influence the work reported in this paper.

Figures

Fig 1
Fig. 1
Timeline of COVID-19 epidemic and policy responses in Italy: February-May 2020. Notes: Source: authors’ calculations based on European center for Disease Prevention and Control data. Last update May 19, 2020. The first survey ran on March 18–20, 2020, the second on April 8–10, and the third on April 22–24.
Fig 2
Fig. 2
Estimated physical proximity across Italian provinces around key milestone events.
Fig 3
Fig. 3
Expected end date of self-isolation measures. Notes: The graph reports the sampling-weighted proportions of respondents who reported their expectation that the self-isolation measures would end as planned, or be extended by a few weeks, a few months, or until necessary. The design-based F statistic for equality of distribution of expectations between the three rounds is 73.1 (p<0.001).
Fig 4
Fig. 4
Self-isolation intentions, by hypothesized duration of lockdown extension and (mis)match between expectations and extension scenarios. Notes: The graph reports the sampling-weighted proportion of respondents who stated their intention to increase, maintain, or reduce their compliance with self-isolation measures, by hypothesized extension scenarios (Panel A) and by (mis)match between the hypothesized extension scenarios and their expectation about this extension (Panel B). “Increase self-isolation” corresponds to the intention to either “increase substantially” or “increase somewhat” self-isolation; “Reduce self-isolation” includes the options “reduce somewhat” or “consider not complying with restrictions”; “Maintain self-isolation” indicates intention to “continue with current self-isolation behavior”. The vertical lines represent 95% design-based confidence intervals. The design-based F statistic for the test of equality of distribution in the three hypothesized extension cases in Panel A is 21.9 (p<0.001); the equivalent statistic for equality of distribution of intentions to comply in the three (mis)match cases in Panel B is 18.29 (p<0.001).
Fig 5
Fig. 5
Mismatch between expectations and extension scenarios and self-isolation intentions, by compliance with recommended self-isolation behaviors. Notes: The graph reports the sampling-weighted proportion of respondents who stated their intention to increase, maintain, or reduce their compliance with self-isolation measures, by (mis)match between the hypothesized extension scenarios and their expectation about this extension, separately for respondents who were partially compliant (Panel A) and fully compliant (Panel B) with recommended self-isolation behaviors (the question on which this measure is based is only available for rounds 1 and 3). “Increase self-isolation” corresponds to the intention to either “increase substantially” or “increase somewhat” self-isolation; “Reduce self-isolation” includes the options “reduce somewhat” or “consider not complying with restrictions”; “Maintain self-isolation” indicates intention to “continue with current self-isolation behavior”. The vertical lines represent 95% design-based confidence intervals.
Fig C1
Fig. C1
Self-isolation intentions, by hypothesized duration of lockdown extension. Notes: The chart reports the share of respondents who indicated their intention to maintain, increase or reduce their compliance with self-solation provisions, separately by the different extension scenarios. We used sampling weights to compute these statistics (SWG provided the weights).
Fig C2
Fig. C2
Self-isolation intentions, by (mis)match between expectations and extension scenarios, by round. Notes: “Increase self-isolation” corresponds to the intention to either “increase substantially” or “increase somewhat” self-isolation; “Reduce self-isolation” includes the options “reduce somewhat” or “consider not complying with restrictions”; “Maintain self-isolation” indicates intention to “continue with current self-isolation behavior”. We used frequency weights to compute these statistics (SWG provided the weights).
Fig C3
Fig. C3
Self-isolation intentions, by hypothesized duration of lockdown extension and (mis)match between expectations and extension scenarios Round 3, first (randomly assigned) scenario. Notes: The graph reports the sampling-weighted proportion of respondents who stated their intention to increase, maintain, or reduce their compliance with self-isolation measures, by hypothesized extension scenarios. The data are limited to the first (randomly assigned) scenario shown to participants in round 3. “Increase self-isolation” corresponds to the intention to either “increase substantially” or “increase somewhat” self-isolation; “Reduce self-isolation” includes the options “reduce somewhat” or “consider not complying with restrictions”; “Maintain self-isolation” indicates intention to “continue with current self-isolation behavior”.
Fig C4
Fig. C4
Self-isolation intentions, by and (mis)match between expectations and extension scenarios, limited to the first extension scenario per respondent. Notes: The graph reports the sampling-weighted proportion of respondents who stated their intention to increase, maintain, or reduce their compliance with self-isolation measures, by (mis)match between the hypothesized extension scenarios and their expectation about this extension. We group together the “much shorter” and “shorter categories under the “Shorter” label, and the “longer” and “much longer” categories under the “Longer” label. “Increase self-isolation” corresponds to the intention to either “increase substantially” or “increase somewhat” self-isolation; “Reduce self-isolation” includes the options “reduce somewhat” or “consider not complying with restrictions”; “Maintain self-isolation” indicates intention to “continue with current self-isolation behavior”.

References

    1. Abeler J., Falk A., Goette L., Huffman D. Reference points and effort provision. American Economic Review. 2011;101(2):470–492.
    1. Akesson J., Ashworth-Hayes S., Hahn R., Metcalfe R.D., Rasooly I. Fatalism, beliefs, and behaviors during the COVID-19 pandemic. Journal of Risk and Uncertainty. 2022;64(2):147–190. - PMC - PubMed
    1. Auld M.C. Choices, beliefs, and infectious disease dynamics. Journal of Health Economics. 2003;22(3):361–377. - PubMed
    1. Barrios J.M., Benmelech E., Hochberg Y.V., Sapienza P., Zingales L. Civic capital and social distancing during the COVID-19 pandemic. Journal of Public Economics. 2021;193 doi: 10.1016/j.jpubeco.2020.104310. - DOI - PMC - PubMed
    1. Bertoni M., Corazzini L., Robone S. The good outcome of bad news: A field experiment on formatting breast cancer screening invitation letters. American Journal of Health Economics. 2020;6(3):372–409.

LinkOut - more resources